Grundläggande statistik
| Institutionella ägare | 94 total, 94 long only, 0 short only, 0 long/short - change of −5,05% MRQ |
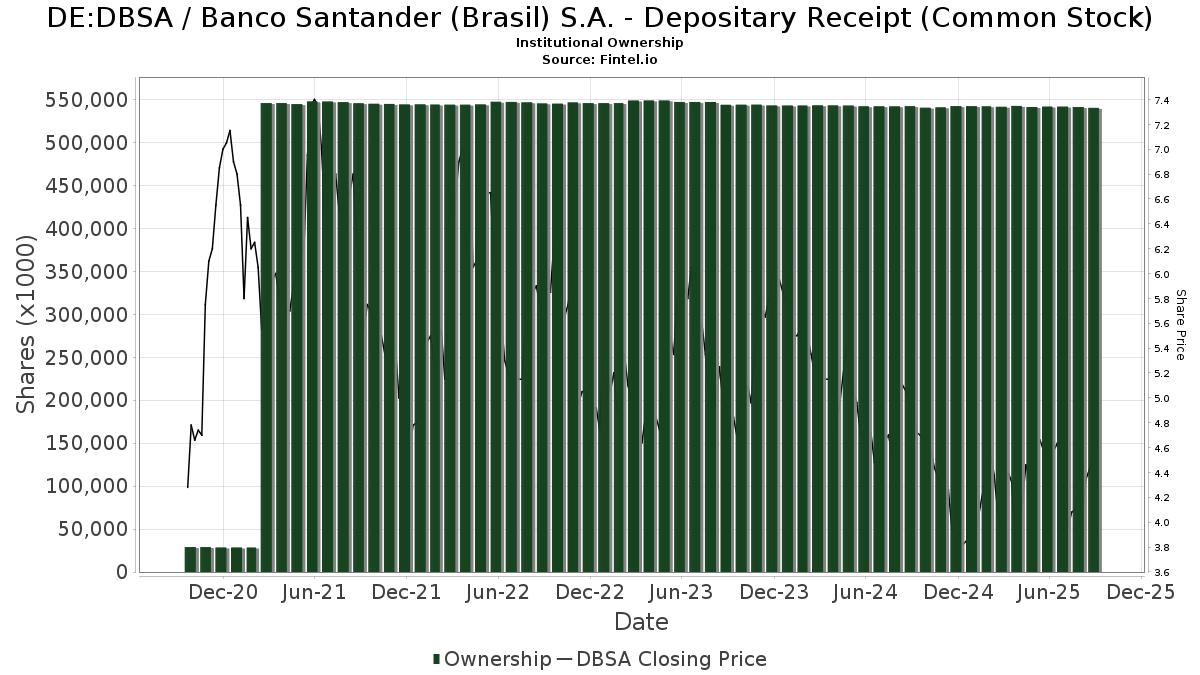
| Aktiepris | 4,58 |
| Genomsnittlig portföljallokering | 0.2274 % - change of 5,51% MRQ |
| Institutionella aktier (lång) | 540 309 402 (ex 13D/G) - change of −1,44MM shares −0,27% MRQ |
| Institutionellt värde (lång) | $ 2 942 782 USD ($1000) |
Institutionellt ägande och aktieägare
Banco Santander (Brasil) S.A. - Depositary Receipt (Common Stock) (DE:DBSA) har 94 Institutionella ägare och aktieägare som har lämnat in 13D/G- eller 13F-formulär till Securities Exchange Commission (SEC). Dessa institut innehar totalt 540,309,402 aktier. Största aktieägare inkluderar Banco Santander, S.A., Macquarie Group Ltd, Vanguard Group Inc, VEIEX - Vanguard Emerging Markets Stock Index Fund Investor Shares, DEMAX - Delaware Emerging Markets Fund Class A, Arrowstreet Capital, Limited Partnership, FRDM - Freedom 100 Emerging Markets ETF, BlackRock, Inc., Morgan Stanley, and Wellington Management Group Llp .
Banco Santander (Brasil) S.A. - Depositary Receipt (Common Stock) (DB:DBSA) Institutionell ägarstruktur visar institutioners och fonders nuvarande positioner i företaget, samt de senaste förändringarna i positionernas storlek. Större aktieägare kan vara enskilda investerare, fonder, hedgefonder eller institutioner. Bilaga 13D visar att investeraren äger (eller ägde) mer än 5% av företaget och avser (eller avsåg) att aktivt eftersträva en förändring av affärsstrategin. Schedule 13G indikerar en passiv investering på över 5%.
The share price as of September 8, 2025 is 4,58 / share. Previously, on September 9, 2024, the share price was 4,98 / share. This represents a decline of 8,03% over that period.
Fondsentimentets poäng
Fondsentimentet poängen(fka Ägarackumulation-poäng) visar vilka aktier som är mest köpta av fonder. Det är resultatet av en sofistikerad kvantitativ flerfaktormodell som identifierar företag med de högsta nivåerna av institutionell ackumulering. Poängsättningsmodellen använder en kombination av den totala ökningen av redovisade ägare, förändringarna i portföljallokeringarna för dessa ägare och andra mått. Siffran sträcker sig från 0 till 100, där högre siffror indikerar en högre nivå av ackumulering i förhållande till sina konkurrenter, och 50 är genomsnittet.
Uppdateringsfrekvens: Dagligen
Se Ownership Explorer, som innehåller en lista över de högst rankade företagen.
13F- och NPORT-arkiveringar
Detaljer om 13F-arkiveringar är gratis. Detaljer om NP-arkiveringar kräver ett premiummedlemskap. Gröna rader indikerar nya positioner. Röda rader indikerar stängda positioner. Klicka på länk symbolen för att se hela transaktionshistoriken.
Uppgradera
för att låsa upp premiumdata och exportera till Excel ![]() .
.
| Fil Datum | Källa | Investerare | Typ | Genomsnittligt pris (beräknat) |
Aktier | Δ Aktier (%) |
Rapporterat värde (1000 USD) |
Δ Värde (%) |
Portföljallokering (%) |
|
|---|---|---|---|---|---|---|---|---|---|---|
| 2025-08-04 | 13F | Spire Wealth Management | 2 046 | 0,00 | 11 | 22,22 | ||||
| 2025-08-14 | 13F | Aqr Capital Management Llc | 16 121 | 88 | ||||||
| 2025-08-14 | 13F | Verition Fund Management LLC | 71 540 | 390 | ||||||
| 2025-07-07 | 13F | Northwest & Ethical Investments L.P. | 0 | −100,00 | 0 | −100,00 | ||||
| 2025-08-14 | 13F | Two Sigma Investments, Lp | 118 202 | −71,62 | 644 | −67,18 | ||||
| 2025-07-28 | NP | AVSE - Avantis Responsible Emerging Markets Equity ETF | 9 393 | 68,12 | 49 | 100,00 | ||||
| 2025-08-14 | 13F | Engineers Gate Manager LP | 18 910 | 40,91 | 103 | 63,49 | ||||
| 2025-08-13 | 13F | EverSource Wealth Advisors, LLC | 2 789 | 4 792,98 | 15 | |||||
| 2025-08-12 | 13F | MAI Capital Management | 927 | 5 | ||||||
| 2025-07-30 | NP | APIE - ActivePassive International Equity ETF | 13 823 | 72 | ||||||
| 2025-08-05 | 13F | Simplex Trading, Llc | Call | 100 | −90,00 | 0 | ||||
| 2025-06-26 | NP | DFAE - Dimensional Emerging Core Equity Market ETF | 7 200 | 0,00 | 38 | 15,63 | ||||
| 2025-08-05 | 13F | NewSquare Capital LLC | 134 | 0,00 | 1 | |||||
| 2025-07-14 | 13F | GAMMA Investing LLC | 20 256 | 27,52 | 110 | 48,65 | ||||
| 2025-05-14 | 13F | EntryPoint Capital, LLC | 0 | −100,00 | 0 | |||||
| 2025-07-24 | 13F | Us Bancorp \de\ | 2 602 | 0,00 | 14 | 16,67 | ||||
| 2025-07-21 | 13F | Mirae Asset Global Investments Co., Ltd. | 13 126 | 8,18 | 72 | 24,56 | ||||
| 2025-08-12 | 13F | SRS Capital Advisors, Inc. | 149 | 0,00 | 1 | |||||
| 2025-08-14 | 13F | Hrt Financial Lp | 0 | −100,00 | 0 | |||||
| 2025-08-12 | 13F | Dimensional Fund Advisors Lp | 112 963 | 56,13 | 616 | 80,88 | ||||
| 2025-08-13 | 13F | Invesco Ltd. | 206 851 | 9,71 | 1 127 | 26,91 | ||||
| 2025-05-15 | 13F | Qube Research & Technologies Ltd | 0 | −100,00 | 0 | |||||
| 2025-08-26 | NP | Delaware Vip Trust - Delaware Vip Emerging Markets Series Standard Class | 153 366 | 0,00 | 836 | 15,65 | ||||
| 2025-08-08 | 13F | SBI Securities Co., Ltd. | 1 587 | −71,07 | 9 | −68,00 | ||||
| 2025-05-14 | 13F | Banco BTG Pactual S.A. | 0 | −100,00 | 0 | −100,00 | ||||
| 2025-08-01 | 13F | Banco Santander, S.A. | 520 218 168 | 0,00 | 2 835 189 | 15,71 | ||||
| 2025-08-14 | 13F | Citadel Advisors Llc | Call | 0 | −100,00 | 0 | ||||
| 2025-05-14 | 13F | Itau Unibanco Holding S.A. | 0 | −100,00 | 0 | |||||
| 2025-05-15 | 13F | Jain Global LLC | 0 | −100,00 | 0 | |||||
| 2025-08-14 | 13F | Two Sigma Securities, Llc | 16 320 | 89 | ||||||
| 2025-06-26 | NP | DFSE - Dimensional Emerging Markets Sustainability Core 1 ETF | 12 532 | 0,00 | 66 | 16,07 | ||||
| 2025-08-01 | 13F | May Hill Capital, LLC | 0 | −100,00 | 0 | |||||
| 2025-08-11 | 13F | Vanguard Group Inc | 3 101 965 | 0,00 | 16 906 | 15,71 | ||||
| 2025-08-14 | 13F/A | Skopos Labs, Inc. | 7 958 | −47,42 | 43 | −39,44 | ||||
| 2025-07-30 | 13F | Drive Wealth Management, Llc | 14 270 | 8,92 | 78 | 26,23 | ||||
| 2025-06-25 | NP | IEMGX - Voya Multi-Manager Emerging Markets Equity Fund Class I | 51 776 | −11,46 | 272 | 3,42 | ||||
| 2025-08-15 | 13F | Morgan Stanley | 848 263 | 684,12 | 4 623 | 808,25 | ||||
| 2025-08-08 | 13F | Pnc Financial Services Group, Inc. | 229 | −67,88 | 1 | −66,67 | ||||
| 2025-07-31 | 13F | R Squared Ltd | 21 000 | −14,60 | 114 | −0,87 | ||||
| 2025-08-11 | 13F | Principal Securities, Inc. | 0 | −100,00 | 0 | |||||
| 2025-08-13 | 13F | Quadrant Capital Group Llc | 0 | −100,00 | 0 | |||||
| 2025-08-13 | 13F | Northern Trust Corp | 23 987 | 13,65 | 131 | 31,31 | ||||
| 2025-08-12 | 13F | Deutsche Bank Ag\ | 260 000 | 0,00 | 1 417 | 15,77 | ||||
| 2025-08-14 | 13F | VPR Management LLC | 157 930 | 0,00 | 861 | 15,75 | ||||
| 2025-05-13 | 13F | Russell Investments Group, Ltd. | 0 | −100,00 | 0 | |||||
| 2025-08-14 | 13F | Vident Advisory, LLC | 0 | −100,00 | 0 | |||||
| 2025-08-14 | 13F | Bnp Paribas Arbitrage, Sa | 57 974 | 3 302,23 | 316 | 3 837,50 | ||||
| 2025-08-14 | 13F | Millennium Management Llc | 11 781 | 64 | ||||||
| 2025-06-26 | NP | DFEM - Dimensional Emerging Markets Core Equity 2 ETF | 3 112 | 0,00 | 16 | 14,29 | ||||
| 2025-08-12 | 13F | Jpmorgan Chase & Co | 642 | −99,81 | 4 | −99,81 | ||||
| 2025-08-13 | 13F | Marshall Wace, Llp | 0 | −100,00 | 0 | |||||
| 2025-08-06 | 13F | Savant Capital, LLC | 22 507 | 123 | ||||||
| 2025-08-29 | NP | MPLAX - Praxis International Index Fund Class A | 65 143 | 0,00 | 355 | 16,01 | ||||
| 2025-07-25 | NP | DEMAX - Delaware Emerging Markets Fund Class A | 2 751 128 | 0,00 | 14 306 | 19,27 | ||||
| 2025-08-07 | 13F | Connor, Clark & Lunn Investment Management Ltd. | 12 759 | 70 | ||||||
| 2025-08-14 | 13F | Mariner, LLC | 118 671 | 43,58 | 647 | 66,07 | ||||
| 2025-08-14 | 13F/A | Barclays Plc | 45 798 | 0 | ||||||
| 2025-07-24 | 13F | Jfs Wealth Advisors, Llc | 521 | 25,85 | 3 | 100,00 | ||||
| 2025-08-13 | 13F | Townsquare Capital Llc | 0 | −100,00 | 0 | |||||
| 2025-06-25 | NP | VVIFX - Voya VACS Series EME Fund | 64 528 | 0,00 | 339 | 16,49 | ||||
| 2025-07-08 | 13F | Parallel Advisors, LLC | 0 | −100,00 | 0 | |||||
| 2025-08-06 | 13F | Prospera Financial Services Inc | 127 365 | −2,35 | 694 | 13,03 | ||||
| 2025-08-13 | 13F | Guggenheim Capital Llc | 14 835 | −1,39 | 81 | 14,29 | ||||
| 2025-08-13 | 13F/A | StoneX Group Inc. | 0 | −100,00 | 0 | −100,00 | ||||
| 2025-07-28 | NP | AVEM - Avantis Emerging Markets Equity ETF This fund is a listed as child fund of American Century Companies Inc and if that institution has disclosed ownership in this security, then these positions will not be double counted when calculating total shares and total value | 678 222 | 24,58 | 3 527 | 48,59 | ||||
| 2025-08-14 | 13F | Goldman Sachs Group Inc | 201 989 | −16,52 | 1 101 | −3,42 | ||||
| 2025-07-28 | NP | AVXC - Avantis Emerging Markets ex-China Equity ETF | 7 129 | 37,49 | 37 | 68,18 | ||||
| 2025-07-15 | 13F | Public Employees Retirement System Of Ohio | 11 617 | 48,86 | 63 | 75,00 | ||||
| 2025-08-13 | 13F | Jump Financial, LLC | 41 907 | −43,62 | 228 | −34,86 | ||||
| 2025-08-15 | 13F | Tower Research Capital LLC (TRC) | 453 | −91,73 | 2 | −92,00 | ||||
| 2025-08-14 | 13F | Schonfeld Strategic Advisors LLC | 0 | −100,00 | 0 | |||||
| 2025-08-11 | 13F | Bell Investment Advisors, Inc | 2 568 | 43,95 | 14 | 62,50 | ||||
| 2025-08-12 | 13F | Rhumbline Advisers | 15 917 | 819,00 | 87 | 975,00 | ||||
| 2025-08-13 | 13F | Arrowstreet Capital, Limited Partnership | 2 526 757 | 5,06 | 13 771 | 21,57 | ||||
| 2025-08-14 | 13F | Bank Of America Corp /de/ | 291 643 | 50,51 | 1 589 | 74,23 | ||||
| 2025-07-28 | NP | AVEEX - Avantis Emerging Markets Equity Fund Institutional Class This fund is a listed as child fund of American Century Companies Inc and if that institution has disclosed ownership in this security, then these positions will not be double counted when calculating total shares and total value | 28 959 | 0,00 | 151 | 19,05 | ||||
| 2025-08-14 | 13F | Group One Trading, L.p. | 0 | −100,00 | 0 | |||||
| 2025-08-12 | 13F | O'shaughnessy Asset Management, Llc | 23 200 | 126 | ||||||
| 2025-08-14 | 13F | Sei Investments Co | 24 222 | 0,00 | 132 | 15,79 | ||||
| 2025-08-14 | 13F | Group One Trading, L.p. | Call | 0 | −100,00 | 0 | ||||
| 2025-08-12 | 13F | BlackRock, Inc. | 910 754 | 10,96 | 4 964 | 28,41 | ||||
| 2025-05-05 | 13F | Lindbrook Capital, Llc | 2 963 | 370,32 | 14 | 550,00 | ||||
| 2025-08-14 | 13F | Cubist Systematic Strategies, LLC | 0 | −100,00 | 0 | |||||
| 2025-08-14 | 13F | State Street Corp | 12 700 | 0,00 | 69 | 16,95 | ||||
| 2025-08-13 | 13F | Provida Pension Fund Administrator | 0 | −100,00 | 0 | −100,00 | ||||
| 2025-08-13 | 13F | Northwestern Mutual Wealth Management Co | 960 | 5 | ||||||
| 2025-08-14 | 13F | Wells Fargo & Company/mn | 4 725 | −31,85 | 26 | −21,87 | ||||
| 2025-08-04 | 13F | Hantz Financial Services, Inc. | 6 997 | 553,93 | 0 | |||||
| 2025-04-25 | NP | VCGEX - Emerging Economies Fund | 104 334 | 3,53 | 455 | 8,35 | ||||
| 2025-06-26 | NP | DEXC - Dimensional Emerging Markets ex China Core Equity ETF | 26 100 | 44,20 | 137 | 69,14 | ||||
| 2025-08-12 | 13F | Longfellow Investment Management Co Llc | 0 | −100,00 | 0 | |||||
| 2025-08-12 | 13F | American Century Companies Inc | 744 630 | 21,22 | 4 058 | 40,27 | ||||
| 2025-08-14 | 13F | Alliancebernstein L.p. | 163 947 | 894 | ||||||
| 2025-05-07 | 13F | LPL Financial LLC | 0 | −100,00 | 0 | |||||
| 2025-08-14 | 13F | Point72 Asset Management, L.P. | 261 860 | 120,42 | 1 427 | 155,28 | ||||
| 2025-06-30 | NP | VEIEX - Vanguard Emerging Markets Stock Index Fund Investor Shares | 3 101 965 | 0,00 | 16 316 | 16,63 | ||||
| 2025-08-14 | 13F | UBS Group AG | 118 100 | 147,72 | 644 | 187,05 | ||||
| 2025-05-14 | 13F | Hsbc Holdings Plc | 0 | −100,00 | 0 | |||||
| 2025-08-14 | 13F | Macquarie Group Ltd | 3 561 512 | −0,49 | 19 410 | 15,14 | ||||
| 2025-05-06 | 13F | Advisors Preferred, LLC | 0 | −100,00 | 0 | |||||
| 2025-07-18 | 13F | Robeco Institutional Asset Management B.V. | 0 | −100,00 | 0 | |||||
| 2025-08-12 | 13F | SPX Equities Gestao de Recursos Ltda | 0 | −100,00 | 0 | |||||
| 2025-08-04 | 13F | Assetmark, Inc | 14 | 0 | ||||||
| 2025-05-15 | 13F | Citadel Advisors Llc | Put | 0 | −100,00 | 0 | −100,00 | |||
| 2025-08-13 | 13F | Cerity Partners LLC | 16 354 | −46,58 | 89 | −38,19 | ||||
| 2025-08-13 | 13F | Renaissance Technologies Llc | 0 | −100,00 | 0 | |||||
| 2025-07-22 | 13F | Checchi Capital Advisers, LLC | 14 796 | 0,00 | 81 | 15,94 | ||||
| 2025-04-30 | 13F | Allworth Financial LP | 0 | −100,00 | 0 | |||||
| 2025-06-26 | NP | DFEV - Dimensional Emerging Markets Value ETF | 600 | 0,00 | 3 | 50,00 | ||||
| 2025-08-11 | 13F | Cordatus Wealth Management LLC | 126 733 | −2,36 | 1 | |||||
| 2025-08-14 | 13F | Jane Street Group, Llc | 0 | −100,00 | 0 | |||||
| 2025-08-14 | 13F | Citadel Advisors Llc | 19 934 | −89,88 | 109 | −88,35 | ||||
| 2025-08-29 | NP | FRDM - Freedom 100 Emerging Markets ETF | 1 276 577 | 16,76 | 6 957 | 35,11 | ||||
| 2025-08-14 | 13F | Headlands Technologies LLC | 232 | −27,27 | 1 | 0,00 | ||||
| 2025-08-14 | 13F | Aquatic Capital Management LLC | 84 539 | 82,86 | 461 | 111,98 | ||||
| 2025-07-11 | 13F | Farther Finance Advisors, LLC | 325 | 0,93 | 2 | 0,00 | ||||
| 2025-07-14 | 13F | UMA Financial Services, Inc. | 252 | 0,00 | 1 | 0,00 | ||||
| 2025-07-16 | 13F | Signaturefd, Llc | 10 140 | 2,71 | 55 | 19,57 | ||||
| 2025-08-14 | 13F | Wellington Management Group Llp | 749 206 | −53,35 | 4 083 | −46,02 | ||||
| 2025-07-31 | 13F | Caitong International Asset Management Co., Ltd | 733 | −2,79 | 4 | 0,00 | ||||
| 2025-08-14 | 13F | Two Sigma Advisers, Lp | 39 600 | −85,56 | 216 | −83,35 | ||||
| 2025-08-07 | 13F | Vise Technologies, Inc. | 17 253 | 94 | ||||||
| 2025-08-14 | 13F | Susquehanna International Group, Llp | 0 | −100,00 | 0 | |||||
| 2025-08-08 | 13F | Larson Financial Group LLC | 506 | 3 | ||||||
| 2025-05-21 | 13F | Acadian Asset Management Llc | 0 | −100,00 | 0 | −100,00 | ||||
| 2025-05-29 | 13F/A | Legal & General Group Plc | 76 800 | 0,00 | 380 | −13,47 | ||||
| 2025-08-12 | 13F | Proequities, Inc. | Put | 0 | 0 | |||||
| 2025-08-12 | 13F | Proequities, Inc. | Call | 0 | 0 | |||||
| 2025-08-12 | 13F | Proequities, Inc. | 0 | 0 | ||||||
| 2025-07-28 | NP | NSI - National Security Emerging Markets Index ETF | 3 017 | 38,59 | 16 | 66,67 | ||||
| 2025-09-04 | 13F/A | Advisor Group Holdings, Inc. | 1 660 | 9 | ||||||
| 2025-08-12 | 13F | XTX Topco Ltd | 0 | −100,00 | 0 |