Grundläggande statistik
| Institutionella aktier (lång) | 23 680 153 - 33,42% (ex 13D/G) - change of −3,36MM shares −12,44% MRQ |
| Institutionellt värde (lång) | $ 273 418 USD ($1000) |
Institutionellt ägande och aktieägare
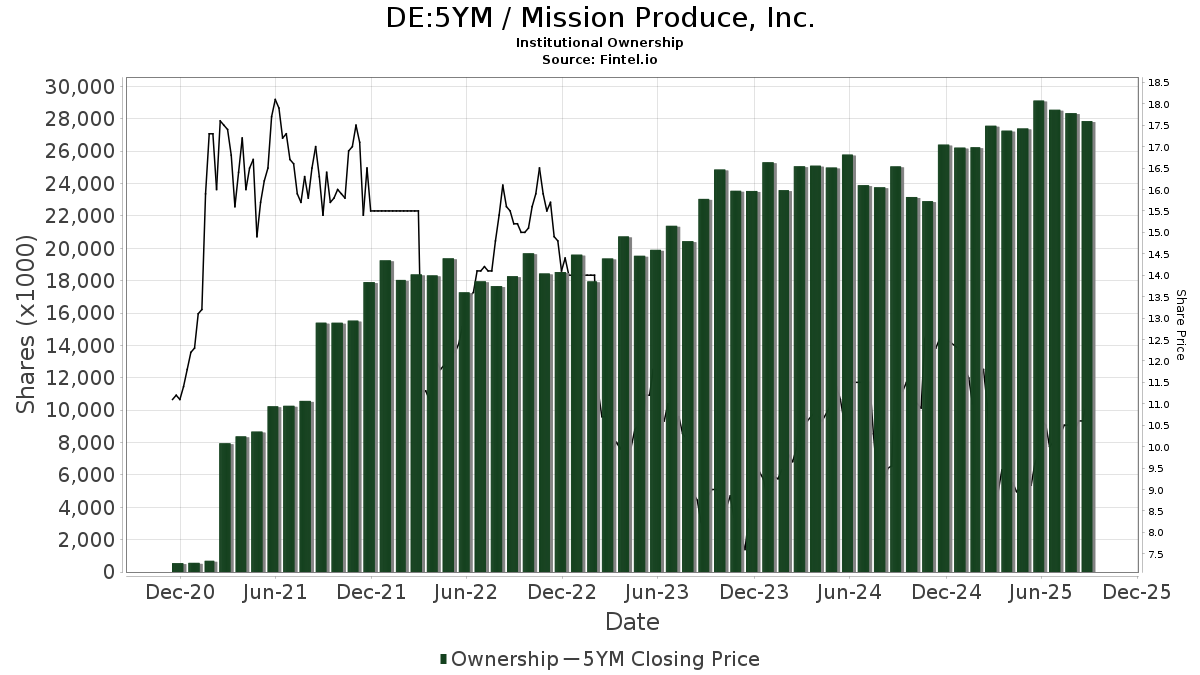
Mission Produce, Inc. (DE:5YM) har 155 Institutionella ägare och aktieägare som har lämnat in 13D/G- eller 13F-formulär till Securities Exchange Commission (SEC). Dessa institut innehar totalt 23,680,153 aktier. Största aktieägare inkluderar BlackRock, Inc., Vanguard Group Inc, Dimensional Fund Advisors Lp, American Century Companies Inc, State Street Corp, Geode Capital Management, Llc, Platform Wealth Management, LLC, Integrated Advisors Network LLC, Walnut Level Capital LLC, and Qube Research & Technologies Ltd .
Mission Produce, Inc. (DB:5YM) Institutionell ägarstruktur visar institutioners och fonders nuvarande positioner i företaget, samt de senaste förändringarna i positionernas storlek. Större aktieägare kan vara enskilda investerare, fonder, hedgefonder eller institutioner. Bilaga 13D visar att investeraren äger (eller ägde) mer än 5% av företaget och avser (eller avsåg) att aktivt eftersträva en förändring av affärsstrategin. Schedule 13G indikerar en passiv investering på över 5%.
The share price as of March 27, 2026 is 11,50 / share. Previously, on April 1, 2025, the share price was 9,50 / share. This represents an increase of 21,05% over that period.
Fondsentimentets poäng
Fondsentimentet poängen(fka Ägarackumulation-poäng) visar vilka aktier som är mest köpta av fonder. Det är resultatet av en sofistikerad kvantitativ flerfaktormodell som identifierar företag med de högsta nivåerna av institutionell ackumulering. Poängsättningsmodellen använder en kombination av den totala ökningen av redovisade ägare, förändringarna i portföljallokeringarna för dessa ägare och andra mått. Siffran sträcker sig från 0 till 100, där högre siffror indikerar en högre nivå av ackumulering i förhållande till sina konkurrenter, och 50 är genomsnittet.
Uppdateringsfrekvens: Dagligen
Se Ownership Explorer, som innehåller en lista över de högst rankade företagen.
AI+ Ask Fintel’s AI assistant about Mission Produce, Inc..
Select a question to share a public post with an AI-crafted answer.
Thinking of good questions…
13F- och NPORT-arkiveringar
Detaljer om 13F-arkiveringar är gratis. Detaljer om NP-arkiveringar kräver ett premiummedlemskap. Gröna rader indikerar nya positioner. Röda rader indikerar stängda positioner. Klicka på länk symbolen för att se hela transaktionshistoriken.
Uppgradera
för att låsa upp premiumdata och exportera till Excel ![]() .
.
| Fil Datum | Källa | Investerare | Typ | Genomsnittligt pris (beräknat) |
Aktier | Δ Aktier (%) |
Rapporterat värde (1000 USD) |
Δ Värde (%) |
Portföljallokering (%) |
|
|---|---|---|---|---|---|---|---|---|---|---|
| 2026-02-17 | 13F | Brevan Howard Capital Management LP | 0 | −100,00 | 0 | |||||
| 2026-02-12 | 13F | State Board Of Administration Of Florida Retirement System | 13 860 | 0,00 | 161 | −3,61 | ||||
| 2026-02-13 | 13F | Sterling Capital Management LLC | 2 460 | −16,44 | 29 | −20,00 | ||||
| 2026-03-06 | 13F | Hsbc Holdings Plc | 44 961 | 191,61 | 520 | 182,07 | ||||
| 2026-02-12 | 13F | New York State Common Retirement Fund | 9 509 | 0,00 | 110 | −3,51 | ||||
| 2026-02-23 | 13F | Virtu Financial LLC | 11 459 | 0 | ||||||
| 2026-01-05 | 13F | GAMMA Investing LLC | 4 589 | 87,08 | 53 | 82,76 | ||||
| 2026-01-23 | 13F | State of Alaska, Department of Revenue | 3 223 | 15,81 | 0 | |||||
| 2026-02-17 | 13F | Advisor Group Holdings, Inc. | 1 408 | −12,66 | 16 | −15,79 | ||||
| 2026-02-10 | 13F | Bnp Paribas Arbitrage, Sa | 123 715 | 941,64 | 1 435 | 910,56 | ||||
| 2026-02-13 | 13F | Quarry LP | 2 577 | 6,27 | 30 | 0,00 | ||||
| 2026-02-09 | 13F | Geode Capital Management, Llc | 1 048 598 | 0,36 | 12 166 | −3,15 | ||||
| 2026-01-14 | 13F | Spire Wealth Management | 400 | 0,00 | 5 | 0,00 | ||||
| 2026-02-12 | 13F | Campbell & CO Investment Adviser LLC | 35 795 | 47,11 | 415 | 42,12 | ||||
| 2026-02-13 | 13F | Ubs Asset Management Americas Inc | 137 101 | −1,62 | 1 590 | −5,07 | ||||
| 2026-01-28 | 13F | Teacher Retirement System Of Texas | 47 142 | −35,58 | 547 | −37,88 | ||||
| 2026-02-12 | 13F | JPL Wealth Management, LLC | 0 | −100,00 | 0 | |||||
| 2026-02-05 | 13F | Atria Investments Llc | 30 993 | 8,28 | 360 | 4,36 | ||||
| 2026-02-12 | 13F | Jane Street Group, Llc | Call | 41 400 | 480 | |||||
| 2026-02-12 | 13F | Jane Street Group, Llc | 213 147 | −9,71 | 2 473 | −12,87 | ||||
| 2025-10-15 | 13F | Harbor Capital Advisors, Inc. | 0 | −100,00 | 0 | |||||
| 2026-02-02 | 13F | Principal Financial Group Inc | 28 071 | 38,55 | 326 | 33,74 | ||||
| 2026-02-06 | 13F | IFP Advisors, Inc | 6 | 0,00 | 0 | |||||
| 2026-02-17 | 13F | MIRAE ASSET GLOBAL ETFS HOLDINGS Ltd. | 19 831 | 0,04 | 230 | −3,36 | ||||
| 2026-02-10 | 13F | Rothschild Investment Llc | 40 | 0,00 | 0 | |||||
| 2026-02-12 | 13F | Quadrant Capital Group Llc | 2 492 | 0,00 | 29 | −3,45 | ||||
| 2026-02-17 | 13F | Two Sigma Investments, Lp | 12 319 | 143 | ||||||
| 2026-01-30 | 13F | Turning Point Benefit Group, Inc. | 9 | 0,00 | 0 | |||||
| 2026-02-12 | 13F | Skopos Labs, Inc. | 0 | −100,00 | 0 | |||||
| 2026-02-10 | 13F | Bank of New York Mellon Corp | 167 404 | 2,71 | 1 942 | −0,92 | ||||
| 2026-02-11 | 13F | Nuance Investments, Llc | 491 807 | 10,70 | 5 705 | 6,82 | ||||
| 2026-02-17 | 13F | Zacks Investment Management | 18 592 | 216 | ||||||
| 2026-02-12 | 13F | MetLife Investment Management, LLC | 28 882 | 0,00 | 335 | −3,46 | ||||
| 2026-02-13 | 13F | Fourth Sail Capital LP | 62 525 | 725 | ||||||
| 2025-11-03 | 13F | Federated Hermes, Inc. | 0 | −100,00 | 0 | |||||
| 2026-02-11 | 13F | Parallel Advisors, LLC | 148 | 0,00 | 2 | 0,00 | ||||
| 2026-02-11 | 13F | LPL Financial LLC | 39 178 | −5,73 | 454 | −9,02 | ||||
| 2026-02-13 | 13F | Martingale Asset Management L P | 73 883 | −0,57 | 857 | −4,03 | ||||
| 2026-01-29 | 13F | Vanguard Group Inc | 2 871 240 | −0,36 | 33 306 | −3,84 | ||||
| 2026-02-10 | 13F | Connor, Clark & Lunn Investment Management Ltd. | 128 550 | −42,45 | 1 491 | −44,45 | ||||
| 2026-02-17 | 13F | Canada Pension Plan Investment Board | 12 600 | 146 | ||||||
| 2026-02-17 | 13F | Susquehanna Portfolio Strategies, LLC | 49 643 | −37,11 | 576 | −39,35 | ||||
| 2026-01-08 | 13F | True Wealth Design, LLC | 29 | 31,82 | 0 | |||||
| 2026-02-09 | 13F | Quest Partners LLC | 13 214 | 183,44 | 153 | 173,21 | ||||
| 2026-02-17 | 13F/A | RBF Capital, LLC | 74 410 | 0,00 | 863 | −3,47 | ||||
| 2026-02-13 | 13F | Parkside Financial Bank & Trust | 45 | 0,00 | 1 | |||||
| 2026-02-13 | 13F | Marshall Wace, Llp | 77 232 | 896 | ||||||
| 2026-01-23 | 13F | Farther Finance Advisors, LLC | 588 | 10,53 | 7 | 0,00 | ||||
| 2026-02-06 | 13F | Global Retirement Partners, LLC | 173 | 2 | ||||||
| 2026-02-13 | 13F | Prudential Financial Inc | 74 315 | −61,13 | 862 | −62,49 | ||||
| 2026-02-17 | 13F | Algert Global Llc | 42 493 | −61,95 | 0 | −100,00 | ||||
| 2026-02-13 | 13F | National Bank Of Canada /fi/ | 8 | 0 | ||||||
| 2026-02-17 | 13F | Prelude Capital Management, Llc | 18 666 | −10,59 | 217 | −13,60 | ||||
| 2025-10-09 | 13F | Voya Investment Management Llc | 0 | −100,00 | 0 | |||||
| 2026-02-12 | 13F | Swiss National Bank | 90 500 | 10,23 | 1 050 | 6,39 | ||||
| 2026-02-17 | 13F | Optiver Holding B.V. | 0 | −100,00 | 0 | |||||
| 2026-02-11 | 13F | Los Angeles Capital Management Llc | 123 099 | −13,92 | 1 409 | −18,03 | ||||
| 2026-01-08 | 13F | Sanders Morris Harris Llc | 0 | −100,00 | 0 | |||||
| 2026-02-17 | 13F | Trexquant Investment LP | 46 379 | −56,46 | 538 | −58,05 | ||||
| 2026-02-06 | 13F | Leonteq Securities AG | 2 704 | 0,00 | 31 | −3,12 | ||||
| 2026-02-17 | 13F | Raymond James Financial Inc | 12 884 | −15,16 | 149 | −18,13 | ||||
| 2026-02-13 | 13F | Dynamic Technology Lab Private Ltd | 0 | −100,00 | 0 | |||||
| 2026-02-19 | 13F | Invesco Ltd. | 81 206 | −9,13 | 942 | −12,38 | ||||
| 2026-01-29 | 13F | Comerica Bank | 30 724 | 0,37 | 356 | −3,00 | ||||
| 2026-02-13 | 13F | Rhumbline Advisers | 59 513 | −16,39 | 690 | −19,30 | ||||
| 2026-02-10 | 13F | Quantbot Technologies LP | 0 | −100,00 | 0 | |||||
| 2026-01-29 | 13F | UBS Group AG | 247 826 | 18,60 | 2 875 | 14,46 | ||||
| 2026-02-17 | 13F | XTX Topco Ltd | 19 259 | −9,68 | 223 | −12,89 | ||||
| 2026-02-12 | 13F | Commonwealth Equity Services, Llc | 404 256 | −0,94 | 4 689 | 117 125,00 | ||||
| 2026-02-17 | 13F | Point72 Asset Management, L.P. | 45 108 | 523 | ||||||
| 2026-02-17 | 13F | Magnetar Financial LLC | 43 969 | 263,20 | 510 | 251,72 | ||||
| 2026-02-11 | 13F | Group One Trading, L.p. | 1 800 | −30,77 | 21 | −35,48 | ||||
| 2026-02-12 | 13F | EntryPoint Capital, LLC | 22 737 | 264 | ||||||
| 2026-02-09 | 13F | Legal & General Group Plc | 42 294 | 23,19 | 491 | 18,93 | ||||
| 2026-01-26 | 13F | Whittier Trust Co | 0 | −100,00 | 0 | |||||
| 2026-02-17 | 13F | California State Teachers Retirement System | 43 187 | −27,77 | 501 | −30,36 | ||||
| 2026-02-10 | 13F | Goldman Sachs Group Inc | 510 340 | 26,88 | 5 920 | 22,45 | ||||
| 2025-11-14 | 13F | Polymer Capital Management (US) LLC | 0 | −100,00 | 0 | |||||
| 2026-02-17 | 13F | Jones Financial Companies Lllp | 100 | −20,00 | 1 | 0,00 | ||||
| 2026-01-20 | 13F | Signaturefd, Llc | 608 | 0,00 | 7 | 0,00 | ||||
| 2026-01-30 | 13F | Us Bancorp \de\ | 590 | 0,00 | 7 | −14,29 | ||||
| 2026-01-23 | 13F | Avion Wealth | 107 | 0,00 | 0 | |||||
| 2026-02-13 | 13F | Smartleaf Asset Management LLC | 399 | 167,79 | 5 | 300,00 | ||||
| 2026-02-17 | 13F | CWM Advisors, LLC | 40 562 | 7,15 | 471 | 3,30 | ||||
| 2025-11-14 | 13F | Walleye Capital LLC | 0 | −100,00 | 0 | |||||
| 2026-02-12 | 13F | Steward Partners Investment Advisory, Llc | 99 | 0,00 | 1 | 0,00 | ||||
| 2026-02-13 | 13F | Verition Fund Management LLC | 24 940 | 49,82 | 289 | 44,50 | ||||
| 2026-01-28 | 13F | Arizona State Retirement System | 12 754 | 1,80 | 148 | −2,00 | ||||
| 2026-02-17 | 13F | Balyasny Asset Management Llc | 18 067 | 210 | ||||||
| 2026-02-13 | 13F | American Century Companies Inc | 1 097 953 | 9,31 | 12 736 | 5,49 | ||||
| 2026-01-14 | 13F | Wedge Capital Management L L P/nc | 100 025 | 0,97 | 1 160 | −2,52 | ||||
| 2026-02-17 | 13F | Aqr Capital Management Llc | 43 646 | 5,13 | 506 | 1,40 | ||||
| 2026-02-13 | 13F | Charles Schwab Investment Management Inc | 351 196 | −0,11 | 4 074 | −3,62 | ||||
| 2026-02-13 | 13F | Virtus ETF Advisers LLC | 7 903 | 0,00 | 92 | −3,19 | ||||
| 2026-02-13 | 13F | Morgan Stanley | 270 491 | −8,10 | 3 138 | −11,31 | ||||
| 2026-02-13 | 13F | Mariner, LLC | 27 925 | 55,24 | 324 | 49,54 | ||||
| 2026-02-12 | 13F | Renaissance Technologies Llc | 104 800 | −67,85 | 1 216 | −68,99 | ||||
| 2026-02-18 | 13F | Mackenzie Financial Corp | 0 | −100,00 | 0 | |||||
| 2026-02-02 | 13F | Hussman Strategic Advisors, Inc. | 0 | −100,00 | 0 | |||||
| 2026-02-17 | 13F | Susquehanna Fundamental Investments, Llc | 12 244 | 0,00 | 142 | −3,40 | ||||
| 2026-02-17 | 13F | PharVision Advisers, LLC | 35 560 | 103,75 | 412 | 97,13 | ||||
| 2026-02-17 | 13F | Walnut Level Capital LLC | Call | 0 | −100,00 | 0 | ||||
| 2026-01-09 | 13F | SG Americas Securities, LLC | 26 549 | 14,31 | 0 | |||||
| 2026-01-26 | 13F | Cwm, Llc | 1 409 | −2,02 | 0 | |||||
| 2026-02-17 | 13F | Man Group plc | 0 | −100,00 | 0 | |||||
| 2026-02-17 | 13F | Quadrature Capital Ltd | 23 871 | 277 | ||||||
| 2026-02-17 | 13F | Citadel Advisors Llc | 75 011 | −59,94 | 870 | −61,33 | ||||
| 2026-02-12 | 13F | Davy Global Fund Management Ltd | 71 163 | −10,76 | 825 | −13,88 | ||||
| 2025-10-24 | 13F | New York State Teachers Retirement System | 0 | −100,00 | 0 | |||||
| 2026-02-17 | 13F | D. E. Shaw & Co., Inc. | 187 594 | −4,19 | 2 176 | −7,52 | ||||
| 2026-02-09 | 13F | Penn Capital Management Co Inc | 0 | −100,00 | 0 | |||||
| 2026-02-17 | 13F | Citadel Advisors Llc | Call | 31 400 | −20,10 | 364 | −22,88 | |||
| 2026-02-17 | 13F | Bank Of America Corp /de/ | 48 848 | 47,43 | 567 | 42,21 | ||||
| 2026-02-11 | 13F | Jpmorgan Chase & Co | 17 411 | −1,58 | 202 | −5,19 | ||||
| 2026-02-14 | 13F | Rockefeller Capital Management L.P. | 267 | 0,00 | 3 | 0,00 | ||||
| 2026-02-06 | 13F | Covestor Ltd | 111 | −11,90 | 0 | |||||
| 2026-02-10 | 13F | State of Wyoming | 0 | −100,00 | 0 | |||||
| 2026-02-12 | 13F | Cutler Investment Counsel Llc | 211 750 | −0,47 | 2 456 | −3,95 | ||||
| 2026-02-17 | 13F | Price T Rowe Associates Inc /md/ | 25 502 | 13,40 | 0 | |||||
| 2026-01-27 | 13F | Zurcher Kantonalbank (Zurich Cantonalbank) | 16 964 | 197 | ||||||
| 2026-02-17 | 13F | Susquehanna International Group, Llp | Call | 117 300 | 501,54 | 1 361 | 481,20 | |||
| 2026-02-10 | 13F | Intech Investment Management Llc | 18 077 | −13,57 | 210 | −16,73 | ||||
| 2026-02-13 | 13F | State Street Corp | 1 050 899 | −4,73 | 12 190 | −8,06 | ||||
| 2026-01-28 | 13F | Universal- Beteiligungs- und Servicegesellschaft mbH | 15 634 | 1,68 | 181 | −1,63 | ||||
| 2026-02-17 | 13F | Alliancebernstein L.p. | 43 190 | 0,01 | 501 | −3,47 | ||||
| 2026-02-06 | 13F | Pnc Financial Services Group, Inc. | 277 | 0,00 | 3 | 0,00 | ||||
| 2026-02-17 | 13F | Janus Henderson Group Plc | 18 210 | 0,00 | 211 | −3,21 | ||||
| 2026-02-11 | 13F | Fox Run Management, L.l.c. | 20 152 | 234 | ||||||
| 2026-02-13 | 13F | Wells Fargo & Company/mn | 63 538 | 31,25 | 737 | 26,85 | ||||
| 2026-01-29 | 13F | Cornerstone Investment Partners, LLC | 13 312 | 0,06 | 154 | −3,14 | ||||
| 2025-11-14 | 13F | Wolverine Trading, Llc | 12 105 | 144 | ||||||
| 2026-01-09 | 13F | Diversified Trust Co | 17 299 | 14,19 | 201 | 9,89 | ||||
| 2026-02-11 | 13F | Franklin Resources Inc | 28 254 | 0,00 | 328 | −3,54 | ||||
| 2026-02-17 | 13F | Ameriprise Financial Inc | 20 066 | 233 | ||||||
| 2026-02-17 | 13F | Oxford Asset Management Llp | 45 122 | 523 | ||||||
| 2026-02-17 | 13F | Quantinno Capital Management LP | 67 343 | 22,21 | 781 | 17,98 | ||||
| 2026-02-11 | 13F | Deutsche Bank Ag\ | 42 128 | 7,38 | 489 | 3,61 | ||||
| 2026-02-13 | 13F | Police & Firemen's Retirement System of New Jersey | 12 198 | 0,00 | 141 | −3,42 | ||||
| 2026-02-17 | 13F | Walnut Level Capital LLC | 790 381 | −26,52 | 9 168 | −29,08 | ||||
| 2025-11-14 | 13F | Aquatic Capital Management LLC | 0 | −100,00 | 0 | |||||
| 2026-02-05 | 13F | Amalgamated Bank | 1 341 | −19,07 | 0 | |||||
| 2026-02-13 | 13F | Panagora Asset Management Inc | 77 860 | 2,84 | 903 | −0,77 | ||||
| 2026-02-17 | 13F | Russell Investments Group, Ltd. | 4 957 | −9,30 | 58 | −12,31 | ||||
| 2026-02-17 | 13F | State Of Wisconsin Investment Board | 45 348 | −3,57 | 526 | −6,90 | ||||
| 2026-02-12 | 13F | Dimensional Fund Advisors Lp | 2 689 681 | 4,62 | 31 200 | 0,97 | ||||
| 2026-02-17 | 13F | Gallagher Fiduciary Advisors, LLC | 30 884 | 7,53 | 358 | 3,77 | ||||
| 2026-02-06 | 13F | EverSource Wealth Advisors, LLC | 1 026 | −7,90 | 12 | −15,38 | ||||
| 2025-10-17 | 13F | Ethic Inc. | 0 | −100,00 | 0 | −100,00 | ||||
| 2026-02-11 | 13F | Cerity Partners LLC | 76 975 | 893 | ||||||
| 2026-02-17 | 13F | Qube Research & Technologies Ltd | 534 758 | 56,24 | 6 203 | 50,78 | ||||
| 2026-01-29 | 13F | Inscription Capital, LLC | 10 404 | 1,19 | 121 | −2,44 | ||||
| 2026-02-13 | 13F | Barclays Plc | 80 858 | 20,52 | 938 | 8,95 | ||||
| 2026-02-17 | 13F | Public Employees Retirement System Of Ohio | 7 035 | 465,97 | 82 | 478,57 | ||||
| 2026-01-08 | 13F | Versant Capital Management, Inc | 1 645 | 8,08 | 19 | 5,56 | ||||
| 2026-02-17 | 13F | Royal Bank Of Canada | 1 403 | −49,06 | 16 | −51,52 | ||||
| 2026-02-12 | 13F | Nuveen, LLC | 83 930 | −4,90 | 974 | −8,21 | ||||
| 2026-02-11 | 13F | Ameritas Investment Partners, Inc. | 3 565 | 41 | ||||||
| 2026-02-17 | 13F | Fmr Llc | 3 818 | −16,16 | 44 | −18,52 | ||||
| 2026-01-15 | 13F | Nisa Investment Advisors, Llc | 744 | −36,25 | 9 | −42,86 | ||||
| 2026-02-17 | 13F | Susquehanna International Group, Llp | 0 | −100,00 | 0 | |||||
| 2026-02-10 | 13F | Platform Wealth Management, LLC | 1 045 703 | 12 130 | ||||||
| 2025-11-07 | 13F | BNP Paribas Asset Management Holding S.A. | 0 | −100,00 | 0 | |||||
| 2026-02-17 | 13F | Lazard Asset Management Llc | 165 861 | −26,53 | 1 924 | −29,12 | ||||
| 2026-02-13 | 13F | Citigroup Inc | 6 085 | −1,81 | 71 | −5,41 | ||||
| 2026-01-28 | 13F | Klp Kapitalforvaltning As | 9 800 | −20,97 | 114 | −24,16 | ||||
| 2026-02-12 | 13F | BlackRock, Inc. | 3 623 423 | 1,62 | 42 032 | −1,93 | ||||
| 2026-02-13 | 13F | Arrowstreet Capital, Limited Partnership | 436 993 | 19,09 | 5 069 | 14,94 | ||||
| 2026-02-13 | 13F | Jacobs Levy Equity Management, Inc | 108 259 | 107,00 | 1 256 | 99,84 | ||||
| 2026-02-17 | 13F | Integrated Advisors Network LLC | 816 040 | −2,97 | 9 466 | −6,36 | ||||
| 2026-02-17 | 13F | Aster Capital Management (DIFC) Ltd | 0 | −100,00 | 0 | |||||
| 2026-02-10 | 13F | Lido Advisors, LLC | 272 167 | 0,00 | 3 271 | 0,00 | ||||
| 2026-02-17 | 13F | Millennium Management Llc | 75 580 | −26,89 | 877 | −29,47 | ||||
| 2026-02-17 | 13F | Northern Trust Corp | 367 436 | −7,66 | 4 262 | −10,89 | ||||
| 2026-02-13 | 13F | SRS Capital Advisors, Inc. | 10 | −98,83 | 0 | −100,00 | ||||
| 2026-02-17 | 13F | Creative Planning | 25 714 | 72,28 | 298 | 66,48 | ||||
| 2026-01-26 | 13F | Whittier Trust Co Of Nevada Inc | 1 000 | 0,00 | 12 | −8,33 | ||||
| 2026-02-11 | 13F | Simplex Trading, Llc | 766 | −64,64 | 9 | |||||
| 2026-02-03 | 13F | Costello Asset Management, INC | 708 | 0,00 | 8 | 0,00 | ||||
| 2026-02-17 | 13F | Tower Research Capital LLC (TRC) | 3 061 | −19,40 | 36 | −22,22 | ||||
| 2026-02-13 | 13F | Manufacturers Life Insurance Company, The | 0 | −100,00 | 0 | |||||
| 2026-02-12 | 13F | Advisors Asset Management, Inc. | 63 087 | 3,76 | 732 | 0,14 | ||||
| 2026-02-17 | 13F | Citadel Advisors Llc | Put | 0 | −100,00 | 0 | ||||
| 2026-01-23 | 13F | Assetmark, Inc | 149 | 0,00 | 2 | 0,00 | ||||
| 2026-02-05 | 13F | Allworth Financial LP | 360 | 9,76 | 4 | 33,33 |
Other Listings
| US:AVO | 13,76 US$ |