Grundläggande statistik
| Institutionella ägare | 177 total, 162 long only, 2 short only, 13 long/short - change of −23,04% MRQ |
| Aktiepris | 7,30 |
| Genomsnittlig portföljallokering | 0.2382 % - change of −62,10% MRQ |
| Institutionella aktier (lång) | 134 241 982 (ex 13D/G) - change of −0,04MM shares −0,03% MRQ |
| Institutionellt värde (lång) | $ 1 144 885 USD ($1000) |
Institutionellt ägande och aktieägare
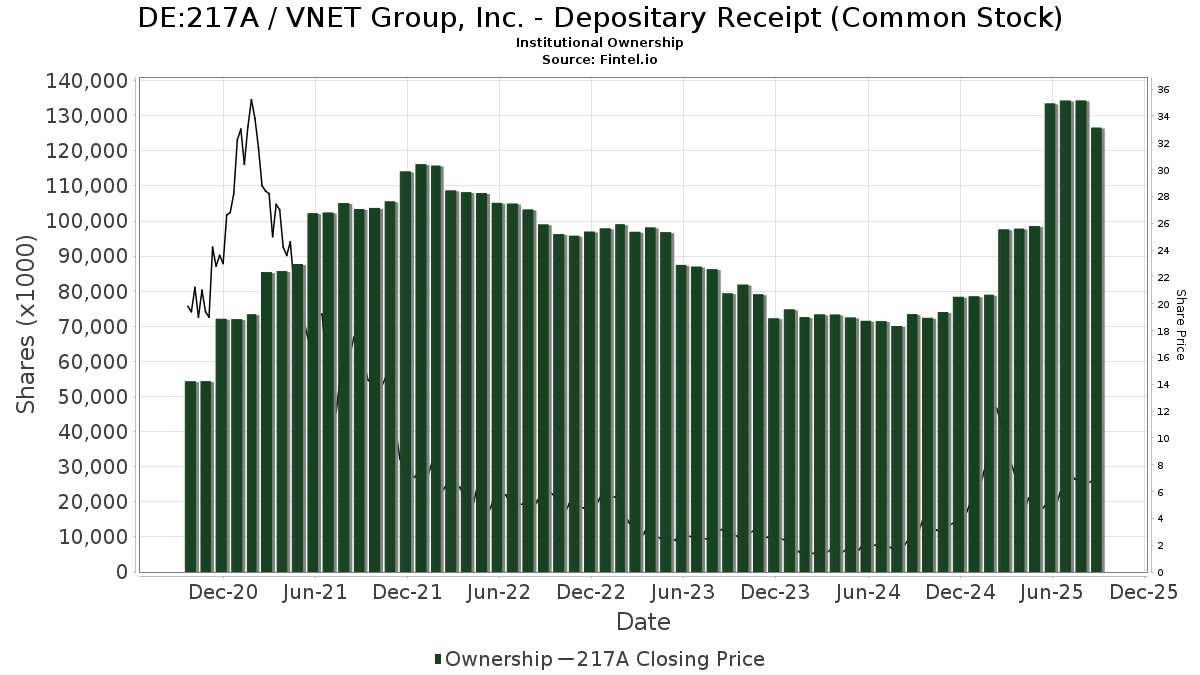
VNET Group, Inc. - Depositary Receipt (Common Stock) (DE:217A) har 177 Institutionella ägare och aktieägare som har lämnat in 13D/G- eller 13F-formulär till Securities Exchange Commission (SEC). Dessa institut innehar totalt 134,241,982 aktier. Största aktieägare inkluderar Triata Capital Ltd, Point72 Asset Management, L.P., Blackstone Group Inc, Morgan Stanley, Norges Bank, Discovery Capital Management, Llc / Ct, Farallon Capital Management Llc, Point72 Hong Kong Ltd, Balyasny Asset Management Llc, and MIRAE ASSET GLOBAL ETFS HOLDINGS Ltd. .
VNET Group, Inc. - Depositary Receipt (Common Stock) (DB:217A) Institutionell ägarstruktur visar institutioners och fonders nuvarande positioner i företaget, samt de senaste förändringarna i positionernas storlek. Större aktieägare kan vara enskilda investerare, fonder, hedgefonder eller institutioner. Bilaga 13D visar att investeraren äger (eller ägde) mer än 5% av företaget och avser (eller avsåg) att aktivt eftersträva en förändring av affärsstrategin. Schedule 13G indikerar en passiv investering på över 5%.
The share price as of March 27, 2026 is 7,30 / share. Previously, on March 31, 2025, the share price was 7,50 / share. This represents a decline of 2,67% over that period.
Fondsentimentets poäng
Fondsentimentet poängen(fka Ägarackumulation-poäng) visar vilka aktier som är mest köpta av fonder. Det är resultatet av en sofistikerad kvantitativ flerfaktormodell som identifierar företag med de högsta nivåerna av institutionell ackumulering. Poängsättningsmodellen använder en kombination av den totala ökningen av redovisade ägare, förändringarna i portföljallokeringarna för dessa ägare och andra mått. Siffran sträcker sig från 0 till 100, där högre siffror indikerar en högre nivå av ackumulering i förhållande till sina konkurrenter, och 50 är genomsnittet.
Uppdateringsfrekvens: Dagligen
Se Ownership Explorer, som innehåller en lista över de högst rankade företagen.
AI+ Ask Fintel’s AI assistant about VNET Group, Inc. - Depositary Receipt (Common Stock).
Select a question to share a public post with an AI-crafted answer.
Thinking of good questions…
13F- och NPORT-arkiveringar
Detaljer om 13F-arkiveringar är gratis. Detaljer om NP-arkiveringar kräver ett premiummedlemskap. Gröna rader indikerar nya positioner. Röda rader indikerar stängda positioner. Klicka på länk symbolen för att se hela transaktionshistoriken.
Uppgradera
för att låsa upp premiumdata och exportera till Excel ![]() .
.
| Fil Datum | Källa | Investerare | Typ | Genomsnittligt pris (beräknat) |
Aktier | Δ Aktier (%) |
Rapporterat värde (1000 USD) |
Δ Värde (%) |
Portföljallokering (%) |
|
|---|---|---|---|---|---|---|---|---|---|---|
| 2026-02-17 | 13F | Amundi | 191 186 | −15,55 | 1 617 | −32,65 | ||||
| 2026-02-17 | 13F | FIL Ltd | 1 143 996 | −5,58 | 9 678 | −22,67 | ||||
| 2026-02-17 | 13F | D. E. Shaw & Co., Inc. | Put | 125 000 | 1 058 | |||||
| 2026-02-17 | 13F | Royal Bank Of Canada | 405 | −96,73 | 3 | −97,66 | ||||
| 2026-02-17 | 13F | Farallon Capital Management Llc | 6 285 386 | 14,51 | 53 174 | −6,22 | ||||
| 2026-02-17 | 13F | D. E. Shaw & Co., Inc. | Call | 145 300 | 1 229 | |||||
| 2025-11-14 | 13F | Boothbay Fund Management, Llc | 0 | −100,00 | 0 | |||||
| 2026-02-13 | 13F | Rhumbline Advisers | 982 | 53,20 | 8 | 33,33 | ||||
| 2026-02-17 | 13F | D. E. Shaw & Co., Inc. | 27 972 | 237 | ||||||
| 2026-02-13 | 13F | Hel Ved Capital Management Ltd | 444 000 | −0,20 | 3 756 | −18,26 | ||||
| 2026-02-13 | 13F | Ubs Oconnor Llc | 0 | −100,00 | 0 | |||||
| 2026-02-06 | 13F | IFP Advisors, Inc | 6 000 | −42,86 | 51 | −53,70 | ||||
| 2026-02-17 | 13F | Trexquant Investment LP | 232 155 | 1 964 | ||||||
| 2026-01-23 | 13F | Wallace Advisory Group, LLC | 0 | −100,00 | 0 | |||||
| 2025-09-29 | NP | MMCFX - AMG Managers Emerging Opportunities Fund Class N | 32 027 | 0,00 | 266 | 32,34 | ||||
| 2026-02-17 | 13F | Bank Of America Corp /de/ | 556 832 | 243,54 | 4 711 | 181,36 | ||||
| 2026-02-17 | 13F | Schonfeld Strategic Advisors LLC | 0 | −100,00 | 0 | |||||
| 2026-02-12 | 13F | Senvest Management, LLC | 891 754 | 7 544 | ||||||
| 2026-02-17 | 13F | Aperture Investors, LLC | 0 | −100,00 | 0 | |||||
| 2026-01-08 | 13F | Wealth Enhancement Advisory Services, Llc | 10 181 | 95 | ||||||
| 2026-02-13 | 13F | Peak6 Llc | Call | 499 100 | −58,58 | 4 222 | −66,08 | |||
| 2026-02-13 | 13F | Peak6 Llc | 15 473 | 131 | ||||||
| 2025-11-14 | 13F | Point72 Asia (Singapore) Pte. Ltd. | 83 793 | 419,94 | 866 | 679,28 | ||||
| 2026-02-17 | 13F | Dark Forest Capital Management Lp | 0 | −100,00 | 0 | |||||
| 2026-02-02 | 13F | Triasima Portfolio Management inc. | 77 265 | 95,48 | 654 | 60,05 | ||||
| 2026-02-17 | 13F | Susquehanna International Group, Llp | Put | 451 400 | −52,00 | 3 819 | −60,70 | |||
| 2026-02-17 | 13F | Susquehanna International Group, Llp | Call | 607 400 | −52,31 | 5 139 | −60,95 | |||
| 2026-02-13 | 13F | Oasis Management Co Ltd. | 3 449 188 | 0,00 | 29 180 | −18,10 | ||||
| 2026-02-12 | 13F | Renaissance Technologies Llc | 0 | −100,00 | 0 | |||||
| 2026-01-16 | 13F | FNY Investment Advisers, LLC | 0 | −100,00 | 0 | |||||
| 2026-01-16 | 13F | FNY Investment Advisers, LLC | Call | 0 | −100,00 | 0 | ||||
| 2026-02-17 | 13F | Cetera Investment Advisers | 57 703 | −2,86 | 488 | −20,39 | ||||
| 2026-02-10 | 13F | NS Partners Ltd | 937 500 | 36,52 | 7 931 | 11,81 | ||||
| 2026-02-24 | 13F/A | Pacer Advisors, Inc. | 178 308 | −71,51 | 1 508 | −76,67 | ||||
| 2025-11-14 | 13F | Man Group plc | 0 | −100,00 | 0 | |||||
| 2026-02-10 | 13F | Goldman Sachs Group Inc | 341 742 | −43,25 | 2 891 | −53,52 | ||||
| 2026-01-21 | 13F | Stone House Investment Management, LLC | 31 | −43,64 | 0 | |||||
| 2026-02-13 | 13F | Oxbow Capital Management (HK) Ltd | 503 010 | −91,25 | 4 255 | −92,84 | ||||
| 2026-02-03 | 13F | Navellier & Associates Inc | 95 543 | 3,15 | 808 | −15,48 | ||||
| 2026-02-12 | 13F | Nuveen, LLC | 120 100 | −79,37 | 1 016 | −83,10 | ||||
| 2026-01-23 | 13F | Farther Finance Advisors, LLC | 13 689 | 13,34 | 116 | −7,26 | ||||
| 2026-02-13 | 13F | Sompo Japan Nipponkoa Asset Management Co.,ltd. | 68 350 | −0,29 | 578 | −18,36 | ||||
| 2026-02-12 | 13F | Wedbush Securities Inc | 0 | −100,00 | 0 | |||||
| 2026-02-14 | 13F | Rockefeller Capital Management L.P. | 2 153 | −92,82 | 18 | −94,17 | ||||
| 2026-01-29 | 13F | WT Asset Management Ltd | 0 | −100,00 | 0 | |||||
| 2026-02-17 | 13F | Two Sigma Advisers, Lp | 1 288 000 | −50,83 | 10 896 | −59,73 | ||||
| 2026-02-17 | 13F | Caption Management, LLC | 0 | −100,00 | 0 | |||||
| 2026-01-22 | 13F | Personal Cfo Solutions, Llc | 35 562 | 7,03 | 301 | −12,54 | ||||
| 2026-02-11 | 13F | Simplex Trading, Llc | Put | 68 500 | 3,16 | 580 | ||||
| 2026-02-17 | 13F | Two Sigma Securities, Llc | 11 309 | −51,07 | 96 | −60,08 | ||||
| 2026-02-11 | 13F | Simplex Trading, Llc | 26 767 | 226 | ||||||
| 2025-11-14 | 13F | Centiva Capital, LP | 0 | −100,00 | 0 | |||||
| 2026-02-17 | 13F | Millennium Management Llc | Call | 250 000 | −67,74 | 2 115 | −73,58 | |||
| 2026-02-17 | 13F | Alden Global Capital LLC | 1 075 500 | 9,42 | 9 099 | −10,39 | ||||
| 2026-02-13 | 13F | Citigroup Inc | Call | 850 000 | 7 191 | |||||
| 2026-02-13 | 13F | Marshall Wace, Llp | 28 491 | 241 | ||||||
| 2026-02-13 | 13F | Citigroup Inc | Put | 850 000 | 7 191 | |||||
| 2026-02-11 | 13F | Simplex Trading, Llc | Call | 134 000 | −79,24 | 1 134 | 18 783,33 | |||
| 2025-11-14 | 13F | Point72 (DIFC) Ltd | 2 498 | −53,74 | 26 | −32,43 | ||||
| 2026-02-13 | 13F | Citigroup Inc | 52 751 | −16,55 | 446 | −31,60 | ||||
| 2025-11-14 | 13F | Point72 Europe (London) LLP | 781 058 | 7,82 | 8 068 | 61,42 | ||||
| 2026-02-05 | 13F | Atria Investments Llc | 56 142 | 0,26 | 475 | −17,99 | ||||
| 2026-02-17 | 13F | DZ BANK AG Deutsche Zentral Genossenschafts Bank, Frankfurt am Main | 0 | −100,00 | 0 | |||||
| 2026-02-17 | 13F | Sig Brokerage, Lp | Call | 0 | −100,00 | 0 | −100,00 | |||
| 2026-02-11 | 13F | Fox Run Management, L.l.c. | 0 | −100,00 | 0 | |||||
| 2026-02-17 | 13F | Caption Management, LLC | Call | 0 | −100,00 | 0 | ||||
| 2026-02-17 | 13F | Persistent Asset Partners Ltd | 0 | −100,00 | 0 | |||||
| 2025-11-14 | 13F | Cubist Systematic Strategies, LLC | Put | 33 100 | −63,55 | 342 | −45,53 | |||
| 2026-02-17 | 13F | Hood River Capital Management LLC | 0 | −100,00 | 0 | |||||
| 2025-11-07 | 13F | Gf Fund Management Co. Ltd. | 0 | −100,00 | 0 | |||||
| 2025-11-14 | 13F | Cubist Systematic Strategies, LLC | Call | 16 200 | −81,27 | 167 | −71,98 | |||
| 2026-02-17 | 13F | Millennium Management Llc | 3 478 739 | 73,59 | 29 430 | 42,17 | ||||
| 2026-02-17 | 13F | Hillhouse Capital Advisors, Ltd. | 53 100 | 449 | ||||||
| 2026-02-12 | 13F | Jane Street Group, Llc | Call | 252 300 | 43,76 | 2 134 | 17,77 | |||
| 2026-02-12 | 13F | Jane Street Group, Llc | Put | 129 400 | −55,09 | 1 095 | −63,24 | |||
| 2026-02-06 | 13F | EverSource Wealth Advisors, LLC | 2 056 | −50,54 | 17 | −59,52 | ||||
| 2026-01-22 | 13F | BOCHK Asset Management Ltd | 0 | −100,00 | 0 | |||||
| 2026-02-13 | 13F | Barclays Plc | 445 474 | 20 581,24 | 3 769 | 47 000,00 | ||||
| 2026-02-11 | 13F | Jpmorgan Chase & Co | 2 502 622 | 1 750,89 | 21 172 | 1 416,62 | ||||
| 2026-02-13 | 13F | SRS Capital Advisors, Inc. | 168 | 133,33 | 1 | |||||
| 2026-02-13 | 13F | American Century Companies Inc | 1 413 654 | −17,43 | 11 960 | −32,37 | ||||
| 2026-02-13 | 13F | Headlands Technologies LLC | 77 880 | −47,16 | 659 | −56,77 | ||||
| 2026-01-27 | 13F | TD Waterhouse Canada Inc. | 43 352 | −6,45 | 366 | −26,51 | ||||
| 2026-02-10 | 13F | Norges Bank | 7 760 035 | 65 650 | ||||||
| 2026-01-16 | 13F | Ronald Blue Trust, Inc. | 12 859 | 3 310,88 | 109 | 3 500,00 | ||||
| 2026-02-17 | 13F | BTG Pactual Asset Management US LLC | 30 000 | 254 | ||||||
| 2026-02-12 | 13F | AI-Squared Management Ltd | 441 571 | 17,04 | 3 736 | −4,16 | ||||
| 2026-02-13 | 13F | Brookfield Asset Management Inc. | 0 | −100,00 | 0 | |||||
| 2026-01-15 | 13F | Burns Matteson Capital Management, LLC | 37 729 | 11,14 | 319 | −8,86 | ||||
| 2026-02-18 | 13F | Vermillion & White Wealth Management Group, LLC | 804 | 7 | ||||||
| 2026-02-09 | 13F | Legal & General Group Plc | 27 051 | 86,67 | 229 | 53,02 | ||||
| 2026-02-17 | 13F | Tower Research Capital LLC (TRC) | 0 | −100,00 | 0 | |||||
| 2026-02-17 | 13F | MIRAE ASSET GLOBAL ETFS HOLDINGS Ltd. | 3 827 495 | 35,08 | 32 381 | 10,63 | ||||
| 2026-01-29 | 13F | IMC-Chicago, LLC | 73 311 | 2,64 | 620 | −15,88 | ||||
| 2026-01-29 | 13F | IMC-Chicago, LLC | Put | 85 700 | −28,88 | 725 | −41,72 | |||
| 2026-02-13 | 13F | Polymer Capital Management (HK) LTD | 0 | −100,00 | 0 | |||||
| 2026-01-29 | 13F | IMC-Chicago, LLC | Call | 114 600 | −43,13 | 970 | −53,44 | |||
| 2026-02-13 | 13F | Smartleaf Asset Management LLC | 2 581 | 22 | ||||||
| 2026-02-13 | 13F | Y-Intercept (Hong Kong) Ltd | 0 | −100,00 | 0 | |||||
| 2026-02-17 | 13F | Jones Financial Companies Lllp | 58 | 0 | ||||||
| 2026-02-17 | 13F | Point72 Asset Management, L.P. | Call | 51 200 | 433 | |||||
| 2026-02-10 | 13F | Eurizon Capital SGR S.p.A. | 40 | 0 | ||||||
| 2026-02-17 | 13F | Point72 Asset Management, L.P. | 11 682 841 | 221,60 | 98 837 | 163,38 | ||||
| 2026-02-02 | 13F | Truist Financial Corp | 20 401 | −8,06 | 182 | −20,52 | ||||
| 2026-02-17 | 13F | Point72 Asset Management, L.P. | Put | 14 600 | 124 | |||||
| 2026-02-09 | 13F | Jefferies Financial Group Inc. | Put | 0 | −100,00 | 0 | −100,00 | |||
| 2026-02-12 | 13F | Skopos Labs, Inc. | 23 471 | 97,00 | 203 | 64,23 | ||||
| 2026-02-12 | 13F | California Public Employees Retirement System | 76 202 | −8,96 | 645 | −25,46 | ||||
| 2026-02-17 | 13F | Raymond James Financial Inc | 11 904 | 4,00 | 101 | −15,25 | ||||
| 2025-11-10 | 13F | Wrapmanager Inc | 0 | −100,00 | 0 | −100,00 | ||||
| 2026-02-17 | 13F | Sender Co & Partners, Inc. | Call | 0 | −100,00 | 0 | ||||
| 2026-02-17 | 13F | Sender Co & Partners, Inc. | 0 | −100,00 | 0 | |||||
| 2026-02-09 | 13F | Geode Capital Management, Llc | 272 885 | 3,12 | 2 309 | −15,55 | ||||
| 2026-01-08 | 13F | Sanders Morris Harris Llc | 95 000 | −28,03 | 826 | −39,47 | ||||
| 2026-02-17 | 13F | Northern Trust Corp | 255 777 | 3,90 | 2 164 | −14,91 | ||||
| 2026-02-17 | 13F | GeoWealth Management, LLC | 4 348 | 9,55 | 37 | −10,00 | ||||
| 2026-02-12 | 13F | Dimensional Fund Advisors Lp | 1 260 960 | 48,30 | 10 667 | 21,44 | ||||
| 2026-02-17 | 13F | Citadel Advisors Llc | 598 830 | 59,71 | 5 066 | 30,80 | ||||
| 2026-02-17 | 13F | Citadel Advisors Llc | Put | 269 500 | −9,41 | 2 280 | −25,84 | |||
| 2026-02-17 | 13F | Citadel Advisors Llc | Call | 151 200 | −59,37 | 1 279 | −66,72 | |||
| 2026-03-06 | 13F | Hsbc Holdings Plc | 1 293 571 | 45,99 | 10 944 | 19,60 | ||||
| 2026-02-13 | 13F | Squarepoint Ops LLC | 0 | −100,00 | 0 | |||||
| 2026-01-09 | 13F | SG Americas Securities, LLC | 41 038 | −67,14 | 0 | −100,00 | ||||
| 2026-02-18 | 13F | Mackenzie Financial Corp | 346 322 | 0,00 | 2 931 | −18,06 | ||||
| 2025-11-14 | 13F | Walleye Trading LLC | 0 | −100,00 | 0 | −100,00 | ||||
| 2026-02-17 | 13F | Jump Financial, LLC | 252 513 | −56,18 | 2 136 | −64,12 | ||||
| 2026-02-05 | 13F | Central Asset Investments & Management Holdings (HK) Ltd | 0 | −100,00 | 0 | |||||
| 2026-02-13 | 13F | Quarry LP | 1 570 | 13 | ||||||
| 2026-02-17 | 13F | Portolan Capital Management, LLC | 806 800 | 42,18 | 6 826 | 16,45 | ||||
| 2026-02-17 | 13F | Brevan Howard Capital Management LP | 512 066 | −4,13 | 4 294 | −22,19 | ||||
| 2026-02-13 | 13F | Manufacturers Life Insurance Company, The | 0 | −100,00 | 0 | |||||
| 2025-11-19 | 13F | Caitong International Asset Management Co., Ltd | 0 | −100,00 | 0 | |||||
| 2026-02-13 | 13F | Caxton Associates Llp | 216 000 | 1 827 | ||||||
| 2026-02-17 | 13F | Crawford Fund Management, LLC | Put | 355 000 | 61,36 | 3 003 | 32,17 | |||
| 2026-02-10 | 13F | Savant Capital, LLC | 13 726 | 1,94 | 116 | −16,55 | ||||
| 2026-02-10 | 13F | Main Management ETF Advisors, LLC | 183 222 | 1,03 | 2 | 0,00 | ||||
| 2026-02-04 | 13F | Beverly Hills Private Wealth, LLC | 22 926 | 0,00 | 237 | 0,00 | ||||
| 2025-11-14 | 13F | PineBridge Investments, L.P. | 583 578 | 0,00 | 6 028 | 49,73 | ||||
| 2026-02-13 | 13F | Morgan Stanley | 10 332 297 | −10,03 | 87 411 | −26,31 | ||||
| 2026-02-17 | 13F | Balyasny Asset Management Llc | 4 051 490 | −11,66 | 34 276 | −27,66 | ||||
| 2026-02-17 | 13F | Fmr Llc | 0 | −100,00 | 0 | |||||
| 2025-10-28 | 13F | Qrg Capital Management, Inc. | 0 | −100,00 | 0 | −100,00 | ||||
| 2025-11-14 | 13F | KADENSA CAPITAL Ltd | 0 | −100,00 | 0 | |||||
| 2026-01-26 | 13F | JGP Global Gestao de Recursos Ltda. | Call | 648 | −67,60 | 185 | −60,64 | |||
| 2026-02-09 | 13F | William Blair Investment Management, Llc | 880 195 | −43,00 | 7 446 | −53,32 | ||||
| 2026-02-17 | 13F | Wiley Bros.-aintree Capital, Llc | 19 075 | −0,94 | 161 | −18,69 | ||||
| 2025-11-14 | 13F | Sig Brokerage, Lp | 0 | −100,00 | 0 | −100,00 | ||||
| 2026-02-10 | 13F | Envestnet Asset Management Inc | 238 224 | −7,42 | 2 015 | −24,19 | ||||
| 2026-02-17 | 13F | LMR Partners LLP | 0 | −100,00 | 0 | |||||
| 2026-02-17 | 13F | Liontrust Investment Partners LLP | 40 643 | 0,00 | 344 | −18,14 | ||||
| 2026-01-23 | 13F | Diversify Advisory Services, LLC | 65 158 | 10,69 | 688 | 15,27 | ||||
| 2026-02-13 | 13F | Police & Firemen's Retirement System of New Jersey | 20 744 | −61,77 | 175 | −68,75 | ||||
| 2026-02-13 | 13F | Candriam Luxembourg S.C.A. | 178 000 | −90,74 | 1 506 | −92,42 | ||||
| 2026-01-29 | 13F | UBS Group AG | 3 328 995 | −22,29 | 28 163 | −36,35 | ||||
| 2026-02-17 | 13F | Hidden Lake Asset Management LP | 549 205 | −7,67 | 4 646 | −24,38 | ||||
| 2026-02-10 | 13F | Quantbot Technologies LP | 49 209 | 228,81 | 416 | 170,13 | ||||
| 2026-02-13 | 13F | Infini Capital Management Ltd | 1 428 944 | −83,39 | 12 089 | −86,40 | ||||
| 2026-02-17 | 13F | Alliancebernstein L.p. | 25 665 | 0,00 | 217 | −18,11 | ||||
| 2025-10-20 | 13F | Shilanski & Associates, Inc. | 33 198 | −0,17 | 343 | 49,34 | ||||
| 2025-11-14 | 13F | Jain Global LLC | 0 | −100,00 | 0 | −100,00 | ||||
| 2025-11-03 | 13F | Townsquare Capital Llc | 0 | −100,00 | 0 | |||||
| 2026-02-13 | 13F | Wells Fargo & Company/mn | 5 527 | 7,40 | 47 | −13,21 | ||||
| 2026-01-23 | 13F | Bingham Private Wealth, Llc | 13 519 | 3,59 | 114 | 26,67 | ||||
| 2026-02-09 | 13F | Jefferies Financial Group Inc. | 1 979 000 | 16 742 | ||||||
| 2025-11-14 | 13F | Point72 Hong Kong Ltd | 5 037 631 | 172,17 | 52 039 | 307,47 | ||||
| 2026-02-12 | 13F | Jane Street Group, Llc | 0 | −100,00 | 0 | −100,00 | ||||
| 2026-02-12 | 13F | Brinker Capital Investments, LLC | 64 510 | 200,17 | 546 | 145,50 | ||||
| 2026-02-06 | 13F | Global Retirement Partners, LLC | 3 175 | 27 | ||||||
| 2026-02-13 | 13F | Eschler Asset Management LLP | 0 | −100,00 | 0 | |||||
| 2026-02-13 | 13F | Pinpoint Asset Management (Singapore) Pte. Ltd. | 764 056 | 1 849,57 | 6 464 | −57,54 | ||||
| 2026-02-17 | 13F | Temasek Holdings (Private) Ltd | 3 253 150 | 988,74 | 27 522 | 791,80 | ||||
| 2026-01-26 | 13F | Cwm, Llc | 35 957 | 0 | ||||||
| 2026-02-12 | 13F | Rossby Financial, LCC | 18 | 0,00 | 0 | |||||
| 2026-01-09 | 13F | Diversified Trust Co | 56 200 | 19,32 | 475 | −2,26 | ||||
| 2025-11-14 | 13F | Qube Research & Technologies Ltd | 0 | −100,00 | 0 | |||||
| 2025-11-13 | 13F | Sequoia China Equity Partners (Hong Kong) Ltd | 0 | −100,00 | 0 | −100,00 | ||||
| 2026-02-13 | 13F | Integrated Wealth Concepts LLC | 0 | −100,00 | 0 | |||||
| 2026-02-10 | 13F | Bank of New York Mellon Corp | 114 135 | 966 | ||||||
| 2026-02-11 | 13F | Deutsche Bank Ag\ | 458 775 | 354,57 | 3 881 | 272,46 | ||||
| 2026-02-13 | 13F | National Bank Of Canada /fi/ | 0 | −100,00 | 0 | |||||
| 2026-02-10 | 13F | Baker Avenue Asset Management, LP | 224 383 | 19,97 | 1 898 | −1,76 | ||||
| 2025-11-14 | 13F | Maso Capital Partners Ltd | 75 000 | 775 | ||||||
| 2026-02-19 | 13F | Invesco Ltd. | 107 255 | −4,75 | 907 | −22,01 | ||||
| 2026-02-23 | 13F | Virtu Financial LLC | 18 563 | 0 | ||||||
| 2026-02-11 | 13F | Parallel Advisors, LLC | 4 335 | 0,00 | 37 | −18,18 | ||||
| 2026-01-26 | 13F | Mirae Asset Global Investments Co., Ltd. | 35 450 | −81,59 | 300 | −84,96 | ||||
| 2026-01-20 | 13F | Ascent Group, LLC | 11 005 | −20,67 | 93 | −34,97 | ||||
| 2026-02-11 | 13F | Allianz Asset Management GmbH | 1 455 862 | 85,55 | 12 317 | 51,96 | ||||
| 2026-01-09 | 13F | SG Americas Securities, LLC | Put | 0 | −100,00 | 0 | ||||
| 2026-02-12 | 13F | Barings Llc | 0 | −100,00 | 0 | |||||
| 2025-11-14 | 13F | Arrowpoint Investment Partners (Singapore) Pte. Ltd. | 0 | −100,00 | 0 | −100,00 | ||||
| 2026-02-17 | 13F | Balyasny Asset Management Llc | Call | 0 | −100,00 | 0 | ||||
| 2026-02-12 | 13F | Pinebridge Investments Asia Ltd | 521 861 | 4 415 | ||||||
| 2026-02-06 | 13F | Handelsbanken Fonder AB | 26 900 | 0 | ||||||
| 2025-09-29 | NP | TMAT - Main Thematic Innovation ETF | 174 096 | 4,71 | 1 447 | 38,37 | ||||
| 2026-02-10 | 13F | Bnp Paribas Arbitrage, Sa | 19 415 | −97,28 | 164 | −97,78 | ||||
| 2026-02-12 | 13F | BlackRock, Inc. | 3 400 541 | −3,31 | 28 769 | −20,81 | ||||
| 2026-02-20 | 13F | Dorsey Wright & Associates | 222 482 | 5,87 | 1 882 | −13,31 | ||||
| 2026-02-13 | 13F | Neuberger Berman Group LLC | 75 308 | 638 | ||||||
| 2026-01-26 | 13F | JGP Global Gestao de Recursos Ltda. | 50 082 | 424 | ||||||
| 2026-02-17 | 13F | CastleKnight Management LP | 543 300 | 0,00 | 4 596 | −18,10 | ||||
| 2026-02-17 | 13F | Advisor Group Holdings, Inc. | 2 871 | 16,09 | 24 | −4,00 | ||||
| 2026-01-27 | 13F | Asset Management One Co., Ltd. | 30 089 | −1,15 | 260 | −17,52 | ||||
| 2026-02-03 | 13F | Diversify Wealth Management, Llc | 194 899 | 6,22 | 2 167 | 16,51 | ||||
| 2026-01-23 | 13F | Assetmark, Inc | 36 | 0 | ||||||
| 2026-02-13 | 13F | Carmignac Gestion | 394 616 | −0,21 | 3 338 | −18,27 | ||||
| 2026-02-17 | 13F | Discovery Capital Management, Llc / Ct | 6 319 100 | 291,40 | 53 460 | 220,56 | ||||
| 2026-02-17 | 13F | Public Employees Retirement System Of Ohio | 30 800 | 14,50 | 261 | −6,14 | ||||
| 2026-01-29 | 13F | China Universal Asset Management Co., Ltd. | 30 000 | 0,00 | 254 | −18,12 | ||||
| 2026-02-18 | 13F | Vident Advisory, LLC | 96 070 | −9,30 | 813 | −25,78 | ||||
| 2025-10-22 | 13F | Valliance Asset Management Ltd | 0 | −100,00 | 0 | −100,00 | ||||
| 2026-02-13 | 13F | Stifel Financial Corp | 85 102 | 5,50 | 720 | −13,69 | ||||
| 2026-02-13 | 13F | MAI Capital Management | 183 | 20,39 | 2 | 0,00 | ||||
| 2026-01-09 | 13F | SG Americas Securities, LLC | Call | 111 300 | 0,00 | 0 | ||||
| 2026-02-04 | 13F | Independent Advisor Alliance | 290 908 | −15,91 | 2 461 | −31,12 | ||||
| 2026-02-13 | 13F | State Street Corp | 927 639 | 6,68 | 7 850 | −12,61 | ||||
| 2026-02-17 | 13F | Tudor Investment Corp Et Al | Put | 13 700 | −90,58 | 116 | −92,35 | |||
| 2026-02-17 | 13F | BlueCrest Capital Management Ltd | 121 670 | 279,99 | 1 029 | 211,82 | ||||
| 2026-02-17 | 13F | Nomura Holdings Inc | 23 855 | 0,00 | 202 | −18,29 | ||||
| 2026-02-13 | 13F | Vontobel Holding Ltd. | 99 875 | 845 | ||||||
| 2025-11-13 | 13F/A | Peak6 Llc | Put | 0 | −100,00 | 0 | −100,00 | |||
| 2026-02-02 | 13F | Alliance Wealth Advisors, LLC /UT | 13 437 | −13,65 | 114 | −29,37 | ||||
| 2026-02-13 | 13F | Sei Investments Co | 36 504 | 309 | ||||||
| 2026-02-13 | 13F | Verition Fund Management LLC | 223 465 | −44,81 | 1 891 | −54,81 | ||||
| 2026-02-11 | 13F | LPL Financial LLC | 161 802 | 12,70 | 1 369 | −7,75 | ||||
| 2026-02-03 | 13F | SBI Securities Co., Ltd. | 600 | −37,24 | 5 | −44,44 | ||||
| 2026-01-20 | 13F | Signaturefd, Llc | 3 266 | 0,00 | 28 | −18,18 | ||||
| 2026-02-17 | 13F | Prelude Capital Management, Llc | 42 500 | −24,24 | 360 | −38,00 | ||||
| 2026-02-13 | 13F | Walleye Trading LLC | Put | 305 800 | 2 008,97 | 2 587 | 1 636,24 | |||
| 2026-02-13 | 13F | Walleye Trading LLC | Call | 165 500 | 25,57 | 1 400 | 2,87 | |||
| 2026-02-17 | 13F | Creative Planning | 11 531 | −11,60 | 98 | −27,61 | ||||
| 2025-11-13 | 13F | Monolith Management Ltd | 0 | −100,00 | 0 | |||||
| 2026-02-13 | 13F | Allianz Se | 5 900 | 50 | ||||||
| 2026-02-17 | 13F | PharVision Advisers, LLC | 23 257 | 197 | ||||||
| 2025-11-04 | 13F | Veritas Asset Management LLP | 0 | −100,00 | 0 | −100,00 | ||||
| 2026-02-11 | 13F | Group One Trading, L.p. | Put | 372 000 | −43,34 | 3 147 | −53,59 | |||
| 2026-02-11 | 13F | Group One Trading, L.p. | Call | 597 500 | −54,69 | 5 055 | −62,90 | |||
| 2026-02-11 | 13F | Harvest Fund Management Co., Ltd | 39 043 | 0,00 | 0 | |||||
| 2026-02-06 | 13F | Gsa Capital Partners Llp | 81 566 | −65,47 | 1 | −100,00 | ||||
| 2026-02-17 | 13F | Blackstone Group Inc | 10 402 130 | 0,00 | 88 002 | −18,10 | ||||
| 2026-02-03 | 13F | Sumitomo Mitsui DS Asset Management Company, Ltd | 16 080 | 34,82 | 136 | 10,57 | ||||
| 2026-02-13 | 13F | Walleye Capital LLC | Put | 19 700 | 167 | |||||
| 2026-02-13 | 13F | Walleye Capital LLC | 10 | 0 | ||||||
| 2025-11-14 | 13F | Two Sigma Investments, Lp | 0 | −100,00 | 0 | −100,00 | ||||
| 2026-02-13 | 13F | Walleye Capital LLC | Call | 42 600 | 360 | |||||
| 2026-02-14 | 13F | Triata Capital Ltd | 12 498 810 | 4,61 | 105 740 | −14,33 | ||||
| 2026-01-29 | 13F | Vanguard Group Inc | 2 517 966 | 0,00 | 21 302 | −18,10 | ||||
| 2025-11-14 | 13F | Wolverine Trading, Llc | Call | 141 300 | 380,61 | 1 471 | 617,07 | |||
| 2025-11-14 | 13F | Wolverine Trading, Llc | Put | 35 500 | 0,28 | 370 | 49,39 | |||
| 2026-02-11 | 13F | IMA Wealth, Inc. | 17 | 0 | ||||||
| 2025-09-29 | NP | SRVR - Pacer Benchmark Data & Infrastructure Real Estate SCTR ETF | 1 193 774 | 28,24 | 9 920 | 69,43 | ||||
| 2026-02-06 | 13F | Larson Financial Group LLC | 117 | 0,00 | 1 | −100,00 | ||||
| 2026-02-13 | 13F | Wells Fargo & Company/mn | Call | 0 | −100,00 | 0 | −100,00 | |||
| 2026-01-14 | 13F | ORG Wealth Partners, LLC | 701 | 8,68 | 6 | −16,67 | ||||
| 2026-02-17 | 13F | Susquehanna International Group, Llp | 0 | −100,00 | 0 | |||||
| 2026-02-12 | 13F | Banco BTG Pactual S.A. | 0 | −100,00 | 0 | |||||
| 2025-11-14 | 13F | Wolverine Trading, Llc | 26 356 | −35,69 | 274 | −4,20 | ||||
| 2026-02-06 | 13F | Pnc Financial Services Group, Inc. | 100 | 0,00 | 1 | −100,00 | ||||
| 2026-02-06 | 13F | Profund Advisors Llc | 0 | −100,00 | 0 | |||||
| 2026-02-17 | 13F | Tudor Investment Corp Et Al | 0 | −100,00 | 0 | −100,00 | ||||
| 2026-02-17 | 13F | Tudor Investment Corp Et Al | Call | 0 | −100,00 | 0 | −100,00 | |||
| 2026-02-10 | 13F | AdvisorShares Investments LLC | 149 961 | 6,74 | 1 269 | −12,61 | ||||
| 2025-11-14 | 13F | Lazard Asset Management Llc | 0 | −100,00 | 0 | |||||
| 2025-11-13 | 13F | Canada Pension Plan Investment Board | 0 | −100,00 | 0 | −100,00 | ||||
| 2026-02-11 | 13F | Havemeyer Place LP | 42 195 | 357 | ||||||
| 2025-11-14 | 13F | Cubist Systematic Strategies, LLC | 0 | −100,00 | 0 | −100,00 | ||||
| 2026-02-05 | 13F | DnB Asset Management AS | 164 700 | −2,43 | 1 393 | −20,08 | ||||
| 2026-02-12 | 13F | Quadrant Capital Group Llc | 14 616 | −9,57 | 124 | −25,90 |
Other Listings
| US:VNET | 8,45 US$ |