Grundläggande statistik
| Institutionella ägare | 108 total, 105 long only, 1 short only, 2 long/short - change of −3,54% MRQ |
| Genomsnittlig portföljallokering | 0.0780 % - change of −13,11% MRQ |
| Institutionella aktier (lång) | 2 909 368 (ex 13D/G) - change of −0,40MM shares −12,00% MRQ |
| Institutionellt värde (lång) | $ 252 448 USD ($1000) |
Institutionellt ägande och aktieägare
Invesco Exchange-Traded Fund Trust II - Invesco S&P 500 High Beta ETF (US:SPHB) har 108 Institutionella ägare och aktieägare som har lämnat in 13D/G- eller 13F-formulär till Securities Exchange Commission (SEC). Dessa institut innehar totalt 2,909,368 aktier. Största aktieägare inkluderar Bank Of America Corp /de/, Cambridge Investment Research Advisors, Inc., Allianz Se, Morgan Stanley, LPL Financial LLC, Goldman Sachs Group Inc, Raymond James Financial Inc, Bnp Paribas Arbitrage, Sa, Wells Fargo & Company/mn, and Royal Bank Of Canada .
Invesco Exchange-Traded Fund Trust II - Invesco S&P 500 High Beta ETF (ARCA:SPHB) Institutionell ägarstruktur visar institutioners och fonders nuvarande positioner i företaget, samt de senaste förändringarna i positionernas storlek. Större aktieägare kan vara enskilda investerare, fonder, hedgefonder eller institutioner. Bilaga 13D visar att investeraren äger (eller ägde) mer än 5% av företaget och avser (eller avsåg) att aktivt eftersträva en förändring av affärsstrategin. Schedule 13G indikerar en passiv investering på över 5%.
The share price as of September 5, 2025 is 105,26 / share. Previously, on September 9, 2024, the share price was 81,00 / share. This represents an increase of 29,95% over that period.

Fondsentimentets poäng
Fondsentimentet poängen(fka Ägarackumulation-poäng) visar vilka aktier som är mest köpta av fonder. Det är resultatet av en sofistikerad kvantitativ flerfaktormodell som identifierar företag med de högsta nivåerna av institutionell ackumulering. Poängsättningsmodellen använder en kombination av den totala ökningen av redovisade ägare, förändringarna i portföljallokeringarna för dessa ägare och andra mått. Siffran sträcker sig från 0 till 100, där högre siffror indikerar en högre nivå av ackumulering i förhållande till sina konkurrenter, och 50 är genomsnittet.
Uppdateringsfrekvens: Dagligen
Se Ownership Explorer, som innehåller en lista över de högst rankade företagen.
Institutionell sälj/köp-kvot
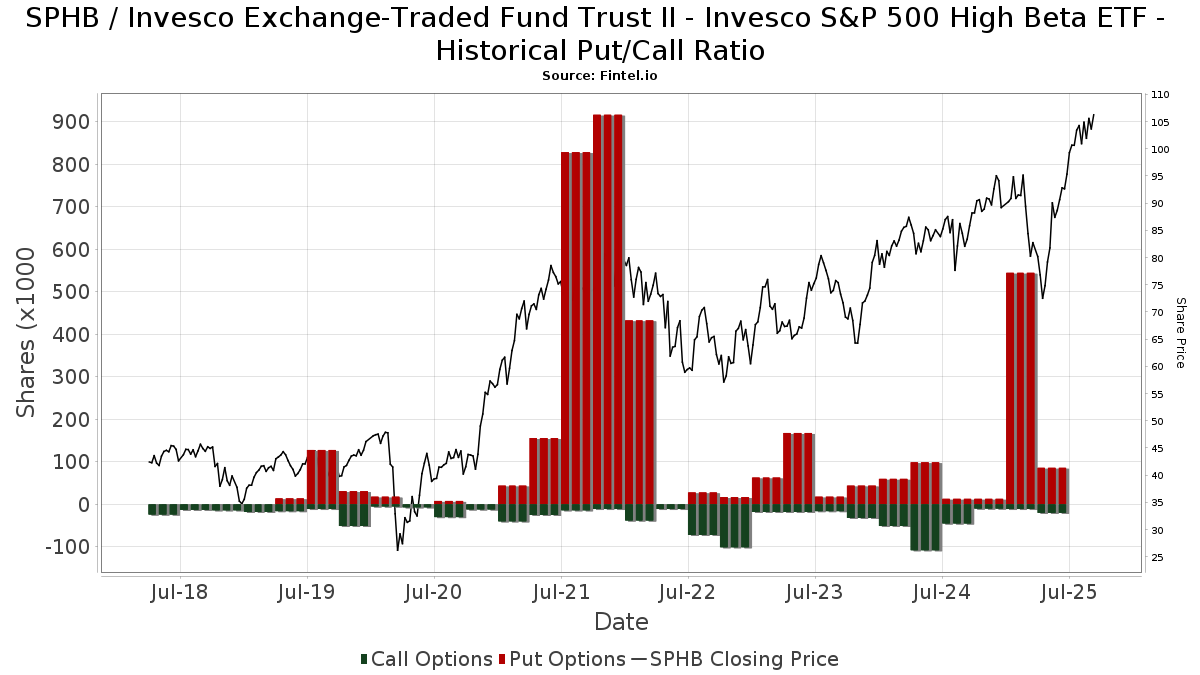
Förutom att rapportera vanliga eget kapital- och skuldemissioner måste institutioner med mer än 100MM tillgångar under förvaltning också avslöja sina innehav av sälj- och köpoptioner. Eftersom säljoptioner i allmänhet indikerar ett negativt sentiment och köpoptioner indikerar ett positivt sentiment, kan vi få en uppfattning om det övergripande institutionella sentimentet genom att plotta förhållandet mellan säljoptioner och köpoptioner. Diagrammet till höger visar det historiska förhållandet mellan sälj- och köpoptioner för detta instrument.
Genom att använda sälj/köp-kvoten som en indikator på aktieägarnas sentiment undviker man en av de största bristerna med att använda det totala institutionella ägandet, nämligen att en betydande del av de förvaltade tillgångarna investeras passivt för att följa index. Passivt förvaltade fonder köper vanligtvis inte optioner, så indikatorn för sälj/köp-kvoten ger en bättre bild av stämningen i aktivt förvaltade fonder.
13F- och NPORT-arkiveringar
Detaljer om 13F-arkiveringar är gratis. Detaljer om NP-arkiveringar kräver ett premiummedlemskap. Gröna rader indikerar nya positioner. Röda rader indikerar stängda positioner. Klicka på länk symbolen för att se hela transaktionshistoriken.
Uppgradera
för att låsa upp premiumdata och exportera till Excel ![]() .
.
| Fil Datum | Källa | Investerare | Typ | Genomsnittligt pris (beräknat) |
Aktier | Δ Aktier (%) |
Rapporterat värde (1000 USD) |
Δ Värde (%) |
Portföljallokering (%) |
|
|---|---|---|---|---|---|---|---|---|---|---|
| 2025-08-14 | 13F | Jane Street Group, Llc | 0 | −100,00 | 0 | |||||
| 2025-05-14 | 13F | BOK Financial Private Wealth, Inc. | 0 | −100,00 | 0 | −100,00 | ||||
| 2025-08-12 | 13F | Steward Partners Investment Advisory, Llc | 104 | 0,00 | 10 | 25,00 | ||||
| 2025-07-08 | 13F | Gradient Investments LLC | 3 172 | −19,23 | 309 | 0,65 | ||||
| 2025-08-14 | 13F | Goldman Sachs Group Inc | 190 334 | 120,07 | 18 563 | 174,28 | ||||
| 2025-08-14 | 13F | Mpwm Advisory Solutions, Llc | 888 | −36,02 | 87 | −20,37 | ||||
| 2025-05-01 | 13F | Q3 Asset Management | 0 | −100,00 | 0 | |||||
| 2025-07-16 | 13F | Ayalon Holdings Ltd. | 26 021 | 0,00 | 3 | 0,00 | ||||
| 2025-08-14 | 13F | Bnp Paribas Arbitrage, Sa | 142 593 | 13,81 | 13 907 | 41,84 | ||||
| 2025-08-14 | 13F | Raymond James Financial Inc | 159 696 | −0,28 | 15 575 | 24,28 | ||||
| 2025-08-14 | 13F | Wiley Bros.-aintree Capital, Llc | 2 077 | 203 | ||||||
| 2025-04-09 | 13F | HBW Advisory Services LLC | 0 | −100,00 | 0 | −100,00 | ||||
| 2025-08-14 | 13F | Summit Partners Public Asset Management, Llc | Put | 80 000 | −73,33 | 7 802 | −66,77 | |||
| 2025-07-21 | 13F | Seros Financial, LLC | 9 220 | 0,00 | 899 | 24,69 | ||||
| 2025-08-04 | 13F | Assetmark, Inc | 36 | −62,89 | 4 | −57,14 | ||||
| 2025-08-14 | 13F | Headlands Technologies LLC | 1 063 | 104 | ||||||
| 2025-07-31 | 13F | Oppenheimer Asset Management Inc. | 3 770 | −18,04 | 368 | 2,23 | ||||
| 2025-08-14 | 13F | GWM Advisors LLC | 115 | 0,00 | 11 | 22,22 | ||||
| 2025-08-14 | 13F | Mml Investors Services, Llc | 30 874 | −5,89 | 3 | 50,00 | ||||
| 2025-07-25 | 13F | 1858 Wealth Management, Llc | 2 180 | 213 | ||||||
| 2025-07-17 | 13F | XML Financial, LLC | 2 490 | 243 | ||||||
| 2025-07-25 | 13F | Cwm, Llc | 263 | 0,00 | 0 | |||||
| 2025-08-06 | 13F | Commonwealth Equity Services, Llc | 13 411 | −12,61 | 1 | 0,00 | ||||
| 2025-08-12 | 13F | Quadcap Wealth Management, LLC | 5 606 | 0,00 | 547 | 24,66 | ||||
| 2025-07-14 | 13F | Sowell Financial Services LLC | 13 100 | 1 278 | ||||||
| 2025-08-12 | 13F | Archer Investment Corp | 364 | 0,00 | 36 | 25,00 | ||||
| 2025-08-15 | 13F | Morgan Stanley | 209 463 | 23,91 | 20 429 | 54,43 | ||||
| 2025-07-16 | 13F | ORG Partners LLC | 0 | 0 | ||||||
| 2025-08-14 | 13F | Abound Financial, Llc | 19 853 | 0,01 | 1 936 | 24,66 | ||||
| 2025-08-14 | 13F | Fmr Llc | 1 284 | −32,77 | 125 | −16,11 | ||||
| 2025-07-22 | 13F | One Wealth Management Investment & Advisory Services, LLC | 4 178 | −0,74 | 407 | 23,71 | ||||
| 2025-08-08 | 13F | Capital Investment Advisory Services, LLC | 22 | −99,93 | 2 | −99,92 | ||||
| 2025-08-06 | 13F | Vestmark Advisory Solutions, Inc. | 0 | −100,00 | 0 | |||||
| 2025-08-12 | 13F | Weaver Consulting Group | 6 149 | −0,65 | 600 | 23,76 | ||||
| 2025-08-13 | 13F | Walleye Trading LLC | 4 601 | 449 | ||||||
| 2025-07-23 | 13F | New England Professional Planning Group Inc. | 3 591 | −38,55 | 350 | −23,41 | ||||
| 2025-07-10 | 13F | Wealth Enhancement Advisory Services, Llc | 2 126 | 213 | ||||||
| 2025-08-13 | 13F | Renaissance Technologies Llc | 8 600 | −77,43 | 839 | −71,89 | ||||
| 2025-04-30 | 13F | BCJ Capital Management, LLC | 0 | −100,00 | 0 | |||||
| 2025-08-12 | 13F | SRS Capital Advisors, Inc. | 150 | 0,00 | 15 | 27,27 | ||||
| 2025-08-14 | 13F | CoreCap Advisors, LLC | 0 | −100,00 | 0 | |||||
| 2025-08-14 | 13F | Citadel Advisors Llc | 103 569 | 301,76 | 10 101 | 400,79 | ||||
| 2025-04-23 | 13F | Oppenheimer & Co Inc | 0 | −100,00 | 0 | −100,00 | ||||
| 2025-08-13 | 13F | Gateway Wealth Partners, LLC | 2 202 | −86,19 | 215 | −82,85 | ||||
| 2025-08-14 | 13F | Comerica Bank | 4 848 | −12,81 | 473 | 8,51 | ||||
| 2025-03-21 | 13F | Prostatis Group LLC | 0 | −100,00 | 0 | −100,00 | ||||
| 2025-08-07 | 13F | Allworth Financial LP | 1 133 | 0,00 | 111 | 25,00 | ||||
| 2025-08-15 | 13F | Captrust Financial Advisors | 3 104 | 0,00 | 303 | 24,79 | ||||
| 2025-08-07 | 13F | Runnymede Capital Advisors, Inc. | 0 | −100,00 | 0 | |||||
| 2025-09-04 | 13F/A | Advisor Group Holdings, Inc. | 24 612 | 86,44 | 2 373 | 129,62 | ||||
| 2025-08-19 | 13F | Delos Wealth Advisors, LLC | 388 | 38 | ||||||
| 2025-07-21 | 13F | Ntv Asset Management Llc | 31 869 | −9,90 | 3 108 | 12,32 | ||||
| 2025-07-31 | 13F | Burke & Herbert Bank & Trust Co | 10 740 | −2,72 | 1 047 | 21,32 | ||||
| 2025-08-13 | 13F | Quadrature Capital Ltd | 0 | −100,00 | 0 | |||||
| 2025-08-14 | 13F | Citadel Advisors Llc | Put | 2 400 | −76,24 | 234 | −70,38 | |||
| 2025-07-29 | 13F | Private Trust Co Na | 0 | −100,00 | 0 | |||||
| 2025-07-25 | 13F | Atria Wealth Solutions, Inc. | 10 289 | 1 003 | ||||||
| 2025-08-14 | 13F/A | Barclays Plc | 1 300 | 0,00 | 0 | |||||
| 2025-08-06 | 13F | Legacy Investment Solutions, LLC | 97 | 0,00 | 9 | 12,50 | ||||
| 2025-08-14 | 13F | Qube Research & Technologies Ltd | 0 | −100,00 | 0 | |||||
| 2025-08-13 | 13F | Townsquare Capital Llc | 0 | −100,00 | 0 | |||||
| 2025-08-14 | 13F | Hrt Financial Lp | 0 | −100,00 | 0 | |||||
| 2025-05-06 | 13F | Proficio Capital Partners LLC | 0 | −100,00 | 0 | −100,00 | ||||
| 2025-07-31 | 13F | Sequent Asset Management, LLC | 3 810 | 0,00 | 372 | 24,50 | ||||
| 2025-07-31 | 13F | Brinker Capital Investments, LLC | 0 | −100,00 | 0 | −100,00 | ||||
| 2025-08-11 | 13F | Plotkin Financial Advisors, LLC | 4 650 | −3,49 | 454 | 20,16 | ||||
| 2025-07-24 | 13F | IFP Advisors, Inc | 985 | 0,00 | 96 | 24,68 | ||||
| 2025-08-19 | 13F | Cape Investment Advisory, Inc. | 311 | 0,00 | 30 | 25,00 | ||||
| 2025-05-14 | 13F | Chicago Wealth Management, Inc. | 0 | −100,00 | 0 | |||||
| 2025-07-25 | 13F | Commonwealth Financial Services, LLC | 45 863 | 4 473 | ||||||
| 2025-08-08 | 13F | Allianz Se | 223 509 | 21 799 | ||||||
| 2025-08-14 | 13F | Sunbelt Securities, Inc. | 0 | −100,00 | 0 | |||||
| 2025-08-14 | 13F | Guardian Wealth Management, Inc. | 0 | −100,00 | 0 | |||||
| 2025-08-12 | 13F | Jpmorgan Chase & Co | 49 995 | −6,49 | 4 876 | 16,54 | ||||
| 2025-08-14 | 13F | Avant Capital LLC | 3 088 | −0,71 | 301 | 23,87 | ||||
| 2025-08-06 | 13F | Legacy Wealth Managment, LLC/ID | 97 | 0,00 | 9 | 28,57 | ||||
| 2025-08-14 | 13F | MGB Wealth Management, LLC | 2 899 | −0,03 | 283 | 24,78 | ||||
| 2025-07-30 | 13F | D.a. Davidson & Co. | 10 448 | −22,92 | 1 019 | −3,96 | ||||
| 2025-08-14 | 13F | Betterment LLC | 2 460 | −14,52 | 0 | |||||
| 2025-05-08 | 13F | IFG Advisory, LLC | 0 | −100,00 | 0 | |||||
| 2025-08-13 | 13F | Jones Financial Companies Lllp | 11 263 | 28,47 | 1 094 | 58,87 | ||||
| 2025-08-08 | 13F | Avantax Advisory Services, Inc. | 14 981 | −59,21 | 1 461 | −49,16 | ||||
| 2025-08-14 | 13F | Colony Group, LLC | 2 705 | 4,24 | 264 | 29,56 | ||||
| 2025-07-10 | 13F | Legacy Financial Strategies, LLC | 5 500 | 0,00 | 536 | 24,65 | ||||
| 2025-07-29 | 13F | Stratos Wealth Partners, LTD. | 3 318 | −7,78 | 324 | 14,95 | ||||
| 2025-08-13 | 13F | Northwestern Mutual Wealth Management Co | 6 878 | −13,24 | 671 | 8,06 | ||||
| 2025-08-14 | 13F | Sig Brokerage, Lp | 20 000 | 1 951 | ||||||
| 2025-08-05 | 13F | Tsfg, Llc | 60 | 0,00 | 0 | |||||
| 2025-08-14 | 13F | Ameriprise Financial Inc | 9 634 | −2,30 | 940 | 21,79 | ||||
| 2025-08-14 | 13F | Wells Fargo & Company/mn | 128 590 | 16,44 | 12 541 | 45,12 | ||||
| 2025-08-13 | 13F | Flow Traders U.s. Llc | 0 | −100,00 | 0 | |||||
| 2025-08-12 | 13F | LPL Financial LLC | 197 363 | −48,79 | 19 249 | −36,18 | ||||
| 2025-08-14 | 13F | Stifel Financial Corp | 13 168 | −30,80 | 1 284 | −13,77 | ||||
| 2025-08-15 | 13F | Tower Research Capital LLC (TRC) | 0 | −100,00 | 0 | |||||
| 2025-07-08 | 13F | Parallel Advisors, LLC | 840 | 0,00 | 82 | 24,62 | ||||
| 2025-08-14 | 13F | EHP Funds Inc. | 21 300 | −38,79 | 2 077 | −23,72 | ||||
| 2025-05-08 | 13F | Harbour Investments, Inc. | 0 | −100,00 | 0 | |||||
| 2025-07-18 | 13F | Centricity Wealth Management, LLC | 0 | −100,00 | 0 | |||||
| 2025-04-30 | 13F | Axxcess Wealth Management, Llc | 0 | −100,00 | 0 | |||||
| 2025-07-31 | 13F | Cambridge Investment Research Advisors, Inc. | 246 024 | 2 921,29 | 24 | |||||
| 2025-08-14 | 13F | Hilltop Holdings Inc. | 26 312 | −56,16 | 2 566 | −45,36 | ||||
| 2025-08-14 | 13F | Susquehanna International Group, Llp | Put | 4 500 | −98,09 | 439 | −97,62 | |||
| 2025-08-08 | 13F | Pnc Financial Services Group, Inc. | 839 | 0,00 | 82 | 24,62 | ||||
| 2025-08-11 | 13F | Citigroup Inc | 220 | 54,93 | 21 | 90,91 | ||||
| 2025-08-14 | 13F | Susquehanna International Group, Llp | Call | 20 300 | 82,88 | 1 980 | 128,00 | |||
| 2025-08-19 | 13F | Advisory Services Network, LLC | 2 414 | 248 | ||||||
| 2025-04-22 | 13F | Synergy Financial Management, LLC | 0 | −100,00 | 0 | |||||
| 2025-08-15 | 13F | Kestra Advisory Services, LLC | 12 049 | 35,49 | 1 175 | 69,06 | ||||
| 2025-08-05 | 13F | Bank Of Montreal /can/ | 25 406 | −25,34 | 2 478 | −6,98 | ||||
| 2025-08-07 | 13F | PFG Advisors | 9 953 | −8,00 | 971 | 14,66 | ||||
| 2025-08-11 | 13F | TD Waterhouse Canada Inc. | 796 | −52,13 | 78 | −40,77 | ||||
| 2025-07-17 | 13F | City Holding Co | 0 | −100,00 | 0 | |||||
| 2025-08-14 | 13F | D. E. Shaw & Co., Inc. | 14 988 | −3,85 | 1 462 | 19,85 | ||||
| 2025-07-29 | 13F | Stratos Wealth Advisors, LLC | 5 829 | 3,77 | 569 | 29,38 | ||||
| 2025-08-11 | 13F | Aptus Capital Advisors, LLC | 182 | 0,00 | 18 | 21,43 | ||||
| 2025-08-12 | 13F | Cynosure Management, Llc | 0 | −100,00 | 0 | |||||
| 2025-07-31 | 13F | Buckingham Strategic Partners | 3 193 | 311 | ||||||
| 2025-08-06 | 13F | AE Wealth Management LLC | 7 863 | 4 342,37 | 767 | 5 792,31 | ||||
| 2025-07-31 | 13F | Optimum Investment Advisors | 53 | 0,00 | 5 | 25,00 | ||||
| 2025-05-12 | 13F | Founders Financial Securities Llc | 0 | −100,00 | 0 | |||||
| 2025-08-14 | 13F | Susquehanna International Group, Llp | 0 | −100,00 | 0 | |||||
| 2025-08-12 | 13F | O'shaughnessy Asset Management, Llc | 50 | −40,48 | 5 | −33,33 | ||||
| 2025-08-01 | 13F | Envestnet Asset Management Inc | 9 574 | −57,70 | 934 | −47,32 | ||||
| 2025-07-30 | 13F | Fingerlakes Wealth Management, Inc. | 3 562 | 2,21 | 347 | 27,57 | ||||
| 2025-08-11 | 13F | HighTower Advisors, LLC | 2 468 | −5,51 | 241 | 17,65 | ||||
| 2025-08-14 | 13F | UBS Group AG | 30 419 | −26,28 | 2 967 | −8,14 | ||||
| 2025-08-08 | 13F | Cetera Investment Advisers | 5 618 | 0,57 | 548 | 25,17 | ||||
| 2025-08-18 | 13F | Hollencrest Capital Management | 921 | 90 | ||||||
| 2025-07-16 | 13F | Legend Financial Advisors, Inc. | 204 | 20 | ||||||
| 2025-05-14 | 13F | CIBC Private Wealth Group, LLC | 0 | −100,00 | 0 | −100,00 | ||||
| 2025-08-11 | 13F | TRUE Private Wealth Advisors | 8 280 | 808 | ||||||
| 2025-08-14 | 13F | Royal Bank Of Canada | 104 470 | −23,77 | 10 189 | −5,01 | ||||
| 2025-08-08 | 13F | Gts Securities Llc | 0 | −100,00 | 0 | |||||
| 2025-08-14 | 13F | Bank Of America Corp /de/ | 485 901 | −46,53 | 47 390 | −33,36 | ||||
| 2025-08-18 | 13F/A | National Bank Of Canada /fi/ | 2 351 | 53,76 | 229 | 92,44 | ||||
| 2025-08-11 | 13F | Private Advisor Group, LLC | 4 709 | −1,38 | 459 | 23,06 | ||||
| 2025-08-14 | 13F | Citadel Advisors Llc | Call | 0 | −100,00 | 0 | ||||
| 2025-08-14 | 13F | IHT Wealth Management, LLC | 3 379 | −7,07 | 330 | 15,85 | ||||
| 2025-08-05 | 13F | Bank of New York Mellon Corp | 0 | −100,00 | 0 | |||||
| 2025-07-16 | 13F | Townsend Asset Management Corp /nc/ /adv | 4 032 | 0,00 | 393 | 24,76 | ||||
| 2025-07-14 | 13F | E&G Advisors, LP | 14 815 | −38,26 | 1 445 | −23,07 | ||||
| 2025-08-14 | 13F | Coppell Advisory Solutions LLC | 0 | −100,00 | 0 | |||||
| 2025-08-12 | 13F | Global Retirement Partners, LLC | 522 | 0,38 | 51 | 8,70 | ||||
| 2025-08-12 | 13F | Proequities, Inc. | 0 | 0 | ||||||
| 2025-07-10 | 13F | Secure Asset Management, LLC | 2 844 | 0,00 | 277 | 24,77 | ||||
| 2025-07-24 | 13F | Capital Advisors, Ltd. LLC | 187 | 0,00 | 0 | |||||
| 2025-05-15 | 13F | Integrated Wealth Concepts LLC | 0 | −100,00 | 0 | |||||
| 2025-07-29 | 13F | Koshinski Asset Management, Inc. | 5 172 | 0,00 | 504 | 24,75 | ||||
| 2025-08-08 | 13F | Creative Planning | 18 509 | −8,41 | 1 805 | 14,17 |
Other Listings
| PE:SPHB |