Grundläggande statistik
| Institutionella ägare | 107 total, 105 long only, 1 short only, 1 long/short - change of 21,59% MRQ |
| Genomsnittlig portföljallokering | 0.0302 % - change of −0,88% MRQ |
| Institutionella aktier (lång) | 6 387 203 (ex 13D/G) - change of 1,81MM shares 39,68% MRQ |
| Institutionellt värde (lång) | $ 138 898 USD ($1000) |
Institutionellt ägande och aktieägare
Global X Funds - Global X SuperDividend ETF (US:SDIV) har 107 Institutionella ägare och aktieägare som har lämnat in 13D/G- eller 13F-formulär till Securities Exchange Commission (SEC). Dessa institut innehar totalt 6,819,612 aktier. Största aktieägare inkluderar LPL Financial LLC, Howard Capital Management Inc., Morgan Stanley, Foguth Wealth Management, LLC., Signal Advisors Wealth, LLC, Bank Of America Corp /de/, Advisor Group Holdings, Inc., Wells Fargo & Company/mn, Susquehanna International Group, Llp, and Newbridge Financial Services Group, Inc. .
Global X Funds - Global X SuperDividend ETF (ARCA:SDIV) Institutionell ägarstruktur visar institutioners och fonders nuvarande positioner i företaget, samt de senaste förändringarna i positionernas storlek. Större aktieägare kan vara enskilda investerare, fonder, hedgefonder eller institutioner. Bilaga 13D visar att investeraren äger (eller ägde) mer än 5% av företaget och avser (eller avsåg) att aktivt eftersträva en förändring av affärsstrategin. Schedule 13G indikerar en passiv investering på över 5%.
The share price as of September 10, 2025 is 23,77 / share. Previously, on September 11, 2024, the share price was 21,94 / share. This represents an increase of 8,34% over that period.

Fondsentimentets poäng
Fondsentimentet poängen(fka Ägarackumulation-poäng) visar vilka aktier som är mest köpta av fonder. Det är resultatet av en sofistikerad kvantitativ flerfaktormodell som identifierar företag med de högsta nivåerna av institutionell ackumulering. Poängsättningsmodellen använder en kombination av den totala ökningen av redovisade ägare, förändringarna i portföljallokeringarna för dessa ägare och andra mått. Siffran sträcker sig från 0 till 100, där högre siffror indikerar en högre nivå av ackumulering i förhållande till sina konkurrenter, och 50 är genomsnittet.
Uppdateringsfrekvens: Dagligen
Se Ownership Explorer, som innehåller en lista över de högst rankade företagen.
Institutionell sälj/köp-kvot
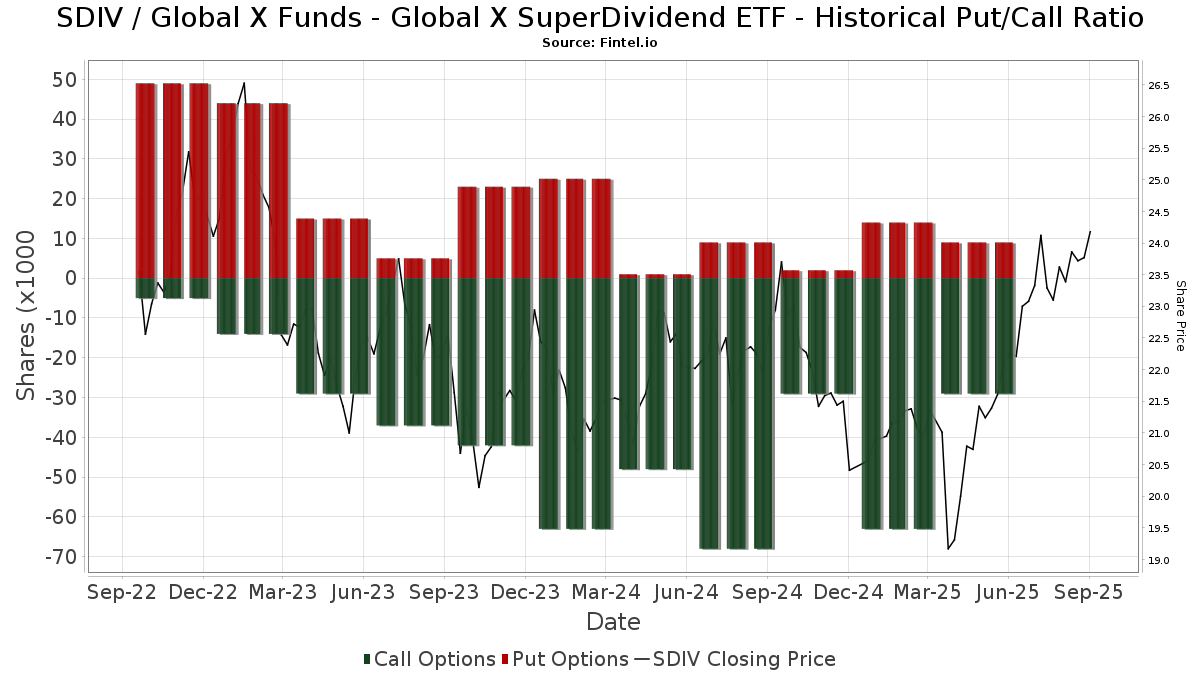
Förutom att rapportera vanliga eget kapital- och skuldemissioner måste institutioner med mer än 100MM tillgångar under förvaltning också avslöja sina innehav av sälj- och köpoptioner. Eftersom säljoptioner i allmänhet indikerar ett negativt sentiment och köpoptioner indikerar ett positivt sentiment, kan vi få en uppfattning om det övergripande institutionella sentimentet genom att plotta förhållandet mellan säljoptioner och köpoptioner. Diagrammet till höger visar det historiska förhållandet mellan sälj- och köpoptioner för detta instrument.
Genom att använda sälj/köp-kvoten som en indikator på aktieägarnas sentiment undviker man en av de största bristerna med att använda det totala institutionella ägandet, nämligen att en betydande del av de förvaltade tillgångarna investeras passivt för att följa index. Passivt förvaltade fonder köper vanligtvis inte optioner, så indikatorn för sälj/köp-kvoten ger en bättre bild av stämningen i aktivt förvaltade fonder.
13F- och NPORT-arkiveringar
Detaljer om 13F-arkiveringar är gratis. Detaljer om NP-arkiveringar kräver ett premiummedlemskap. Gröna rader indikerar nya positioner. Röda rader indikerar stängda positioner. Klicka på länk symbolen för att se hela transaktionshistoriken.
Uppgradera
för att låsa upp premiumdata och exportera till Excel ![]() .
.
| Fil Datum | Källa | Investerare | Typ | Genomsnittligt pris (beräknat) |
Aktier | Δ Aktier (%) |
Rapporterat värde (1000 USD) |
Δ Värde (%) |
Portföljallokering (%) |
|
|---|---|---|---|---|---|---|---|---|---|---|
| 2025-08-13 | 13F | Renaissance Technologies Llc | 28 045 | 632 | ||||||
| 2025-08-07 | 13F | Kestra Private Wealth Services, Llc | 46 775 | 67,90 | 1 055 | 80,48 | ||||
| 2025-08-14 | 13F | Bank Of America Corp /de/ | 410 676 | −8,65 | 9 261 | −1,77 | ||||
| 2025-07-31 | 13F | Cambridge Investment Research Advisors, Inc. | 120 288 | 3,35 | 3 | 0,00 | ||||
| 2025-08-06 | 13F | Atlantic Union Bankshares Corp | 230 | 5 | ||||||
| 2025-08-04 | 13F | Integrity Alliance, Llc. | 18 674 | −0,19 | 421 | 7,40 | ||||
| 2025-08-11 | 13F | Private Advisor Group, LLC | 14 377 | 324 | ||||||
| 2025-08-14 | 13F | Jane Street Group, Llc | 17 057 | 385 | ||||||
| 2025-07-09 | 13F | Lifestyle Asset Management, Inc. | 14 372 | 324 | ||||||
| 2025-05-15 | 13F | Talon Private Wealth, LLC | 0 | −100,00 | 0 | −100,00 | ||||
| 2025-08-05 | 13F | Simplex Trading, Llc | 3 350 | 0 | ||||||
| 2025-05-09 | 13F | CoreCap Advisors, LLC | 0 | −100,00 | 0 | |||||
| 2025-07-17 | 13F | Janney Montgomery Scott LLC | 18 376 | −3,91 | 0 | |||||
| 2025-08-06 | 13F | AE Wealth Management LLC | 14 518 | 23,08 | 327 | 32,39 | ||||
| 2025-07-29 | 13F | International Assets Investment Management, Llc | 19 263 | −10,25 | 434 | −3,56 | ||||
| 2025-08-12 | 13F | Waterloo Capital, L.P. | 10 251 | 0,00 | 231 | 7,94 | ||||
| 2025-08-11 | 13F | Wealthspire Advisors, LLC | 23 804 | 1,04 | 537 | 8,50 | ||||
| 2025-05-16 | 13F/A | Kestra Investment Management, LLC | 0 | −100,00 | 0 | |||||
| 2025-05-15 | 13F | Gts Securities Llc | 0 | −100,00 | 0 | |||||
| 2025-08-11 | 13F | Principal Securities, Inc. | 87 453 | 2 387,99 | 1 972 | 2 638,89 | ||||
| 2025-08-14 | 13F | Qube Research & Technologies Ltd | 26 056 | −25,56 | 588 | −19,92 | ||||
| 2025-08-05 | 13F | GPS Wealth Strategies Group, LLC | 9 | 0,00 | 0 | |||||
| 2025-08-12 | 13F | Global Retirement Partners, LLC | 11 865 | 34,57 | 268 | 47,51 | ||||
| 2025-07-22 | 13F/A | Kingstone Capital Partners Texas, LLC | 10 899 | 2,01 | 246 | 9,82 | ||||
| 2025-08-14 | 13F | UBS Group AG | 54 948 | −86,16 | 1 239 | −85,11 | ||||
| 2025-08-28 | NP | BTSAX - BTS Managed Income Fund Class A Shares | 25 303 | 571 | ||||||
| 2025-07-18 | 13F | Truist Financial Corp | 0 | −100,00 | 0 | |||||
| 2025-04-29 | 13F | Wood Tarver Financial Group, LLC | 0 | −100,00 | 0 | |||||
| 2025-07-31 | 13F | Wealthfront Advisers Llc | 54 733 | 10,18 | 1 234 | 18,54 | ||||
| 2025-08-12 | 13F | Founders Financial Alliance, LLC | 19 717 | 3,93 | 445 | 11,84 | ||||
| 2025-07-25 | 13F | Cwm, Llc | 2 174 | 794,65 | 0 | |||||
| 2025-07-18 | 13F | PFG Investments, LLC | 24 146 | −0,15 | 544 | 7,30 | ||||
| 2025-07-21 | 13F | Crews Bank & Trust | 6 115 | 69,16 | 138 | 82,67 | ||||
| 2025-07-09 | 13F | Sterling Manor Financial, LLC | 14 333 | 323 | ||||||
| 2025-08-14 | 13F | Citadel Advisors Llc | Call | 0 | −100,00 | 0 | ||||
| 2025-08-14 | 13F | Citadel Advisors Llc | Put | 0 | −100,00 | 0 | ||||
| 2025-07-21 | 13F | Ameritas Advisory Services, LLC | 38 532 | 9,30 | 869 | 17,62 | ||||
| 2025-07-28 | 13F | Ckw Financial Group | 1 000 | 0,00 | 0 | |||||
| 2025-07-23 | 13F | Kingswood Wealth Advisors, Llc | 44 576 | 41,08 | 1 005 | 51,81 | ||||
| 2025-08-08 | 13F | SBI Securities Co., Ltd. | 44 841 | −0,29 | 1 011 | 7,21 | ||||
| 2025-08-14 | 13F | Raymond James Financial Inc | 81 692 | 2,99 | 1 842 | 10,76 | ||||
| 2025-08-08 | 13F | Financial Gravity Companies, Inc. | 666 | 0,00 | 15 | 15,38 | ||||
| 2025-08-08 | 13F | Cetera Investment Advisers | 103 842 | 18,89 | 2 342 | 27,85 | ||||
| 2025-08-04 | 13F | Kovack Advisors, Inc. | 15 562 | 20,77 | 351 | 29,63 | ||||
| 2025-08-08 | 13F | Fortis Group Advisors, LLC | 14 741 | 340 | ||||||
| 2025-08-08 | 13F | Advyzon Investment Management, LLC | 15 939 | −0,28 | 359 | 7,16 | ||||
| 2025-05-15 | 13F | Tower Research Capital LLC (TRC) | 0 | −100,00 | 0 | |||||
| 2025-08-14 | 13F/A | Rockefeller Capital Management L.P. | 23 428 | 3,12 | 528 | 10,92 | ||||
| 2025-07-10 | 13F | Signal Advisors Wealth, LLC | 528 346 | 723,03 | 11 914 | 785,14 | ||||
| 2025-07-09 | 13F | Triumph Capital Management | 41 074 | 1,22 | 926 | 8,94 | ||||
| 2025-08-13 | 13F | VestGen Advisors, LLC | 12 336 | 278 | ||||||
| 2025-07-08 | 13F | Parallel Advisors, LLC | 230 | 0,00 | 5 | 25,00 | ||||
| 2025-08-29 | 13F | Total Investment Management Inc | 1 506 | 34 | ||||||
| 2025-08-14 | 13F | Royal Bank Of Canada | 9 330 | 19,65 | 211 | 28,66 | ||||
| 2025-08-14 | 13F | Stifel Financial Corp | 14 316 | −2,77 | 323 | 4,55 | ||||
| 2025-08-19 | 13F | Newbridge Financial Services Group, Inc. | 129 172 | 4,19 | 2 913 | 12,04 | ||||
| 2025-08-08 | 13F | Pnc Financial Services Group, Inc. | 366 | 8 | ||||||
| 2025-08-18 | 13F | Geneos Wealth Management Inc. | 133 | 0,00 | 3 | 0,00 | ||||
| 2025-08-04 | 13F | Assetmark, Inc | 72 | 2 | ||||||
| 2025-08-12 | 13F | Jpmorgan Chase & Co | 86 471 | 10,58 | 1 950 | 18,91 | ||||
| 2025-09-04 | 13F/A | Advisor Group Holdings, Inc. | 200 139 | 12,36 | 4 515 | 20,82 | ||||
| 2025-07-10 | 13F | Wealth Enhancement Advisory Services, Llc | 87 521 | −0,24 | 2 002 | 8,81 | ||||
| 2025-08-05 | 13F | Strategic Financial Concepts, LLC | 52 265 | −2,43 | 1 179 | 4,90 | ||||
| 2025-08-14 | 13F | Wells Fargo & Company/mn | 149 778 | 15,17 | 3 377 | 23,84 | ||||
| 2025-05-05 | 13F | Hazlett, Burt & Watson, Inc. | 0 | −100,00 | 0 | |||||
| 2025-08-11 | 13F | Aptus Capital Advisors, LLC | 768 | 17 | ||||||
| 2025-07-22 | 13F | Foguth Wealth Management, LLC. | 536 276 | 735,39 | 12 093 | 798,44 | ||||
| 2025-08-04 | 13F | Spire Wealth Management | 0 | −100,00 | 0 | |||||
| 2025-08-11 | 13F | Tidemark, LLC | 0 | −100,00 | 0 | |||||
| 2025-08-12 | 13F | Proequities, Inc. | 0 | 0 | ||||||
| 2025-08-14 | 13F | Susquehanna International Group, Llp | Call | 29 300 | −42,88 | 661 | −38,60 | |||
| 2025-08-14 | 13F | Mariner, LLC | 9 558 | 216 | ||||||
| 2025-08-01 | 13F | Brookwood Investment Group LLC | 13 726 | 310 | ||||||
| 2025-08-13 | 13F | Northwestern Mutual Wealth Management Co | 23 010 | 106,29 | 519 | 122,32 | ||||
| 2025-08-14 | 13F | Sei Investments Co | 39 944 | 13,10 | 901 | 21,62 | ||||
| 2025-07-24 | 13F | IFP Advisors, Inc | 764 | 86,80 | 17 | 112,50 | ||||
| 2025-08-13 | 13F | Flow Traders U.s. Llc | 0 | −100,00 | 0 | |||||
| 2025-08-14 | 13F | Susquehanna International Group, Llp | Put | 9 200 | −14,81 | 207 | −8,41 | |||
| 2025-08-28 | NP | TFAFX - Tactical Growth Allocation Fund Class I | 2 646 | 60 | ||||||
| 2025-08-14 | 13F | Susquehanna International Group, Llp | 138 100 | 16,44 | 3 114 | 25,21 | ||||
| 2025-08-15 | 13F | Kestra Advisory Services, LLC | 22 805 | 82,57 | 514 | 96,93 | ||||
| 2025-07-17 | 13F | Fifth Third Securities, Inc. | 97 389 | −9,96 | 2 196 | −3,17 | ||||
| 2025-08-05 | 13F | Dunhill Financial, LLC | 1 683 | 38 | ||||||
| 2025-08-12 | 13F | Deutsche Bank Ag\ | 1 | 0 | ||||||
| 2025-07-16 | 13F | Strategic Investment Solutions, Inc. /IL | 150 | 3 | ||||||
| 2025-07-11 | 13F | Farther Finance Advisors, LLC | 3 063 | 2,07 | 69 | 9,52 | ||||
| 2025-04-25 | 13F | New Wave Wealth Advisors Llc | 0 | −100,00 | 0 | |||||
| 2025-07-30 | 13F | BTS Asset Management, Inc. | 26 802 | 604 | ||||||
| 2025-08-14 | 13F | Fmr Llc | 526 | 497,73 | 12 | 1 000,00 | ||||
| 2025-07-31 | 13F | Optimum Investment Advisors | 1 000 | 0,00 | 23 | 10,00 | ||||
| 2025-08-11 | 13F | HighTower Advisors, LLC | 25 247 | −0,30 | 569 | 7,16 | ||||
| 2025-08-12 | 13F | MAI Capital Management | 2 050 | 51 150,00 | 46 | |||||
| 2025-07-28 | 13F | Harbour Investments, Inc. | 5 474 | 0,00 | 123 | 7,89 | ||||
| 2025-08-14 | 13F | Comerica Bank | 178 | 20,27 | 4 | 33,33 | ||||
| 2025-08-06 | 13F | Commonwealth Equity Services, Llc | 38 070 | 35,53 | 1 | |||||
| 2025-08-18 | 13F/A | National Bank Of Canada /fi/ | 15 000 | 0,00 | 325 | 6,56 | ||||
| 2025-08-13 | 13F | SageView Advisory Group, LLC | 11 762 | −9,66 | 278 | 1,47 | ||||
| 2025-08-13 | 13F | M Holdings Securities, Inc. | 17 433 | 0 | ||||||
| 2025-07-08 | 13F | Goldstone Financial Group, LLC | 44 451 | −1,34 | 1 017 | 7,63 | ||||
| 2025-08-11 | 13F | Citigroup Inc | 400 | 0,00 | 9 | 12,50 | ||||
| 2025-08-14 | 13F | Mml Investors Services, Llc | 26 894 | 111,20 | 1 | |||||
| 2025-07-21 | 13F | Ameriflex Group, Inc. | 0 | −100,00 | 0 | |||||
| 2025-08-06 | 13F | Prospera Financial Services Inc | 23 242 | 14,07 | 524 | 22,72 | ||||
| 2025-08-11 | 13F | Western Wealth Management, LLC | 15 714 | −12,28 | 354 | −5,60 | ||||
| 2025-08-14 | 13F | GWM Advisors LLC | 75 791 | 7,48 | 1 709 | 15,63 | ||||
| 2025-08-05 | 13F | Westside Investment Management, Inc. | 1 000 | 0,00 | 23 | 10,00 | ||||
| 2025-07-29 | 13F | Private Trust Co Na | 1 166 | 0,00 | 26 | 8,33 | ||||
| 2025-08-14 | 13F | Ameriprise Financial Inc | 75 794 | 18,62 | 1 709 | 27,63 | ||||
| 2025-07-16 | 13F | ORG Partners LLC | 0 | −100,00 | 0 | |||||
| 2025-08-12 | 13F | LPL Financial LLC | 808 842 | 6,79 | 18 239 | 14,84 | ||||
| 2025-08-08 | 13F | Good Life Advisors, LLC | 18 263 | 3,76 | 412 | 11,38 | ||||
| 2025-08-01 | 13F | Howard Capital Management Inc. | 681 750 | 15 373 | ||||||
| 2025-07-21 | 13F | Synergy Financial Management, LLC | 87 496 | 1 973 | ||||||
| 2025-04-30 | 13F | Sofos Investments, Inc. | 666 | 0,00 | 14 | −7,14 | ||||
| 2025-07-18 | 13F | Bartlett & Co. Wealth Management Llc | 0 | −100,00 | 0 | |||||
| 2025-08-01 | 13F | Envestnet Asset Management Inc | 64 381 | 3,72 | 1 452 | 11,53 | ||||
| 2025-08-13 | 13F | Capital Analysts, Inc. | 266 | 0,00 | 0 | |||||
| 2025-07-25 | 13F | Atria Wealth Solutions, Inc. | 9 467 | −25,58 | 214 | −19,55 | ||||
| 2025-08-19 | 13F | Cape Investment Advisory, Inc. | 1 000 | 23 | ||||||
| 2025-05-12 | 13F | Sandy Spring Bank | 230 | 0,00 | 5 | 0,00 | ||||
| 2025-08-14 | 13F | Federation des caisses Desjardins du Quebec | 685 | −16,05 | 15 | −11,76 | ||||
| 2025-07-30 | NP | ORR - Militia Long/Short Equity ETF | Short | −432 409 | −9 310 | |||||
| 2025-07-08 | 13F | Nbc Securities, Inc. | 75 | 0,00 | 0 | |||||
| 2025-05-09 | 13F | GeoWealth Management, LLC | 0 | −100,00 | 0 | −100,00 | ||||
| 2025-07-21 | 13F | Mirae Asset Global Investments Co., Ltd. | 3 800 | 86 | ||||||
| 2025-05-14 | 13F | Gould Capital, LLC | 0 | −100,00 | 0 | |||||
| 2025-08-07 | 13F | Allworth Financial LP | 112 | 0,00 | 3 | 0,00 | ||||
| 2025-08-13 | 13F | Jones Financial Companies Lllp | 35 893 | 56,29 | 803 | 66,25 | ||||
| 2025-08-15 | 13F | Morgan Stanley | 580 719 | 1,80 | 13 095 | 9,48 |