Grundläggande statistik
| Institutionella aktier (lång) | 2 043 400 - 14,02% (ex 13D/G) - change of −0,03MM shares −1,29% MRQ |
| Institutionellt värde (lång) | $ 129 259 USD ($1000) |
Institutionellt ägande och aktieägare
Sabine Royalty Trust (US:SBR) har 142 Institutionella ägare och aktieägare som har lämnat in 13D/G- eller 13F-formulär till Securities Exchange Commission (SEC). Dessa institut innehar totalt 2,043,400 aktier. Största aktieägare inkluderar Beacon Pointe Advisors, LLC, King Luther Capital Management Corp, Fayez Sarofim & Co, Horizon Kinetics Asset Management Llc, Morgan Stanley, INFL - Horizon Kinetics Inflation Beneficiaries ETF, Howard Financial Services, Ltd., Two Sigma Investments, Lp, Americana Partners, LLC, and Chilton Capital Management Llc .
Sabine Royalty Trust (NYSE:SBR) Institutionell ägarstruktur visar institutioners och fonders nuvarande positioner i företaget, samt de senaste förändringarna i positionernas storlek. Större aktieägare kan vara enskilda investerare, fonder, hedgefonder eller institutioner. Bilaga 13D visar att investeraren äger (eller ägde) mer än 5% av företaget och avser (eller avsåg) att aktivt eftersträva en förändring av affärsstrategin. Schedule 13G indikerar en passiv investering på över 5%.
The share price as of September 10, 2025 is 77,49 / share. Previously, on September 11, 2024, the share price was 60,03 / share. This represents an increase of 29,09% over that period.

Fondsentimentets poäng
Fondsentimentet poängen(fka Ägarackumulation-poäng) visar vilka aktier som är mest köpta av fonder. Det är resultatet av en sofistikerad kvantitativ flerfaktormodell som identifierar företag med de högsta nivåerna av institutionell ackumulering. Poängsättningsmodellen använder en kombination av den totala ökningen av redovisade ägare, förändringarna i portföljallokeringarna för dessa ägare och andra mått. Siffran sträcker sig från 0 till 100, där högre siffror indikerar en högre nivå av ackumulering i förhållande till sina konkurrenter, och 50 är genomsnittet.
Uppdateringsfrekvens: Dagligen
Se Ownership Explorer, som innehåller en lista över de högst rankade företagen.
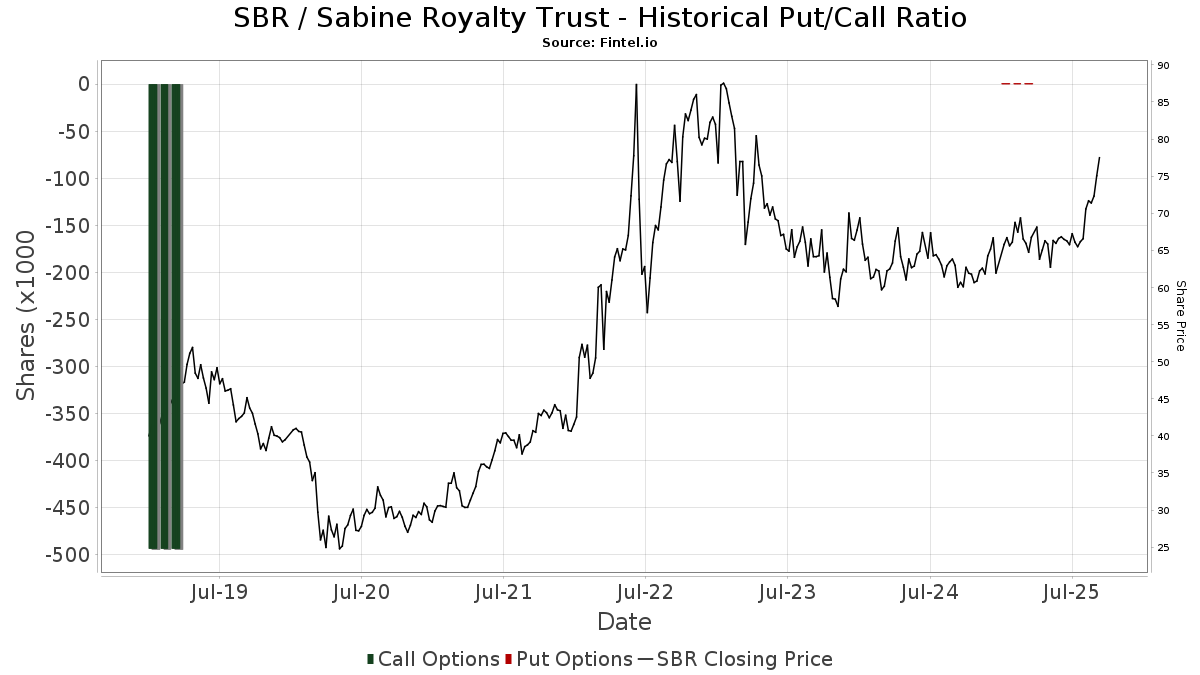
Institutionell sälj/köp-kvot
Förutom att rapportera vanliga eget kapital- och skuldemissioner måste institutioner med mer än 100MM tillgångar under förvaltning också avslöja sina innehav av sälj- och köpoptioner. Eftersom säljoptioner i allmänhet indikerar ett negativt sentiment och köpoptioner indikerar ett positivt sentiment, kan vi få en uppfattning om det övergripande institutionella sentimentet genom att plotta förhållandet mellan säljoptioner och köpoptioner. Diagrammet till höger visar det historiska förhållandet mellan sälj- och köpoptioner för detta instrument.
Genom att använda sälj/köp-kvoten som en indikator på aktieägarnas sentiment undviker man en av de största bristerna med att använda det totala institutionella ägandet, nämligen att en betydande del av de förvaltade tillgångarna investeras passivt för att följa index. Passivt förvaltade fonder köper vanligtvis inte optioner, så indikatorn för sälj/köp-kvoten ger en bättre bild av stämningen i aktivt förvaltade fonder.
13F- och NPORT-arkiveringar
Detaljer om 13F-arkiveringar är gratis. Detaljer om NP-arkiveringar kräver ett premiummedlemskap. Gröna rader indikerar nya positioner. Röda rader indikerar stängda positioner. Klicka på länk symbolen för att se hela transaktionshistoriken.
Uppgradera
för att låsa upp premiumdata och exportera till Excel ![]() .
.
| Fil Datum | Källa | Investerare | Typ | Genomsnittligt pris (beräknat) |
Aktier | Δ Aktier (%) |
Rapporterat värde (1000 USD) |
Δ Värde (%) |
Portföljallokering (%) |
|
|---|---|---|---|---|---|---|---|---|---|---|
| 2025-07-31 | 13F | Mcdaniel Terry & Co | 14 000 | 0,00 | 934 | |||||
| 2025-08-12 | 13F | XTX Topco Ltd | 0 | −100,00 | 0 | |||||
| 2025-08-14 | 13F | Fayez Sarofim & Co | 134 038 | −40,60 | 8 938 | −41,48 | ||||
| 2025-08-14 | 13F | Citadel Advisors Llc | 26 095 | 128,12 | 1 740 | 124,81 | ||||
| 2025-07-31 | 13F/A | Sendero Wealth Management, LLC | 12 927 | 0,00 | 862 | −1,60 | ||||
| 2025-07-23 | 13F | Citizens National Bank Trust Department | 1 000 | 0,00 | 67 | −1,49 | ||||
| 2025-05-06 | 13F | Venturi Wealth Management, LLC | 0 | −100,00 | 0 | |||||
| 2025-07-25 | 13F | Ackerman Capital Advisors, LLC | 3 417 | 0,00 | 227 | −1,30 | ||||
| 2025-08-15 | 13F | CI Private Wealth, LLC | 6 883 | 0,00 | 459 | −1,51 | ||||
| 2025-08-14 | 13F/A | Skopos Labs, Inc. | 54 | 14,89 | 4 | 0,00 | ||||
| 2025-08-21 | NP | LUSIX - Lazard US Systematic Small Cap Equity Portfolio Institutional Shares | 843 | −4,10 | 56 | −5,08 | ||||
| 2025-07-30 | 13F | Exencial Wealth Advisors, Llc | 10 357 | 0,00 | 688 | −1,43 | ||||
| 2025-04-29 | 13F | Envestnet Asset Management Inc | 0 | −100,00 | 0 | |||||
| 2025-08-15 | 13F | Morgan Stanley | 90 466 | 27,18 | 6 032 | 25,28 | ||||
| 2025-08-14 | 13F | Chilton Investment Co Llc | 9 067 | 0,00 | 605 | −1,47 | ||||
| 2025-08-19 | 13F | Advisory Services Network, LLC | 10 796 | 249,61 | 716 | 242,11 | ||||
| 2025-08-28 | NP | NVIR - Horizon Kinetics Energy and Remediation ETF | 493 | 0,00 | 33 | −3,03 | ||||
| 2025-08-13 | 13F | Russell Investments Group, Ltd. | 10 | 0,00 | 1 | |||||
| 2025-07-29 | 13F | Burford Brothers, Inc. | 10 142 | 1,42 | 674 | −0,15 | ||||
| 2025-07-10 | 13F | Clare Market Investments LLC | 27 643 | −0,54 | 1 843 | −2,02 | ||||
| 2025-08-08 | 13F | Creative Planning | 17 070 | −0,58 | 1 135 | −2,07 | ||||
| 2025-08-01 | 13F | Transcend Wealth Collective, Llc | 14 480 | 0,00 | 966 | −1,53 | ||||
| 2025-08-14 | 13F | Fmr Llc | 160 | −57,10 | 11 | −60,00 | ||||
| 2025-08-12 | 13F | BlackRock, Inc. | 50 | 0,00 | 3 | 0,00 | ||||
| 2025-07-29 | 13F | Oxbow Advisors, LLC | 4 091 | 0,00 | 272 | −1,45 | ||||
| 2025-07-23 | 13F | BankPlus Trust Department | 1 400 | 0,00 | 93 | −1,06 | ||||
| 2025-08-19 | 13F | State of Wyoming | 9 300 | 3,79 | 620 | 2,31 | ||||
| 2025-07-09 | 13F | Beacon Financial Group | 5 255 | 0,00 | 349 | −1,41 | ||||
| 2025-08-12 | 13F | BWM Planning, LLC | 21 552 | 0,00 | 1 437 | −1,44 | ||||
| 2025-07-25 | 13F | Atria Wealth Solutions, Inc. | 3 078 | 205 | ||||||
| 2025-07-29 | 13F | Private Trust Co Na | 6 800 | 0,00 | 453 | −1,52 | ||||
| 2025-07-31 | 13F | Cambridge Investment Research Advisors, Inc. | 3 929 | −5,94 | 0 | |||||
| 2025-08-13 | 13F | Cresset Asset Management, LLC | 13 005 | 867 | ||||||
| 2025-07-10 | 13F | Moody National Bank Trust Division | 35 185 | 2 346 | ||||||
| 2025-08-12 | 13F | Jpmorgan Chase & Co | 4 017 | −14,35 | 268 | −15,77 | ||||
| 2025-08-14 | 13F | Jane Street Group, Llc | 4 277 | −62,50 | 285 | −63,04 | ||||
| 2025-08-14 | 13F | Comerica Bank | 48 | 3 | ||||||
| 2025-04-08 | 13F | Lowe Wealth Advisors, LLC | 0 | −100,00 | 0 | |||||
| 2025-08-13 | 13F | SCS Capital Management LLC | 31 115 | 0,00 | 2 075 | −1,52 | ||||
| 2025-07-25 | 13F | Concurrent Investment Advisors, LLC | 25 355 | −10,80 | 1 686 | −12,15 | ||||
| 2025-08-11 | 13F | Citigroup Inc | 1 143 | −30,77 | 76 | −31,53 | ||||
| 2025-07-17 | 13F/A | Capital Investment Advisors, LLC | 12 653 | 1,55 | 841 | 0,12 | ||||
| 2025-08-15 | 13F | Kestra Advisory Services, LLC | 0 | −100,00 | 0 | |||||
| 2025-05-13 | 13F | FineMark National Bank & Trust | 0 | −100,00 | 0 | |||||
| 2025-08-08 | 13F | VeraBank, N.A. | 24 024 | 0,00 | 1 602 | −1,54 | ||||
| 2025-07-02 | 13F | Howard Financial Services, Ltd. | 67 814 | −12,42 | 4 506 | −13,73 | ||||
| 2025-08-14 | 13F | Bnp Paribas Arbitrage, Sa | 708 | 79,24 | 47 | 80,77 | ||||
| 2025-07-23 | 13F | Mraz, Amerine & Associates, Inc. | 24 525 | −1,01 | 1 630 | −1,09 | ||||
| 2025-04-22 | 13F | TrueMark Investments, LLC | 0 | −100,00 | 0 | |||||
| 2025-05-14 | 13F | Virtus ETF Advisers LLC | 0 | −100,00 | 0 | |||||
| 2025-08-14 | 13F | Ameriprise Financial Inc | 6 216 | −14,52 | 415 | −15,85 | ||||
| 2025-08-06 | 13F | Adviser Investments LLC | 9 197 | −1,76 | 613 | −3,16 | ||||
| 2025-08-14 | 13F | Kovitz Investment Group Partners, LLC | 7 032 | 0,00 | 467 | −1,48 | ||||
| 2025-08-28 | NP | SMLV - SPDR SSGA US Small Cap Low Volatility Index ETF This fund is a listed as child fund of State Street Corp and if that institution has disclosed ownership in this security, then these positions will not be double counted when calculating total shares and total value | 7 229 | −15,33 | 482 | −16,46 | ||||
| 2025-08-19 | 13F | Campbell Capital Management Inc | 0 | −100,00 | 0 | |||||
| 2025-08-12 | 13F | Steward Partners Investment Advisory, Llc | 200 | 0,00 | 13 | 0,00 | ||||
| 2025-08-14 | 13F | UBS Group AG | 14 037 | −22,20 | 936 | −23,42 | ||||
| 2025-07-16 | 13F | Essex Financial Services, Inc. | 9 186 | −2,43 | 613 | −3,92 | ||||
| 2025-08-14 | 13F | Raymond James Financial Inc | 16 032 | −1,20 | 1 069 | −2,64 | ||||
| 2025-07-23 | 13F | Tyche Wealth Partners LLC | 4 758 | 0,00 | 317 | −1,55 | ||||
| 2025-09-04 | 13F/A | Advisor Group Holdings, Inc. | 17 768 | 8,06 | 1 185 | 6,47 | ||||
| 2025-08-07 | 13F | Allworth Financial LP | 386 | −88,25 | 26 | −88,58 | ||||
| 2025-08-04 | 13F | Quaker Wealth Management, LLC | 1 000 | 66 | ||||||
| 2025-07-25 | 13F | M.e. Allison & Co., Inc. | 4 061 | 0,00 | 271 | −1,46 | ||||
| 2025-08-13 | 13F | Virtus Investment Advisers, Inc. | 2 593 | 7,24 | 173 | 5,52 | ||||
| 2025-08-11 | 13F | Rahlfs Capital, Llc | 11 985 | 1,48 | 798 | 0,00 | ||||
| 2025-08-07 | 13F | PFG Advisors | 14 846 | 0,34 | 987 | −1,20 | ||||
| 2025-07-31 | 13F | Buckingham Strategic Partners | 3 058 | 0,00 | 204 | −1,93 | ||||
| 2025-07-25 | 13F | Cwm, Llc | 237 | 1,28 | 0 | |||||
| 2025-08-04 | 13F | AMG National Trust Bank | 12 680 | 0,00 | 844 | −1,40 | ||||
| 2025-08-12 | 13F | Global Retirement Partners, LLC | 238 | 0,00 | 16 | 0,00 | ||||
| 2025-05-12 | 13F | Invesco Ltd. | 0 | −100,00 | 0 | −100,00 | ||||
| 2025-07-25 | 13F | Verdence Capital Advisors LLC | 10 500 | 0,00 | 700 | −1,41 | ||||
| 2025-08-14 | 13F | Bank Of America Corp /de/ | 28 496 | 11,88 | 1 900 | 10,21 | ||||
| 2025-05-15 | 13F | Mariner, LLC | 0 | −100,00 | 0 | |||||
| 2025-08-15 | 13F | Captrust Financial Advisors | 3 729 | 0,00 | 248 | −1,59 | ||||
| 2025-08-06 | 13F | Commonwealth Equity Services, Llc | 31 588 | 6,30 | 2 | 0,00 | ||||
| 2025-08-11 | 13F | Hexagon Capital Partners LLC | 0 | −100,00 | 0 | |||||
| 2025-08-12 | 13F | Pathstone Holdings, LLC | 3 617 | 0,00 | 241 | −1,23 | ||||
| 2025-08-12 | 13F | Manchester Capital Management LLC | 55 | 0,00 | 4 | 0,00 | ||||
| 2025-08-04 | 13F | Creekmur Asset Management LLC | 1 | 0,00 | 0 | |||||
| 2025-08-07 | 13F | King Luther Capital Management Corp | 143 555 | 0,00 | 9 572 | −1,49 | ||||
| 2025-07-15 | 13F | Significant Wealth Partners LLC | 4 739 | −9,02 | 315 | −10,54 | ||||
| 2025-08-14 | 13F | Two Sigma Investments, Lp | 56 130 | 31,67 | 3 743 | 29,71 | ||||
| 2025-08-12 | 13F | Holderness Investments Co | 6 000 | 0,00 | 399 | −1,49 | ||||
| 2025-08-13 | 13F | Marshall Wace, Llp | 23 172 | 1 545 | ||||||
| 2025-08-14 | 13F | Royal Bank Of Canada | 1 464 | 65,61 | 98 | 63,33 | ||||
| 2025-07-11 | 13F/A | Umb Bank N A/mo | 45 | 0,00 | 3 | 0,00 | ||||
| 2025-08-12 | 13F | Bokf, Na | 6 500 | 0,00 | 433 | −1,37 | ||||
| 2025-07-15 | 13F | Td Private Client Wealth Llc | 10 | 1 | ||||||
| 2025-07-24 | 13F | Robertson Stephens Wealth Management, LLC | 10 600 | 0,00 | 704 | −1,54 | ||||
| 2025-08-01 | 13F | Motco | 11 600 | 0,00 | 769 | −2,17 | ||||
| 2025-08-08 | 13F | Islay Capital Management, Llc | 3 000 | −25,00 | 199 | −26,02 | ||||
| 2025-08-12 | 13F | LPL Financial LLC | 22 923 | 4,03 | 1 528 | 2,48 | ||||
| 2025-07-14 | 13F | GAMMA Investing LLC | 0 | −100,00 | 0 | |||||
| 2025-08-11 | 13F | HighTower Advisors, LLC | 6 644 | −1,20 | 442 | −2,64 | ||||
| 2025-08-04 | 13F | Quaker Wealth Management, LLC | Put | 0 | −100,00 | 0 | −100,00 | |||
| 2025-08-11 | 13F | Principal Securities, Inc. | 17 | 1 600,00 | 1 | |||||
| 2025-08-28 | NP | RENN Fund, Inc. | 100 | 0,00 | 7 | 0,00 | ||||
| 2025-08-13 | 13F | Capital Analysts, Inc. | 27 425 | 16,23 | 2 | 0,00 | ||||
| 2025-08-14 | 13F | Hilltop Holdings Inc. | 6 176 | 1,25 | 412 | −0,24 | ||||
| 2025-08-06 | 13F | Decker Retirement Planning Inc. | 0 | 0 | ||||||
| 2025-08-14 | 13F | Susquehanna International Group, Llp | 24 164 | 48,08 | 1 611 | 45,92 | ||||
| 2025-08-14 | 13F | Wells Fargo & Company/mn | 16 710 | −19,71 | 1 114 | −20,88 | ||||
| 2025-07-24 | 13F | Ronald Blue Trust, Inc. | 17 009 | −41,03 | 1 134 | −41,91 | ||||
| 2025-07-28 | 13F | Harbour Investments, Inc. | 120 | 2,56 | 8 | 0,00 | ||||
| 2025-08-15 | 13F | Tower Research Capital LLC (TRC) | 37 | −94,37 | 2 | −95,45 | ||||
| 2025-04-28 | NP | BFOR - Barron's 400 ETF | 5 972 | 1,22 | 391 | 1,83 | ||||
| 2025-08-14 | 13F | State Street Corp | 7 229 | 4,18 | 482 | 2,77 | ||||
| 2025-07-23 | 13F | Prime Capital Investment Advisors, LLC | 3 000 | 0,00 | 200 | −1,48 | ||||
| 2025-08-07 | 13F | Americana Partners, LLC | 37 155 | 2 469 | ||||||
| 2025-06-25 | NP | VRAI - Virtus Real Asset Income ETF | 2 350 | −1,71 | 155 | −2,53 | ||||
| 2025-08-14 | 13F/A | Perritt Capital Management Inc | 2 579 | 0,00 | 171 | −1,16 | ||||
| 2025-07-15 | 13F | Fifth Third Bancorp | 355 | 24 | ||||||
| 2025-08-14 | 13F | Peapack Gladstone Financial Corp | 22 283 | 8,82 | 1 | 0,00 | ||||
| 2025-08-14 | 13F | GWM Advisors LLC | 540 | 0,00 | 36 | 0,00 | ||||
| 2025-08-05 | 13F | Huntington National Bank | 500 | −14,82 | 33 | −15,38 | ||||
| 2025-07-21 | 13F | Franklin Street Advisors Inc /nc | 10 081 | 0,00 | 1 | |||||
| 2025-08-14 | 13F | Qube Research & Technologies Ltd | 21 405 | −6,08 | 1 427 | −7,46 | ||||
| 2025-07-21 | 13F | Custos Family Office, LLC | 5 564 | 0,00 | 371 | −1,33 | ||||
| 2025-08-06 | 13F | Prospera Financial Services Inc | 31 059 | 4,94 | 2 071 | 3,39 | ||||
| 2025-07-31 | 13F | Fielder Capital Group LLC | 11 377 | 0,00 | 759 | −1,56 | ||||
| 2025-07-31 | 13F | Carnegie Capital Asset Management, LLC | 7 507 | 2,84 | 501 | 12,61 | ||||
| 2025-08-08 | 13F | Cetera Investment Advisers | 5 926 | 7,73 | 395 | 6,18 | ||||
| 2025-08-12 | 13F | Horizon Kinetics Asset Management Llc | 109 521 | −7,41 | 7 303 | −8,79 | ||||
| 2025-08-13 | 13F | Beacon Pointe Advisors, LLC | 195 894 | 1,26 | 13 017 | −0,25 | ||||
| 2025-08-13 | 13F | Brown Advisory Inc | 9 100 | −3,19 | 607 | −4,72 | ||||
| 2025-07-07 | 13F | Salem Investment Counselors Inc | 0 | −100,00 | 0 | |||||
| 2025-07-18 | 13F | PFG Investments, LLC | 3 898 | 260 | ||||||
| 2025-08-15 | 13F | Fairfield, Bush & Co. | 3 951 | −2,47 | 263 | −4,03 | ||||
| 2025-07-30 | 13F | Loring Wolcott & Coolidge Fiduciary Advisors Llp/ma | 1 437 | 0,00 | 96 | 0,00 | ||||
| 2025-04-01 | NP | PRFZ - Invesco FTSE RAFI US 1500 Small-Mid ETF This fund is a listed as child fund of Invesco Ltd. and if that institution has disclosed ownership in this security, then these positions will not be double counted when calculating total shares and total value | 8 283 | −0,10 | 548 | 8,51 | ||||
| 2025-07-17 | 13F | Sound Income Strategies, LLC | 50 | 0,00 | 3 | 0,00 | ||||
| 2025-07-11 | 13F | Farther Finance Advisors, LLC | 22 | 0,00 | 1 | 0,00 | ||||
| 2025-08-28 | NP | INFL - Horizon Kinetics Inflation Beneficiaries ETF | 85 201 | 0,00 | 5 681 | −1,49 | ||||
| 2025-04-30 | 13F | Alps Advisors Inc | 0 | −100,00 | 0 | |||||
| 2025-07-16 | 13F | American National Bank | 1 483 | 0,00 | 99 | −2,00 | ||||
| 2025-07-22 | 13F | Olistico Wealth, LLC | 427 | 0,00 | 28 | 0,00 | ||||
| 2025-07-10 | 13F | Wealth Enhancement Advisory Services, Llc | 3 570 | −9,98 | 237 | −11,24 | ||||
| 2025-08-14 | 13F | Mercer Global Advisors Inc /adv | 14 883 | 0,00 | 990 | −1,49 | ||||
| 2025-07-21 | 13F | Monticello Wealth Management, Llc | 5 908 | 0,00 | 393 | −1,50 | ||||
| 2025-08-14 | 13F | Two Sigma Advisers, Lp | 10 800 | 41,25 | 720 | 39,26 | ||||
| 2025-08-18 | 13F | Geneos Wealth Management Inc. | 5 257 | 11,21 | 351 | 10,06 | ||||
| 2025-08-14 | 13F | Summit Trail Advisors, Llc | 8 500 | 567 | ||||||
| 2025-08-04 | 13F | Assetmark, Inc | 13 | 1 | ||||||
| 2025-08-12 | 13F | Proequities, Inc. | 0 | 0 | ||||||
| 2025-08-14 | 13F | Stifel Financial Corp | 15 673 | 0,13 | 1 045 | −1,32 | ||||
| 2025-08-08 | 13F | Pnc Financial Services Group, Inc. | 3 324 | 0,00 | 222 | −1,78 | ||||
| 2025-08-14 | 13F | Lazard Asset Management Llc | 6 274 | 0,42 | 0 | |||||
| 2025-08-12 | 13F | Argent Trust Co | 4 977 | 0,00 | 332 | −1,49 | ||||
| 2025-08-06 | 13F | Moors & Cabot, Inc. | 18 542 | −1,59 | 1 236 | −3,06 | ||||
| 2025-07-16 | 13F | Signature Resources Capital Management, LLC | 600 | 0,00 | 40 | −2,50 | ||||
| 2025-08-14 | 13F | Sunbelt Securities, Inc. | 5 000 | 0,00 | 324 | −4,14 | ||||
| 2025-08-28 | NP | PVFIX - Pinnacle Value Fund | 5 441 | 817,54 | 363 | 805,00 | ||||
| 2025-08-14 | 13F | Uniplan Investment Counsel, Inc. | 12 859 | 857 | ||||||
| 2025-07-29 | 13F | Regions Financial Corp | 3 819 | 0,00 | 255 | −1,55 | ||||
| 2025-08-01 | 13F | Chilton Capital Management Llc | 35 523 | −13,42 | 2 361 | −14,71 | ||||
| 2025-08-18 | 13F/A | Westwood Holdings Group Inc | 5 325 | 0,41 | 355 | −0,84 | ||||
| 2025-08-14 | 13F | Federation des caisses Desjardins du Quebec | 150 | 0,00 | 10 | 0,00 | ||||
| 2025-08-15 | 13F | WealthCollab, LLC | 195 | 13 |