Grundläggande statistik
| Institutionella ägare | 214 total, 214 long only, 0 short only, 0 long/short - change of 0,00% MRQ |
| Genomsnittlig portföljallokering | 0.0975 % - change of −28,36% MRQ |
| Institutionella aktier (lång) | 5 215 846 (ex 13D/G) - change of −1,52MM shares −22,52% MRQ |
| Institutionellt värde (lång) | $ 297 323 USD ($1000) |
Institutionellt ägande och aktieägare
Exchange Traded Concepts Trust - ROBO Global Robotics and Automation Index ETF (US:ROBO) har 214 Institutionella ägare och aktieägare som har lämnat in 13D/G- eller 13F-formulär till Securities Exchange Commission (SEC). Dessa institut innehar totalt 5,215,846 aktier. Största aktieägare inkluderar UBS Group AG, Morgan Stanley, LPL Financial LLC, Fountainhead AM, LLC, Gray Foundation, Raymond James Financial Inc, Biltmore Family Office, LLC, CI Private Wealth, LLC, Royal Bank Of Canada, and Ameriprise Financial Inc .
Exchange Traded Concepts Trust - ROBO Global Robotics and Automation Index ETF (ARCA:ROBO) Institutionell ägarstruktur visar institutioners och fonders nuvarande positioner i företaget, samt de senaste förändringarna i positionernas storlek. Större aktieägare kan vara enskilda investerare, fonder, hedgefonder eller institutioner. Bilaga 13D visar att investeraren äger (eller ägde) mer än 5% av företaget och avser (eller avsåg) att aktivt eftersträva en förändring av affärsstrategin. Schedule 13G indikerar en passiv investering på över 5%.
The share price as of September 11, 2025 is 65,36 / share. Previously, on September 12, 2024, the share price was 53,61 / share. This represents an increase of 21,92% over that period.

Fondsentimentets poäng
Fondsentimentet poängen(fka Ägarackumulation-poäng) visar vilka aktier som är mest köpta av fonder. Det är resultatet av en sofistikerad kvantitativ flerfaktormodell som identifierar företag med de högsta nivåerna av institutionell ackumulering. Poängsättningsmodellen använder en kombination av den totala ökningen av redovisade ägare, förändringarna i portföljallokeringarna för dessa ägare och andra mått. Siffran sträcker sig från 0 till 100, där högre siffror indikerar en högre nivå av ackumulering i förhållande till sina konkurrenter, och 50 är genomsnittet.
Uppdateringsfrekvens: Dagligen
Se Ownership Explorer, som innehåller en lista över de högst rankade företagen.
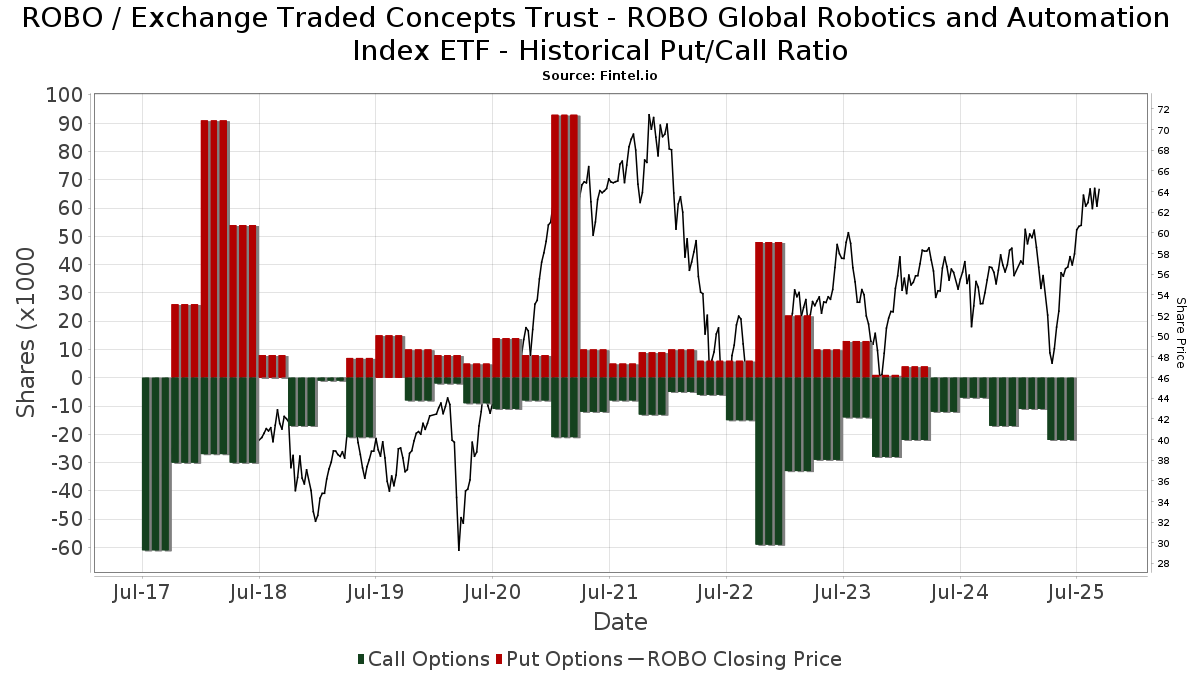
Institutionell sälj/köp-kvot
Förutom att rapportera vanliga eget kapital- och skuldemissioner måste institutioner med mer än 100MM tillgångar under förvaltning också avslöja sina innehav av sälj- och köpoptioner. Eftersom säljoptioner i allmänhet indikerar ett negativt sentiment och köpoptioner indikerar ett positivt sentiment, kan vi få en uppfattning om det övergripande institutionella sentimentet genom att plotta förhållandet mellan säljoptioner och köpoptioner. Diagrammet till höger visar det historiska förhållandet mellan sälj- och köpoptioner för detta instrument.
Genom att använda sälj/köp-kvoten som en indikator på aktieägarnas sentiment undviker man en av de största bristerna med att använda det totala institutionella ägandet, nämligen att en betydande del av de förvaltade tillgångarna investeras passivt för att följa index. Passivt förvaltade fonder köper vanligtvis inte optioner, så indikatorn för sälj/köp-kvoten ger en bättre bild av stämningen i aktivt förvaltade fonder.
13F- och NPORT-arkiveringar
Detaljer om 13F-arkiveringar är gratis. Detaljer om NP-arkiveringar kräver ett premiummedlemskap. Gröna rader indikerar nya positioner. Röda rader indikerar stängda positioner. Klicka på länk symbolen för att se hela transaktionshistoriken.
Uppgradera
för att låsa upp premiumdata och exportera till Excel ![]() .
.
| Fil Datum | Källa | Investerare | Typ | Genomsnittligt pris (beräknat) |
Aktier | Δ Aktier (%) |
Rapporterat värde (1000 USD) |
Δ Värde (%) |
Portföljallokering (%) |
|
|---|---|---|---|---|---|---|---|---|---|---|
| 2025-08-12 | 13F | Kimelman & Baird, LLC | 401 | 0,00 | 24 | 15,00 | ||||
| 2025-08-14 | 13F | Jane Street Group, Llc | 45 652 | 250,87 | 2 729 | 307,31 | ||||
| 2025-04-23 | 13F | Spirepoint Private Client, Llc | 0 | −100,00 | 0 | |||||
| 2025-05-09 | 13F | Sfmg, Llc | 0 | −100,00 | 0 | |||||
| 2025-08-14 | 13F | First Foundation Advisors | 5 211 | 0,00 | 312 | 16,04 | ||||
| 2025-08-04 | 13F | Creative Financial Designs Inc /adv | 5 | 0,00 | 0 | |||||
| 2025-04-15 | 13F | Noble Wealth Management PBC | 680 | 106,06 | 35 | 94,44 | ||||
| 2025-08-14 | 13F | Wells Fargo & Company/mn | 5 133 | −14,68 | 307 | −0,97 | ||||
| 2025-08-05 | 13F | Crestwood Advisors Group LLC | 59 037 | −4,40 | 3 529 | 10,97 | ||||
| 2025-05-05 | 13F | Migdal Insurance & Financial Holdings Ltd. | 0 | −100,00 | 0 | |||||
| 2025-08-14 | 13F | Stifel Financial Corp | 29 691 | 17,58 | 1 775 | 36,46 | ||||
| 2025-08-12 | 13F | Park Square Financial Group, LLC | 270 | −15,36 | 16 | 0,00 | ||||
| 2025-08-13 | 13F | Cresset Asset Management, LLC | 4 382 | 5,18 | 262 | 22,43 | ||||
| 2025-08-11 | 13F | Western Wealth Management, LLC | 3 363 | 201 | ||||||
| 2025-04-01 | 13F | Modus Advisors, LLC | 0 | −100,00 | 0 | |||||
| 2025-08-08 | 13F | Pnc Financial Services Group, Inc. | 2 500 | −26,32 | 149 | −14,37 | ||||
| 2025-08-14 | 13F | Royal Bank Of Canada | 155 563 | 0,23 | 9 299 | 16,34 | ||||
| 2025-07-14 | 13F | CHICAGO TRUST Co NA | 5 300 | 0,00 | 317 | 16,18 | ||||
| 2025-08-14 | 13F | Raymond James Financial Inc | 203 455 | −3,25 | 12 163 | 12,31 | ||||
| 2025-07-21 | 13F | Ntv Asset Management Llc | 89 160 | −1,92 | 5 330 | 13,84 | ||||
| 2025-07-31 | 13F/A | Avion Wealth | 169 | 0 | ||||||
| 2025-08-26 | 13F/A | Thrivent Financial For Lutherans | 0 | −100,00 | 0 | |||||
| 2025-08-18 | 13F | Geneos Wealth Management Inc. | 21 225 | 0,00 | 1 269 | 16,01 | ||||
| 2025-08-12 | 13F | Steward Partners Investment Advisory, Llc | 2 628 | 0,00 | 157 | 16,30 | ||||
| 2025-08-08 | 13F | SBI Securities Co., Ltd. | 776 | 4,86 | 46 | 21,05 | ||||
| 2025-05-07 | 13F | Hallmark Capital Management Inc | 0 | −100,00 | 0 | −100,00 | ||||
| 2025-07-16 | 13F | Brown, Lisle/cummings, Inc. | 117 | 0,00 | 7 | 0,00 | ||||
| 2025-08-14 | 13F | Bnp Paribas Arbitrage, Sa | 0 | −100,00 | 0 | |||||
| 2025-08-11 | 13F | Synergy Investment Management, LLC | 0 | −100,00 | 0 | |||||
| 2025-07-08 | 13F | Quintet Private Bank (Europe) S.A. | 600 | 0,00 | 36 | 16,67 | ||||
| 2025-08-12 | 13F | Aspiring Ventures, LLC | 7 500 | 0,00 | 448 | 13,99 | ||||
| 2025-07-23 | 13F | Joel Isaacson & Co., LLC | 9 401 | 0,00 | 562 | 15,91 | ||||
| 2025-07-30 | 13F | Evermay Wealth Management Llc | 1 010 | 0,00 | 60 | 15,38 | ||||
| 2025-07-31 | 13F | Oppenheimer & Co Inc | 10 556 | 3,48 | 631 | 20,19 | ||||
| 2025-07-25 | 13F | Atria Wealth Solutions, Inc. | 0 | −100,00 | 0 | |||||
| 2025-07-31 | 13F | Cambridge Investment Research Advisors, Inc. | 49 990 | −34,13 | 3 | −33,33 | ||||
| 2025-05-12 | 13F | Sandy Spring Bank | 123 | 0,00 | 6 | 0,00 | ||||
| 2025-08-13 | 13F | Kilter Group LLC | 76 | 5 | ||||||
| 2025-08-14 | 13F | UBS Group AG | 727 984 | −12,96 | 43 519 | 1,04 | ||||
| 2025-08-14 | 13F | Citadel Advisors Llc | Call | 4 500 | −31,82 | 269 | −20,65 | |||
| 2025-08-14 | 13F | Citadel Advisors Llc | 29 627 | −25,58 | 1 771 | −13,61 | ||||
| 2025-07-17 | 13F | Wolff Wiese Magana Llc | 125 | 0,00 | 7 | 16,67 | ||||
| 2025-07-14 | 13F | Toth Financial Advisory Corp | 360 | 0,00 | 22 | 16,67 | ||||
| 2025-07-28 | 13F | Mutual Advisors, LLC | 13 350 | 146,04 | 847 | 208,76 | ||||
| 2025-08-08 | 13F | Cetera Investment Advisers | 53 412 | −9,47 | 3 193 | 5,07 | ||||
| 2025-08-14 | 13F | Old Mission Capital Llc | 42 128 | 424,63 | 2 518 | 509,69 | ||||
| 2025-08-07 | 13F | Winch Advisory Services, LLC | 3 438 | 0,00 | 206 | 15,82 | ||||
| 2025-07-14 | 13F | AdvisorNet Financial, Inc | 780 | −66,82 | 47 | −61,98 | ||||
| 2025-07-17 | 13F | Nelson, Van Denburg & Campbell Wealth Management Group, LLC | 0 | −100,00 | 0 | |||||
| 2025-08-05 | 13F | Bank of New York Mellon Corp | 13 038 | −0,03 | 779 | 16,10 | ||||
| 2025-08-14 | 13F | Fmr Llc | 7 267 | −8,04 | 434 | 6,90 | ||||
| 2025-08-14 | 13F | McIlrath & Eck, LLC | 960 | 0,00 | 57 | 16,33 | ||||
| 2025-08-13 | 13F | Financial Freedom, LLC | 6 996 | −0,01 | 418 | 16,11 | ||||
| 2025-07-25 | 13F | Johnson Investment Counsel Inc | 4 596 | 0,00 | 275 | 16,10 | ||||
| 2025-07-21 | 13F | Matauro, Llc | 4 110 | 0,00 | 246 | 16,11 | ||||
| 2025-07-29 | 13F | Koshinski Asset Management, Inc. | 4 290 | 256 | ||||||
| 2025-07-30 | 13F | St. Johns Investment Management Company, LLC | 0 | −100,00 | 0 | |||||
| 2025-08-07 | 13F | Allworth Financial LP | 649 | 56,39 | 39 | 90,00 | ||||
| 2025-07-23 | 13F | Objectivity Squared, LLC | 9 674 | 0,00 | 578 | 25,93 | ||||
| 2025-08-08 | 13F | Glassman Wealth Services | 30 | 0,00 | 2 | 0,00 | ||||
| 2025-07-08 | 13F | Zrc Wealth Management, Llc | 0 | −100,00 | 0 | |||||
| 2025-09-04 | 13F/A | Advisor Group Holdings, Inc. | 46 922 | −20,70 | 2 806 | −7,94 | ||||
| 2025-07-25 | 13F | Cwm, Llc | 3 609 | 0,00 | 0 | |||||
| 2025-04-24 | 13F | Wingate Wealth Advisors, Inc. | 0 | −100,00 | 0 | |||||
| 2025-08-14 | 13F | CIBC World Markets Inc. | 8 628 | 516 | ||||||
| 2025-04-17 | 13F | Dynamic Advisor Solutions LLC | 0 | −100,00 | 0 | |||||
| 2025-08-13 | 13F | Scotia Capital Inc. | 9 909 | 5,71 | 592 | 22,82 | ||||
| 2025-05-14 | 13F | TD Capital Management LLC | 0 | −100,00 | 0 | |||||
| 2025-07-22 | 13F | Comprehensive Financial Consultants Institutional, Inc. | 4 506 | 0,00 | 269 | 15,95 | ||||
| 2025-08-12 | 13F | CIBC Private Wealth Group, LLC | 247 | 0,00 | 15 | 40,00 | ||||
| 2025-07-16 | 13F | PFS Partners, LLC | 600 | 0,00 | 36 | 16,67 | ||||
| 2025-07-22 | 13F | SOL Capital Management CO | 9 610 | −0,52 | 1 | |||||
| 2025-08-07 | 13F | Cahill Financial Advisors Inc | 5 078 | 0,00 | 304 | 16,09 | ||||
| 2025-07-24 | 13F | Ronald Blue Trust, Inc. | 2 988 | 0,00 | 179 | 16,34 | ||||
| 2025-08-14 | 13F | Peapack Gladstone Financial Corp | 5 600 | 1,82 | 0 | |||||
| 2025-08-14 | 13F | Susquehanna International Group, Llp | 0 | −100,00 | 0 | |||||
| 2025-08-14 | 13F | Hancock Prospecting Pty Ltd | 21 793 | 0,00 | 1 303 | 16,04 | ||||
| 2025-08-04 | 13F | Gray Foundation | 205 000 | 0,00 | 12 255 | 16,07 | ||||
| 2025-08-07 | 13F | Summit Asset Management, LLC | 3 900 | 0,00 | 233 | 16,50 | ||||
| 2025-07-22 | 13F | Powell Investment Advisors, LLC | 251 | 15 | ||||||
| 2025-08-12 | 13F | Financial Advocates Investment Management | 3 636 | −15,17 | 217 | −1,36 | ||||
| 2025-05-12 | 13F | Independent Advisor Alliance | 0 | −100,00 | 0 | |||||
| 2025-08-12 | 13F | Coldstream Capital Management Inc | 0 | −100,00 | 0 | |||||
| 2025-05-15 | 13F | CAPROCK Group, Inc. | 11 586 | −1,81 | 597 | −10,11 | ||||
| 2025-08-14 | 13F | Group One Trading, L.p. | 163 | 0,00 | 10 | 12,50 | ||||
| 2025-07-15 | 13F | Main Street Group, LTD | 2 | 0,00 | 0 | |||||
| 2025-07-23 | 13F | Vontobel Holding Ltd. | 6 485 | 0,00 | 388 | 16,22 | ||||
| 2025-07-10 | 13F | Wedmont Private Capital | 6 400 | 0,00 | 388 | 27,30 | ||||
| 2025-07-25 | 13F | M3 Advisory Group, LLC | 3 552 | 212 | ||||||
| 2025-08-13 | 13F | Vermillion & White Wealth Management Group, LLC | 34 | 0,00 | 2 | 100,00 | ||||
| 2025-07-31 | 13F | Washington Trust Advisors, Inc. | 136 | 0,00 | 8 | 14,29 | ||||
| 2025-08-12 | 13F | Manchester Capital Management LLC | 2 600 | 0,00 | 155 | 16,54 | ||||
| 2025-08-12 | 13F | Mustico Financial Group, Inc. | 5 437 | 340 | ||||||
| 2025-07-08 | 13F | Nbc Securities, Inc. | 37 | 0,00 | 0 | |||||
| 2025-07-18 | 13F | Bartlett & Co. Wealth Management Llc | 800 | 0,00 | 48 | 14,63 | ||||
| 2025-07-29 | 13F | Stratos Wealth Partners, LTD. | 59 002 | −3,34 | 3 527 | 12,22 | ||||
| 2025-08-13 | 13F | Capital Analysts, Inc. | 200 | 0,00 | 0 | |||||
| 2025-08-12 | 13F | Coston, McIsaac & Partners | 5 | 0 | ||||||
| 2025-07-24 | 13F | IFP Advisors, Inc | 336 | −64,10 | 20 | −58,33 | ||||
| 2025-05-15 | 13F | Tower Research Capital LLC (TRC) | 0 | −100,00 | 0 | |||||
| 2025-05-29 | 13F/A | Nova Wealth Management, Inc. | 50 | −45,65 | 3 | −60,00 | ||||
| 2025-08-12 | 13F | RPG Investment Advisory, LLC | 23 764 | −51,14 | 1 421 | −43,29 | ||||
| 2025-08-13 | 13F | Summit Financial, LLC | 30 577 | 1 828 | ||||||
| 2025-08-05 | 13F | Simplex Trading, Llc | 0 | −100,00 | 0 | |||||
| 2025-08-13 | 13F | Cerity Partners LLC | 4 961 | 0,00 | 297 | 16,08 | ||||
| 2025-07-28 | 13F | Smart Portfolios, LLC | 3 680 | 220 | ||||||
| 2025-08-12 | 13F | Clearwater Capital Advisors, LLC | 3 818 | 228 | ||||||
| 2025-07-17 | 13F | Clay Northam Wealth Management, LLC | 14 388 | −4,32 | 860 | 11,11 | ||||
| 2025-08-08 | 13F | Hartland & Co., LLC | 622 | 1 843,75 | 37 | 3 600,00 | ||||
| 2025-08-14 | 13F | Great Valley Advisor Group, Inc. | 3 389 | −19,54 | 203 | −6,48 | ||||
| 2025-08-14 | 13F | Camden Capital, LLC | 9 302 | 0,00 | 556 | 16,08 | ||||
| 2025-07-18 | 13F | Vigilare Wealth Management | 3 667 | 219 | ||||||
| 2025-08-14 | 13F | CoreCap Advisors, LLC | 60 | 0,00 | 4 | 0,00 | ||||
| 2025-07-30 | 13F | Pacific Sun Financial Corp | 38 095 | −1,04 | 2 277 | 14,88 | ||||
| 2025-08-11 | 13F | Blue Bell Private Wealth Management, Llc | 15 | 0,00 | 1 | |||||
| 2025-08-04 | 13F | Creekmur Asset Management LLC | 1 456 | −5,64 | 87 | 10,13 | ||||
| 2025-08-14 | 13F/A | Barclays Plc | 3 500 | −24,11 | 0 | |||||
| 2025-07-21 | 13F | Crews Bank & Trust | 100 | 0,00 | 6 | 0,00 | ||||
| 2025-07-18 | 13F | Truist Financial Corp | 6 329 | 60,35 | 378 | 86,21 | ||||
| 2025-04-16 | 13F | New Century Financial Group, LLC | 0 | −100,00 | 0 | |||||
| 2025-08-13 | 13F | Flow Traders U.s. Llc | 34 674 | −66,47 | 2 | −60,00 | ||||
| 2025-08-08 | 13F | WASHINGTON TRUST Co | 0 | −100,00 | 0 | |||||
| 2025-08-08 | 13F | Gts Securities Llc | 4 883 | 292 | ||||||
| 2025-08-14 | 13F | Bank Of America Corp /de/ | 8 052 | 4,99 | 481 | 22,08 | ||||
| 2025-08-13 | 13F | Wealthquest Corp | 0 | −100,00 | 0 | −100,00 | ||||
| 2025-07-28 | 13F | Harbour Investments, Inc. | 2 945 | −32,76 | 176 | −21,78 | ||||
| 2025-08-14 | 13F | Millennium Management Llc | 17 711 | 38,87 | 1 059 | 61,28 | ||||
| 2025-08-14 | 13F/A | Rockefeller Capital Management L.P. | 14 574 | 6,47 | 871 | 23,72 | ||||
| 2025-07-24 | 13F | Blair William & Co/il | 3 574 | −39,40 | 214 | −29,70 | ||||
| 2025-07-21 | 13F | Hilltop National Bank | 0 | −100,00 | 0 | |||||
| 2025-04-28 | 13F | Mainstream Capital Management LLC | 0 | −100,00 | 0 | |||||
| 2025-08-14 | 13F | Mercer Global Advisors Inc /adv | 81 857 | −1,22 | 4 893 | 14,67 | ||||
| 2025-08-04 | 13F | Spire Wealth Management | 9 277 | −2,66 | 555 | 13,06 | ||||
| 2025-08-19 | 13F | Newbridge Financial Services Group, Inc. | 151 | 0,00 | 9 | 28,57 | ||||
| 2025-07-22 | 13F | Valley National Advisers Inc | 210 | 0,00 | 0 | |||||
| 2025-08-07 | 13F | LFA - Lugano Financial Advisors SA | 0 | −100,00 | 0 | |||||
| 2025-04-25 | 13F | New Wave Wealth Advisors Llc | 0 | −100,00 | 0 | |||||
| 2025-07-15 | 13F | Cranbrook Wealth Management, LLC | 323 | 0,00 | 19 | 18,75 | ||||
| 2025-07-22 | 13F | Cedar Mountain Advisors, LLC | 211 | 0,00 | 13 | 20,00 | ||||
| 2025-08-14 | 13F | Banque Transatlantique SA | 1 576 | −22,90 | 93 | −10,58 | ||||
| 2025-07-10 | 13F | Tompkins Financial Corp | 0 | −100,00 | 0 | |||||
| 2025-08-04 | 13F | Assetmark, Inc | 74 | 4 | ||||||
| 2025-07-16 | 13F | TOWER TRUST & INVESTMENT Co | 325 | 0,00 | 19 | 18,75 | ||||
| 2025-07-31 | 13F | Ssa Swiss Advisors Ag | 1 500 | −53,56 | 95 | −42,77 | ||||
| 2025-09-11 | 13F | Milestones Private Investment Advisors LLC | 7 305 | 437 | ||||||
| 2025-07-24 | 13F | Costello Asset Management, INC | 325 | 0,00 | 19 | 18,75 | ||||
| 2025-07-15 | 13F | James J. Burns & Company, LLC | 9 478 | −10,35 | 567 | 4,04 | ||||
| 2025-07-29 | 13F | Primoris Wealth Advisors, Llc | 0 | −100,00 | 0 | |||||
| 2025-08-01 | 13F | Solstein Capital, LLC | 1 175 | 0,00 | 70 | 16,67 | ||||
| 2025-08-13 | 13F | Russell Investments Group, Ltd. | 96 | 0,00 | 6 | 25,00 | ||||
| 2025-08-07 | 13F | LOM Asset Management Ltd | 550 | 0 | ||||||
| 2025-07-25 | 13F | SPC Financial, Inc. | 15 274 | −1,99 | 913 | 13,84 | ||||
| 2025-08-13 | 13F | Continuum Advisory, LLC | 0 | −100,00 | 0 | |||||
| 2025-07-28 | 13F | BRYN MAWR TRUST Co | 3 406 | 0,00 | 204 | 16,00 | ||||
| 2025-08-14 | 13F | Colony Group, LLC | 36 687 | −0,56 | 2 193 | 15,42 | ||||
| 2025-08-08 | 13F | Larson Financial Group LLC | 300 | 0,00 | 18 | 13,33 | ||||
| 2025-07-09 | 13F | Bank of New Hampshire | 305 | −10,29 | 18 | 5,88 | ||||
| 2025-07-23 | 13F | Prime Capital Investment Advisors, LLC | 0 | −100,00 | 0 | |||||
| 2025-08-05 | 13F | Westside Investment Management, Inc. | 100 | 0,00 | 6 | 0,00 | ||||
| 2025-08-12 | 13F | Atlas Capital Advisors Llc | 0 | −100,00 | 0 | |||||
| 2025-07-18 | 13F | Union Bancaire Privee, UBP SA | 0 | −100,00 | 0 | |||||
| 2025-08-11 | 13F | Strategic Wealth Partners, Ltd. | 600 | 36 | ||||||
| 2025-08-15 | 13F | Equitable Holdings, Inc. | 13 223 | 4,52 | 790 | 21,35 | ||||
| 2025-07-24 | 13F | Us Bancorp \de\ | 1 514 | −35,24 | 91 | −25,00 | ||||
| 2025-08-11 | 13F | Advisor Resource Council | 0 | −100,00 | 0 | |||||
| 2025-07-25 | 13F | Ellis Investment Partners, LLC | 4 540 | 0,00 | 271 | 16,31 | ||||
| 2025-08-06 | 13F | New Millennium Group LLC | 100 | 6 | ||||||
| 2025-08-15 | 13F | Captrust Financial Advisors | 22 778 | 6,38 | 1 362 | 23,50 | ||||
| 2025-08-12 | 13F | Bank OZK | 23 979 | −1,25 | 1 433 | 14,64 | ||||
| 2025-08-14 | 13F | Glen Eagle Advisors, LLC | 60 | 0,00 | 4 | 0,00 | ||||
| 2025-08-08 | 13F | Wiser Advisor Group LLC | 0 | −100,00 | 0 | |||||
| 2025-04-24 | 13F | Crescent Grove Advisors, LLC | 0 | −100,00 | 0 | |||||
| 2025-08-01 | 13F | Brookwood Investment Group LLC | 18 850 | 23,49 | 1 127 | 43,26 | ||||
| 2025-08-14 | 13F | D. E. Shaw & Co., Inc. | 7 358 | 0,00 | 440 | 16,14 | ||||
| 2025-08-06 | 13F | Ethos Financial Group, LLC | 4 237 | 0,00 | 253 | 16,06 | ||||
| 2025-08-14 | 13F | EP Wealth Advisors, Inc. | 6 077 | 363 | ||||||
| 2025-08-15 | 13F | Morgan Stanley | 487 383 | −6,28 | 29 136 | 8,79 | ||||
| 2025-07-28 | 13F | Duncker Streett & Co Inc | 340 | 20 | ||||||
| 2025-08-11 | 13F | TD Waterhouse Canada Inc. | 2 620 | 0,00 | 156 | 16,42 | ||||
| 2025-08-05 | 13F | Carmel Capital Management L.L.C. | 97 890 | −0,08 | 5 852 | 15,98 | ||||
| 2025-04-11 | 13F | Insight Advisors, LLC/ PA | 0 | −100,00 | 0 | |||||
| 2025-08-05 | 13F | Prosperity Consulting Group, LLC | 8 513 | −0,53 | 509 | 15,45 | ||||
| 2025-08-14 | 13F | Citadel Advisors Llc | Put | 0 | −100,00 | 0 | ||||
| 2025-07-09 | 13F | Key Client Fiduciary Advisors, LLC | 5 370 | 0,00 | 321 | 16,30 | ||||
| 2025-08-15 | 13F | CI Private Wealth, LLC | 189 915 | −1,95 | 11 353 | 13,83 | ||||
| 2025-07-15 | 13F | North Star Investment Management Corp. | 4 350 | 0,00 | 260 | 16,07 | ||||
| 2025-08-07 | 13F | Resources Investment Advisors, LLC. | 45 994 | −4,42 | 2 750 | 10,94 | ||||
| 2025-08-05 | 13F | Huntington National Bank | 31 | |||||||
| 2025-08-13 | 13F | Beacon Pointe Advisors, LLC | 40 036 | −6,32 | 2 393 | 8,77 | ||||
| 2025-07-16 | 13F | Rainier Family Wealth Inc | 23 229 | 1 389 | ||||||
| 2025-05-14 | 13F | Oarsman Capital, Inc. | 0 | −100,00 | 0 | |||||
| 2025-08-08 | 13F | Creative Planning | 14 240 | 7,29 | 851 | 24,60 | ||||
| 2025-08-11 | 13F | HighTower Advisors, LLC | 15 443 | −1,83 | 923 | 13,95 | ||||
| 2025-07-30 | 13F | Pittenger & Anderson Inc | 875 | 0,00 | 52 | 15,56 | ||||
| 2025-08-11 | 13F | Private Advisor Group, LLC | 18 980 | 11,22 | 1 135 | 29,16 | ||||
| 2025-07-31 | 13F | Burke & Herbert Bank & Trust Co | 17 831 | −1,36 | 1 066 | 14,52 | ||||
| 2025-08-12 | 13F | SRS Capital Advisors, Inc. | 380 | 0,00 | 23 | 15,79 | ||||
| 2025-08-12 | 13F | MAI Capital Management | 1 290 | 0,00 | 77 | 16,67 | ||||
| 2025-08-14 | 13F | Federation des caisses Desjardins du Quebec | 1 915 | 0,00 | 114 | 16,33 | ||||
| 2025-08-14 | 13F | Mml Investors Services, Llc | 11 127 | −18,19 | 1 | |||||
| 2025-08-05 | 13F | GPS Wealth Strategies Group, LLC | 102 | 0,00 | 6 | 20,00 | ||||
| 2025-07-16 | 13F | Signaturefd, Llc | 222 | 62,04 | 13 | 85,71 | ||||
| 2025-08-15 | 13F | Kestra Advisory Services, LLC | 13 448 | 19,44 | 804 | 38,69 | ||||
| 2025-08-01 | 13F | GoalVest Advisory LLC | 491 | 0,00 | 29 | 16,00 | ||||
| 2025-08-14 | 13F | Main Street Financial Solutions, LLC | 22 073 | 0,56 | 1 320 | 16,73 | ||||
| 2025-05-14 | 13F | Smartleaf Asset Management LLC | 0 | −100,00 | 0 | |||||
| 2025-08-05 | 13F | American Institute for Advanced Investment Management, LLP | 0 | −100,00 | 0 | |||||
| 2025-07-11 | 13F | Farther Finance Advisors, LLC | 3 878 | 2,35 | 232 | 18,46 | ||||
| 2025-08-01 | 13F | Bessemer Group Inc | 12 940 | 0,00 | 1 | |||||
| 2025-08-14 | 13F | GWM Advisors LLC | 1 491 | −76,85 | 89 | −73,11 | ||||
| 2025-04-21 | 13F | Means Investment Co., Inc. | 0 | −100,00 | 0 | |||||
| 2025-08-11 | 13F | Principal Securities, Inc. | 62 435 | −37,92 | 3 732 | −34,03 | ||||
| 2025-04-22 | 13F | Castleview Partners, Llc | 0 | −100,00 | 0 | |||||
| 2025-08-11 | 13F | Anfield Capital Management, LLC | 133 | 0,00 | 8 | 16,67 | ||||
| 2025-07-07 | 13F | Wilson & Boucher Capital Management, LLC | 3 775 | 226 | ||||||
| 2025-08-11 | 13F | FSA Wealth Management LLC | 224 | 409,09 | 13 | 550,00 | ||||
| 2025-08-14 | 13F | Manufacturers Life Insurance Company, The | 0 | −100,00 | 0 | |||||
| 2025-07-17 | 13F | Sound Income Strategies, LLC | 39 | −61,00 | 2 | −60,00 | ||||
| 2025-08-13 | 13F | Fort Sheridan Advisors Llc | 5 222 | 0,00 | 312 | 16,42 | ||||
| 2025-08-08 | 13F | Citizens Financial Group Inc/ri | 5 102 | 0,00 | 305 | 16,03 | ||||
| 2025-08-12 | 13F | Prudential Plc | 28 440 | 17,81 | 1 700 | 36,77 | ||||
| 2025-07-17 | 13F | BFI Infinity Ltd. | 0 | −100,00 | 0 | |||||
| 2025-08-29 | 13F | Total Investment Management Inc | 1 100 | 66 | ||||||
| 2025-08-05 | 13F | Fourth Dimension Wealth, LLC | 64 | 0,00 | 4 | 0,00 | ||||
| 2025-08-14 | 13F | Hrt Financial Lp | 0 | −100,00 | 0 | |||||
| 2025-08-12 | 13F | LPL Financial LLC | 300 655 | 4,09 | 17 973 | 20,83 | ||||
| 2025-08-11 | 13F | Citigroup Inc | 40 120 | −5,70 | 2 398 | 9,45 | ||||
| 2025-08-12 | 13F | Proequities, Inc. | 0 | 0 | ||||||
| 2025-08-14 | 13F | Susquehanna International Group, Llp | Call | 18 300 | 306,67 | 1 094 | 373,16 | |||
| 2025-08-13 | 13F | Greenwich Wealth Management LLC | 7 939 | 0,00 | 0 | |||||
| 2025-08-06 | 13F | Atlantic Union Bankshares Corp | 123 | 7 | ||||||
| 2025-08-06 | 13F | Commonwealth Equity Services, Llc | 99 823 | −5,36 | 6 | 0,00 | ||||
| 2025-07-29 | 13F | Curbstone Financial Management Corp | 20 780 | 0,00 | 1 242 | 16,07 | ||||
| 2025-08-07 | 13F | CENTRAL TRUST Co | 1 000 | −6,98 | 60 | 7,27 | ||||
| 2025-08-13 | 13F | Safe Harbor Fiduciary, LLC | 200 | 12 | ||||||
| 2025-07-14 | 13F | UMA Financial Services, Inc. | 1 250 | 0,00 | 75 | 15,63 | ||||
| 2025-08-04 | 13F | Pinnacle Associates Ltd | 45 203 | −8,30 | 2 702 | 6,46 | ||||
| 2025-04-16 | 13F | Wealth Enhancement Advisory Services, Llc | 0 | −100,00 | 0 | |||||
| 2025-07-18 | 13F | PFG Investments, LLC | 3 918 | 234 | ||||||
| 2025-08-14 | 13F | IHT Wealth Management, LLC | 9 397 | −8,38 | 562 | 6,25 | ||||
| 2025-07-31 | 13F | AlTi Global, Inc. | 5 665 | 0,00 | 339 | 16,15 | ||||
| 2025-08-04 | 13F | Roble, Belko & Company, Inc | 87 | 0 | ||||||
| 2025-07-23 | 13F | Bellevue Asset Management, Llc | 517 | 0,00 | 31 | 15,38 | ||||
| 2025-08-12 | 13F | Jpmorgan Chase & Co | 6 006 | 280,85 | 359 | 343,21 | ||||
| 2025-08-14 | 13F | Ameriprise Financial Inc | 129 201 | −9,03 | 7 724 | 5,59 | ||||
| 2025-07-14 | 13F | Pacifica Partners Inc. | 158 | 0,00 | 9 | 28,57 | ||||
| 2025-08-07 | 13F | Flagship Wealth Advisors, Llc | 188 | 0,00 | 11 | 22,22 | ||||
| 2025-08-07 | 13F | Fountainhead AM, LLC | 262 578 | −19,24 | 15 697 | −6,26 | ||||
| 2025-08-08 | 13F | Fortis Group Advisors, LLC | 502 | 0,00 | 30 | 20,00 | ||||
| 2025-08-19 | 13F | Anchor Investment Management, LLC | 50 | 0,00 | 3 | 0,00 | ||||
| 2025-07-07 | 13F | Trust Co | 79 | −1,25 | 5 | 0,00 | ||||
| 2025-08-13 | 13F | Northwestern Mutual Wealth Management Co | 88 367 | −7,92 | 5 283 | 6,88 | ||||
| 2025-07-22 | 13F | Berkshire Money Management, Inc. | 575 | 34 | ||||||
| 2025-07-22 | 13F | USAdvisors Wealth Management, LLC | 0 | −100,00 | 0 | |||||
| 2025-08-07 | 13F | Pinnacle Wealth Management Advisory Group, LLC | 10 470 | −26,85 | 626 | −15,20 | ||||
| 2025-08-18 | 13F/A | National Bank Of Canada /fi/ | 77 541 | −0,72 | 4 626 | 14,99 | ||||
| 2025-04-23 | 13F | Perigon Wealth Management, LLC | 0 | −100,00 | 0 | |||||
| 2025-07-29 | 13F | Creekside Partners | 7 110 | 0,00 | 425 | 16,12 | ||||
| 2025-08-01 | 13F | Biltmore Family Office, LLC | 201 327 | −1,07 | 12 035 | 14,84 | ||||
| 2025-07-21 | 13F | Ameritas Advisory Services, LLC | 194 | 12 | ||||||
| 2025-08-13 | 13F | Baird Financial Group, Inc. | 6 370 | −15,10 | 381 | −1,55 | ||||
| 2025-08-13 | 13F | Solutions 4 Wealth, Ltd | 18 024 | 3,15 | 1 077 | 19,80 | ||||
| 2025-08-14 | 13F | Comerica Bank | 4 815 | 0,04 | 288 | 16,19 | ||||
| 2025-08-01 | 13F | Envestnet Asset Management Inc | 97 458 | 7,02 | 5 826 | 24,22 | ||||
| 2025-07-08 | 13F | Silverleafe Capital Partners, LLC | 0 | −100,00 | 0 | |||||
| 2025-08-14 | 13F | Humankind Investments LLC | 41 500 | 0,00 | 2 481 | 16,05 | ||||
| 2025-04-09 | 13F | Fiduciary Alliance LLC | 0 | −100,00 | 0 | |||||
| 2025-08-14 | 13F | Mariner, LLC | 3 909 | −0,41 | 234 | 15,35 |