Grundläggande statistik
| Institutionella ägare | 135 total, 135 long only, 0 short only, 0 long/short - change of 4,65% MRQ |
| Genomsnittlig portföljallokering | 0.1022 % - change of −8,51% MRQ |
| Institutionella aktier (lång) | 9 193 342 (ex 13D/G) - change of 0,40MM shares 4,50% MRQ |
| Institutionellt värde (lång) | $ 203 055 USD ($1000) |
Institutionellt ägande och aktieägare
Cohen & Steers REIT and Preferred Income Fund, Inc. (US:RNP) har 135 Institutionella ägare och aktieägare som har lämnat in 13D/G- eller 13F-formulär till Securities Exchange Commission (SEC). Dessa institut innehar totalt 9,193,342 aktier. Största aktieägare inkluderar Morgan Stanley, Ellis Investment Partners, LLC, LPL Financial LLC, Raymond James Financial Inc, Ameriprise Financial Inc, Bank Of America Corp /de/, Wells Fargo & Company/mn, XML Financial, LLC, Royal Bank Of Canada, and UBS Group AG .
Cohen & Steers REIT and Preferred Income Fund, Inc. (NYSE:RNP) Institutionell ägarstruktur visar institutioners och fonders nuvarande positioner i företaget, samt de senaste förändringarna i positionernas storlek. Större aktieägare kan vara enskilda investerare, fonder, hedgefonder eller institutioner. Bilaga 13D visar att investeraren äger (eller ägde) mer än 5% av företaget och avser (eller avsåg) att aktivt eftersträva en förändring av affärsstrategin. Schedule 13G indikerar en passiv investering på över 5%.
The share price as of September 10, 2025 is 22,16 / share. Previously, on September 11, 2024, the share price was 23,74 / share. This represents a decline of 6,66% over that period.

Fondsentimentets poäng
Fondsentimentet poängen(fka Ägarackumulation-poäng) visar vilka aktier som är mest köpta av fonder. Det är resultatet av en sofistikerad kvantitativ flerfaktormodell som identifierar företag med de högsta nivåerna av institutionell ackumulering. Poängsättningsmodellen använder en kombination av den totala ökningen av redovisade ägare, förändringarna i portföljallokeringarna för dessa ägare och andra mått. Siffran sträcker sig från 0 till 100, där högre siffror indikerar en högre nivå av ackumulering i förhållande till sina konkurrenter, och 50 är genomsnittet.
Uppdateringsfrekvens: Dagligen
Se Ownership Explorer, som innehåller en lista över de högst rankade företagen.
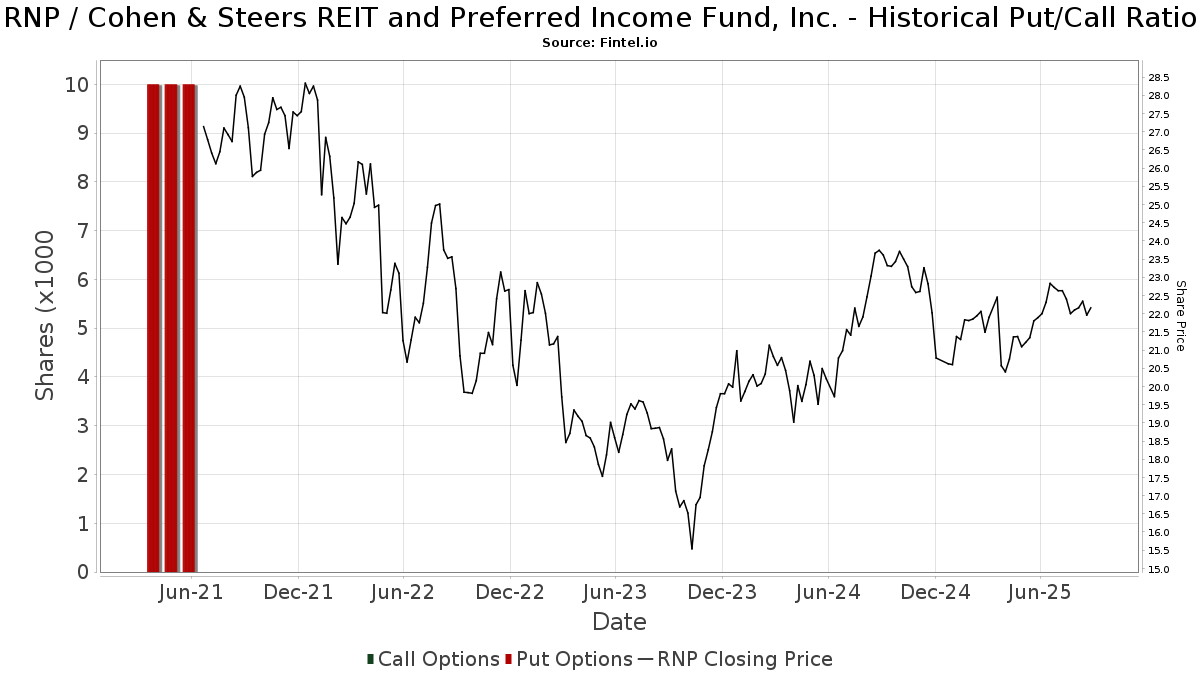
Institutionell sälj/köp-kvot
Förutom att rapportera vanliga eget kapital- och skuldemissioner måste institutioner med mer än 100MM tillgångar under förvaltning också avslöja sina innehav av sälj- och köpoptioner. Eftersom säljoptioner i allmänhet indikerar ett negativt sentiment och köpoptioner indikerar ett positivt sentiment, kan vi få en uppfattning om det övergripande institutionella sentimentet genom att plotta förhållandet mellan säljoptioner och köpoptioner. Diagrammet till höger visar det historiska förhållandet mellan sälj- och köpoptioner för detta instrument.
Genom att använda sälj/köp-kvoten som en indikator på aktieägarnas sentiment undviker man en av de största bristerna med att använda det totala institutionella ägandet, nämligen att en betydande del av de förvaltade tillgångarna investeras passivt för att följa index. Passivt förvaltade fonder köper vanligtvis inte optioner, så indikatorn för sälj/köp-kvoten ger en bättre bild av stämningen i aktivt förvaltade fonder.
13F- och NPORT-arkiveringar
Detaljer om 13F-arkiveringar är gratis. Detaljer om NP-arkiveringar kräver ett premiummedlemskap. Gröna rader indikerar nya positioner. Röda rader indikerar stängda positioner. Klicka på länk symbolen för att se hela transaktionshistoriken.
Uppgradera
för att låsa upp premiumdata och exportera till Excel ![]() .
.
| Fil Datum | Källa | Investerare | Typ | Genomsnittligt pris (beräknat) |
Aktier | Δ Aktier (%) |
Rapporterat värde (1000 USD) |
Δ Värde (%) |
Portföljallokering (%) |
|
|---|---|---|---|---|---|---|---|---|---|---|
| 2025-08-11 | 13F | TD Waterhouse Canada Inc. | 5 000 | 0,00 | 114 | 3,67 | ||||
| 2025-07-30 | 13F | D.a. Davidson & Co. | 10 754 | 4,88 | 245 | 7,96 | ||||
| 2025-07-29 | 13F | Koshinski Asset Management, Inc. | 79 709 | 8,80 | 1 815 | 12,25 | ||||
| 2025-08-14 | 13F | Mml Investors Services, Llc | 9 053 | −71,52 | 0 | −100,00 | ||||
| 2025-04-21 | 13F | Nelson, Van Denburg & Campbell Wealth Management Group, LLC | 0 | −100,00 | 0 | |||||
| 2025-07-17 | 13F | Janney Montgomery Scott LLC | 15 103 | 0,07 | 0 | |||||
| 2025-07-18 | 13F | Bartlett & Co. Wealth Management Llc | 48 535 | 1,36 | 1 105 | 4,64 | ||||
| 2025-08-11 | 13F | Shufro Rose & Co Llc | 49 300 | −1,00 | 1 088 | −1,00 | ||||
| 2025-08-08 | 13F | Islay Capital Management, Llc | 3 000 | 0,00 | 68 | 3,03 | ||||
| 2025-08-04 | 13F | JDM Financial Group LLC | 482 | 0,00 | 11 | 0,00 | ||||
| 2025-08-14 | 13F | Comerica Bank | 16 444 | 0,04 | 374 | 3,31 | ||||
| 2025-07-21 | 13F | Ameritas Advisory Services, LLC | 10 725 | 244 | ||||||
| 2025-08-18 | 13F | Geneos Wealth Management Inc. | 4 946 | 1,87 | 113 | 4,67 | ||||
| 2025-07-08 | 13F | Parallel Advisors, LLC | 3 | 0,00 | 0 | |||||
| 2025-07-31 | 13F | Hartford Financial Management Inc. | 444 | 0,00 | 10 | 11,11 | ||||
| 2025-07-31 | 13F | Moloney Securities Asset Management, LLC | 18 740 | 2,11 | 427 | 5,19 | ||||
| 2025-08-08 | 13F | Cetera Investment Advisers | 152 306 | 0,06 | 3 468 | 3,25 | ||||
| 2025-08-14 | 13F | Wiley Bros.-aintree Capital, Llc | 35 577 | 7,26 | 810 | 11,42 | ||||
| 2025-08-12 | 13F | Jpmorgan Chase & Co | 664 | 15 | ||||||
| 2025-07-25 | 13F | Atria Wealth Solutions, Inc. | 0 | −100,00 | 0 | |||||
| 2025-04-29 | 13F | Lee Danner & Bass Inc | 0 | −100,00 | 0 | −100,00 | ||||
| 2025-08-14 | 13F | IHT Wealth Management, LLC | 9 348 | −4,50 | 213 | −1,85 | ||||
| 2025-08-07 | 13F | Samalin Investment Counsel, LLC | 45 167 | 4,09 | 1 028 | 7,42 | ||||
| 2025-07-25 | 13F | Ellis Investment Partners, LLC | 1 199 662 | 0,23 | 27 316 | 3,41 | ||||
| 2025-08-06 | 13F | Commonwealth Equity Services, Llc | 187 384 | 13,28 | 4 | 33,33 | ||||
| 2025-07-25 | NP | FCEF - First Trust CEF Income Opportunity ETF This fund is a listed as child fund of First Trust Advisors Lp and if that institution has disclosed ownership in this security, then these positions will not be double counted when calculating total shares and total value | 52 230 | 4,77 | 1 135 | 1,89 | ||||
| 2025-08-13 | 13F | Johnson Financial Group, Inc. | 155 793 | −2,25 | 3 547 | 0,85 | ||||
| 2025-08-12 | 13F | Wealthbridge Capital Management, Llc | 21 950 | 3,54 | 500 | 6,85 | ||||
| 2025-07-18 | 13F | Consolidated Portfolio Review Corp | 113 031 | 15,17 | 2 574 | 18,79 | ||||
| 2025-08-12 | 13F | Advisors Asset Management, Inc. | 43 538 | −0,31 | 991 | 2,91 | ||||
| 2025-08-07 | 13F | Hennion & Walsh Asset Management, Inc. | 99 402 | 52,07 | 2 263 | 56,93 | ||||
| 2025-08-12 | 13F | Manchester Capital Management LLC | 4 000 | 0,00 | 91 | 3,41 | ||||
| 2025-08-12 | 13F | Insigneo Advisory Services, Llc | 23 800 | 0,00 | 542 | 3,05 | ||||
| 2025-07-17 | 13F | Venture Visionary Partners LLC | 86 467 | 8,98 | 1 969 | 12,39 | ||||
| 2025-08-08 | 13F | Fortis Group Advisors, LLC | 600 | 0,00 | 14 | 0,00 | ||||
| 2025-07-15 | 13F | Fifth Third Bancorp | 9 000 | 0,00 | 205 | 3,03 | ||||
| 2025-07-15 | 13F | Main Street Group, LTD | 1 040 | 0,00 | 24 | 4,55 | ||||
| 2025-08-19 | 13F | Advisory Services Network, LLC | 11 833 | 0,31 | 264 | 1,15 | ||||
| 2025-05-22 | NP | Cornerstone Total Return Fund Inc | 13 494 | −76,63 | 298 | −75,37 | ||||
| 2025-08-15 | 13F | Morgan Stanley | 1 300 655 | −0,18 | 29 616 | 2,98 | ||||
| 2025-08-11 | 13F | Principal Securities, Inc. | 228 | 5 | ||||||
| 2025-07-16 | 13F | American National Bank | 218 | 0,00 | 5 | 0,00 | ||||
| 2025-05-06 | 13F | Readystate Asset Management Lp | 0 | −100,00 | 0 | −100,00 | ||||
| 2025-05-22 | NP | Cornerstone Strategic Value Fund Inc | 62 948 | 415,08 | 1 389 | 444,71 | ||||
| 2025-05-13 | 13F | Elequin Capital Lp | 0 | −100,00 | 0 | |||||
| 2025-08-13 | 13F | Invesco Ltd. | 22 867 | −18,58 | 521 | −15,99 | ||||
| 2025-08-12 | 13F | CIBC Private Wealth Group, LLC | 3 | 200,00 | 0 | |||||
| 2025-07-30 | 13F | Bogart Wealth, LLC | 560 | 0,00 | 13 | 0,00 | ||||
| 2025-05-16 | 13F | McIlrath & Eck, LLC | 0 | −100,00 | 0 | |||||
| 2025-08-18 | 13F | Hollencrest Capital Management | 10 | 0,00 | 0 | |||||
| 2025-08-15 | 13F | Provenance Wealth Advisors, LLC | 0 | −100,00 | 0 | −100,00 | ||||
| 2025-08-11 | 13F | Private Advisor Group, LLC | 35 024 | −3,22 | 798 | −0,13 | ||||
| 2025-07-18 | 13F | SOA Wealth Advisors, LLC. | 0 | −100,00 | 0 | |||||
| 2025-08-15 | 13F | Tower Research Capital LLC (TRC) | 2 | 0,00 | 0 | |||||
| 2025-04-28 | 13F | Strategic Financial Concepts, LLC | 0 | −100,00 | 0 | −100,00 | ||||
| 2025-08-19 | 13F | Cape Investment Advisory, Inc. | 600 | 0,00 | 14 | 0,00 | ||||
| 2025-05-19 | 13F | Smith Asset Management Co., LLC | 24 683 | 23,55 | 545 | 30,46 | ||||
| 2025-07-11 | 13F | SILVER OAK SECURITIES, Inc | 12 700 | 289 | ||||||
| 2025-07-31 | 13F | Cambridge Investment Research Advisors, Inc. | 49 782 | −0,85 | 1 | 0,00 | ||||
| 2025-08-14 | 13F | Bank Of America Corp /de/ | 580 077 | −0,66 | 13 208 | 2,49 | ||||
| 2025-05-14 | 13F | Landscape Capital Management, L.l.c. | 0 | −100,00 | 0 | |||||
| 2025-07-29 | 13F | Private Trust Co Na | 7 219 | 0,00 | 164 | 3,14 | ||||
| 2025-08-14 | 13F | Ameriprise Financial Inc | 592 522 | 34,90 | 13 491 | 39,12 | ||||
| 2025-07-21 | 13F | Investment Planning Advisors, Inc. | 15 339 | −34,69 | 349 | −32,63 | ||||
| 2025-08-29 | 13F | Total Investment Management Inc | 64 | 1 | ||||||
| 2025-07-24 | 13F | Capital Advisors, Ltd. LLC | 1 987 | 0,00 | 0 | |||||
| 2025-09-04 | 13F/A | Advisor Group Holdings, Inc. | 117 179 | 16,99 | 2 669 | 20,72 | ||||
| 2025-07-17 | 13F/A | Capital Investment Advisors, LLC | 50 274 | −4,88 | 1 145 | −1,89 | ||||
| 2025-08-13 | 13F | Northwestern Mutual Wealth Management Co | 15 007 | −1,22 | 342 | 1,79 | ||||
| 2025-09-09 | 13F | NWF Advisory Services Inc. | 9 902 | 0,00 | 225 | 3,21 | ||||
| 2025-07-25 | 13F | Hazlett, Burt & Watson, Inc. | 213 | 1,91 | 0 | |||||
| 2025-07-10 | 13F | Kozak & Associates, Inc. | 466 | 11 | ||||||
| 2025-08-13 | 13F | Northern Trust Corp | 16 613 | 0,33 | 378 | 3,56 | ||||
| 2025-08-12 | 13F | MAI Capital Management | 4 045 | 0,00 | 92 | 3,37 | ||||
| 2025-08-08 | 13F | Larson Financial Group LLC | 0 | −100,00 | 0 | |||||
| 2025-08-14 | 13F | UBS Group AG | 272 574 | 2,98 | 6 207 | 6,25 | ||||
| 2025-08-12 | 13F | Steward Partners Investment Advisory, Llc | 30 125 | 4,42 | 686 | 7,70 | ||||
| 2025-07-17 | 13F | Camelot Portfolios, LLC | 23 096 | −4,79 | 526 | −1,87 | ||||
| 2025-07-24 | 13F | Us Bancorp \de\ | 1 261 | −90,04 | 29 | −89,96 | ||||
| 2025-08-14 | 13F | Modern Wealth Management, LLC | 9 520 | −26,88 | 217 | −24,74 | ||||
| 2025-07-15 | 13F | Oregon Pacific Wealth Management, LLC | 14 400 | −3,88 | 328 | −0,91 | ||||
| 2025-07-07 | 13F | RB Capital Management, LLC | 22 783 | −4,14 | 519 | −1,15 | ||||
| 2025-08-14 | 13F | Sunbelt Securities, Inc. | 150 | 0,00 | 3 | 0,00 | ||||
| 2025-07-21 | 13F | Ameriflex Group, Inc. | 1 469 | 0,00 | 33 | 0,00 | ||||
| 2025-07-11 | 13F | Caldwell Securities, Inc | 3 000 | 0,00 | 68 | 3,03 | ||||
| 2025-05-08 | 13F | We Are One Seven, LLC | 0 | −100,00 | 0 | |||||
| 2025-08-14 | 13F | Beaird Harris Wealth Management, LLC | 300 | 0,00 | 7 | 0,00 | ||||
| 2025-08-01 | 13F | Envestnet Asset Management Inc | 14 519 | −16,57 | 331 | −14,06 | ||||
| 2025-08-15 | 13F | Kestra Advisory Services, LLC | 49 554 | 3,90 | 1 128 | 7,22 | ||||
| 2025-07-21 | 13F | Future Financial Wealth Managment LLC | 0 | −100,00 | 0 | |||||
| 2025-07-28 | 13F | Harbour Investments, Inc. | 119 704 | 40,57 | 2 726 | 45,02 | ||||
| 2025-04-18 | 13F | JP Wealth Management, Inc. | 0 | −100,00 | 0 | |||||
| 2025-07-22 | 13F | DAVENPORT & Co LLC | 15 686 | 0,00 | 357 | 3,18 | ||||
| 2025-07-24 | 13F | Ronald Blue Trust, Inc. | 257 | 6 | ||||||
| 2025-08-04 | 13F | Spire Wealth Management | 6 115 | 1,88 | 139 | 5,30 | ||||
| 2025-08-19 | 13F | Campbell Capital Management Inc | 59 139 | −3,27 | 1 347 | −0,22 | ||||
| 2025-07-25 | 13F | Cwm, Llc | 2 983 | −29,93 | 0 | |||||
| 2025-08-13 | 13F | Jones Financial Companies Lllp | 35 | −98,25 | 1 | −100,00 | ||||
| 2025-05-15 | 13F | WPG Advisers, LLC | 0 | −100,00 | 0 | −100,00 | ||||
| 2025-08-06 | 13F | Atlantic Union Bankshares Corp | 48 934 | −7,73 | 1 114 | −4,79 | ||||
| 2025-08-14 | 13F | Royal Bank Of Canada | 310 099 | 3,57 | 7 060 | 6,84 | ||||
| 2025-08-08 | 13F | Pnc Financial Services Group, Inc. | 13 789 | −14,30 | 314 | −11,83 | ||||
| 2025-07-29 | 13F | International Assets Investment Management, Llc | 13 843 | 1,47 | 315 | 4,65 | ||||
| 2025-08-07 | 13F | Parkside Financial Bank & Trust | 2 500 | 0,00 | 57 | 1,82 | ||||
| 2025-07-10 | 13F | Wealth Enhancement Advisory Services, Llc | 19 540 | 31,83 | 447 | 36,39 | ||||
| 2025-08-07 | 13F | Lakeridge Wealth Management LLC | 9 770 | 0,00 | 222 | 3,26 | ||||
| 2025-08-14 | 13F | Colony Group, LLC | 19 784 | −1,97 | 450 | 1,12 | ||||
| 2025-07-10 | 13F | Secure Asset Management, LLC | 25 143 | 0,13 | 572 | 3,25 | ||||
| 2025-08-07 | 13F | McClarren Financial Advisors, Inc. | 0 | −100,00 | 0 | |||||
| 2025-08-05 | 13F | NewSquare Capital LLC | 1 500 | 0,00 | 34 | 3,03 | ||||
| 2025-08-08 | 13F | Cornerstone Advisors, LLC | 0 | −100,00 | 0 | |||||
| 2025-08-12 | 13F | LPL Financial LLC | 818 404 | 6,89 | 18 635 | 10,28 | ||||
| 2025-08-12 | 13F | AlphaCore Capital LLC | 33 997 | 10,06 | 774 | 13,66 | ||||
| 2025-07-07 | 13F | Trust Co | 400 | 0,00 | 9 | 12,50 | ||||
| 2025-05-16 | 13F | Coppell Advisory Solutions LLC | 0 | −100,00 | 0 | |||||
| 2025-08-08 | 13F | Hartland & Co., LLC | 2 000 | 46 | ||||||
| 2025-07-17 | 13F | LexAurum Advisors, LLC | 12 218 | 1,03 | 278 | 4,51 | ||||
| 2025-07-17 | 13F | Wolff Wiese Magana Llc | 28 | 0,00 | 1 | |||||
| 2025-08-12 | 13F | one8zero8, LLC | 11 000 | 0,00 | 250 | 3,31 | ||||
| 2025-08-13 | 13F | EverSource Wealth Advisors, LLC | 2 750 | 0,00 | 63 | 3,33 | ||||
| 2025-08-14 | 13F | Wells Fargo & Company/mn | 383 144 | 4,33 | 8 724 | 7,65 | ||||
| 2025-07-17 | 13F | XML Financial, LLC | 313 706 | 41,72 | 7 143 | 46,22 | ||||
| 2025-08-14 | 13F | GWM Advisors LLC | 818 | 0,00 | 19 | 0,00 | ||||
| 2025-08-14 | 13F | CoreCap Advisors, LLC | 4 155 | −0,02 | 95 | 3,30 | ||||
| 2025-08-12 | 13F | Proequities, Inc. | 0 | 0 | ||||||
| 2025-07-15 | 13F | Wealth Effects Llc | 13 800 | −15,34 | 314 | −12,53 | ||||
| 2025-07-21 | 13F | TFG Advisers LLC | 11 919 | −0,38 | 271 | 2,65 | ||||
| 2025-08-04 | 13F | MeadowBrook Investment Advisors LLC | 0 | −100,00 | 0 | |||||
| 2025-08-11 | 13F | Strategic Wealth Partners, Ltd. | 2 050 | 47 | ||||||
| 2025-08-13 | 13F | First Trust Advisors Lp | 80 097 | −6,24 | 1 824 | −3,29 | ||||
| 2025-08-12 | 13F | Intellus Advisors LLC | 9 721 | 5,22 | 221 | 8,87 | ||||
| 2025-08-07 | 13F | Allworth Financial LP | 2 214 | 330,74 | 50 | 400,00 | ||||
| 2025-05-14 | 13F | Monterey Private Wealth, Inc. | 9 902 | 0,00 | 219 | 5,83 | ||||
| 2025-05-12 | 13F | Wolverine Asset Management Llc | 0 | −100,00 | 0 | |||||
| 2025-07-31 | 13F | West Michigan Advisors, Llc | 15 791 | 0,31 | 360 | 3,46 | ||||
| 2025-08-08 | 13F | Creative Planning | 18 389 | 0,78 | 419 | 3,98 | ||||
| 2025-07-10 | 13F | Exchange Traded Concepts, Llc | 350 | 8 | ||||||
| 2025-07-11 | 13F | Annex Advisory Services, LLC | 8 827 | 201 | ||||||
| 2025-08-12 | 13F | Cornerstone Wealth Management, LLC | 9 244 | −66,62 | 210 | −85,34 | ||||
| 2025-08-11 | 13F | HighTower Advisors, LLC | 25 416 | 38,30 | 579 | 42,72 | ||||
| 2025-07-07 | 13F | Investors Research Corp | 2 200 | 0,00 | 50 | 4,17 | ||||
| 2025-08-08 | 13F | TD Capital Management LLC | 409 | 0,00 | 9 | 0,00 | ||||
| 2025-07-24 | 13F | IFP Advisors, Inc | 259 | 0,00 | 6 | 0,00 | ||||
| 2025-05-14 | 13F | Jane Street Group, Llc | 0 | −100,00 | 0 | |||||
| 2025-07-08 | 13F | Nbc Securities, Inc. | 1 400 | −48,15 | 0 | |||||
| 2025-08-01 | 13F | Oarsman Capital, Inc. | 42 350 | −3,75 | 964 | −0,72 | ||||
| 2025-05-14 | 13F | Van Hulzen Asset Management, LLC | 0 | −100,00 | 0 | −100,00 | ||||
| 2025-07-16 | 13F | Magnus Financial Group LLC | 19 956 | 0,13 | 454 | 3,42 | ||||
| 2025-07-24 | 13F | Costello Asset Management, INC | 416 | 0,00 | 9 | 0,00 | ||||
| 2025-08-14 | 13F | Hurley Capital, LLC | 1 000 | 23 | ||||||
| 2025-08-11 | 13F | Nations Financial Group Inc, /ia/ /adv | 17 649 | −11,02 | 402 | −8,24 | ||||
| 2025-04-01 | 13F/A | Talon Private Wealth, LLC | 0 | −100,00 | 0 | −100,00 | ||||
| 2025-08-13 | 13F | Everstar Asset Management, LLC | 29 260 | −9,86 | 666 | −6,98 | ||||
| 2025-07-30 | 13F | Cullen/frost Bankers, Inc. | 2 709 | 0,00 | 62 | 3,39 | ||||
| 2025-07-14 | 13F | Toth Financial Advisory Corp | 835 | 4,38 | 19 | 11,76 | ||||
| 2025-07-17 | 13F | Sound Income Strategies, LLC | 39 283 | −12,37 | 894 | −9,61 | ||||
| 2025-08-14 | 13F | Mariner, LLC | 10 372 | 7,81 | 236 | 11,32 | ||||
| 2025-08-04 | 13F | HBK Sorce Advisory LLC | 10 687 | 0,07 | 243 | 3,40 | ||||
| 2025-08-14 | 13F | Raymond James Financial Inc | 705 164 | 1,91 | 16 057 | 5,14 |