Grundläggande statistik
| Institutionella ägare | 107 total, 107 long only, 0 short only, 0 long/short - change of −0,93% MRQ |
| Genomsnittlig portföljallokering | 0.1054 % - change of −11,57% MRQ |
| Institutionella aktier (lång) | 1 922 925 (ex 13D/G) - change of −0,41MM shares −17,68% MRQ |
| Institutionellt värde (lång) | $ 89 706 USD ($1000) |
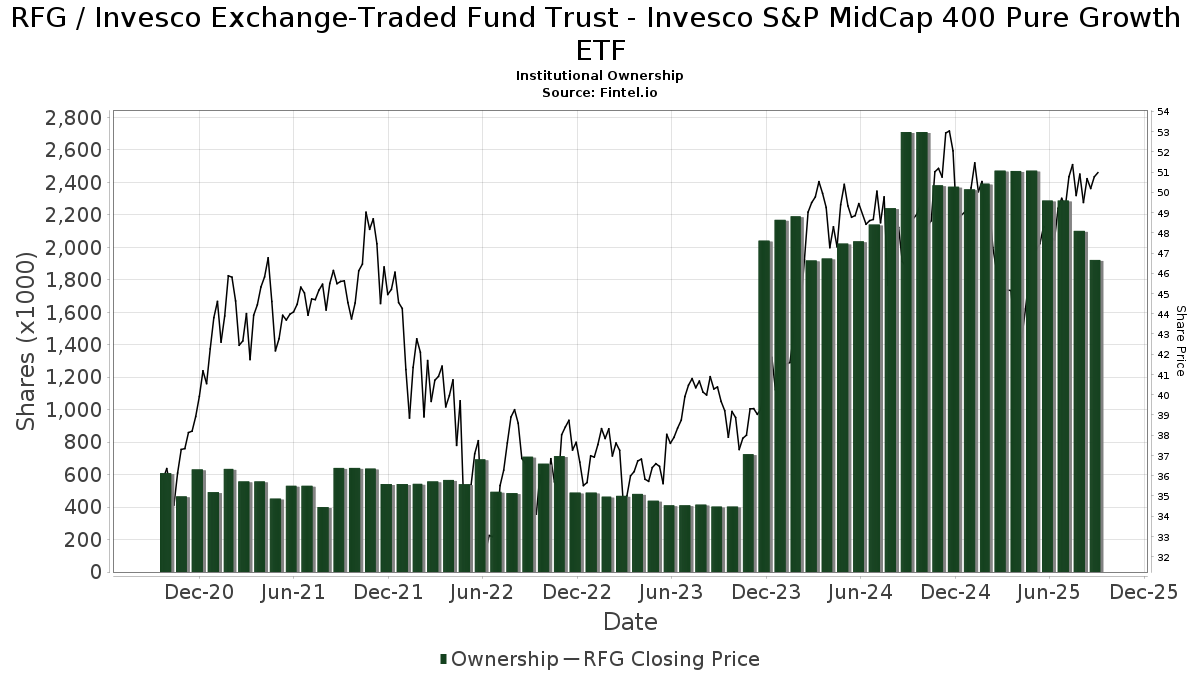
Institutionellt ägande och aktieägare
Invesco Exchange-Traded Fund Trust - Invesco S&P MidCap 400 Pure Growth ETF (US:RFG) har 107 Institutionella ägare och aktieägare som har lämnat in 13D/G- eller 13F-formulär till Securities Exchange Commission (SEC). Dessa institut innehar totalt 1,922,925 aktier. Största aktieägare inkluderar Morgan Stanley, LPL Financial LLC, New England Private Wealth Advisors LLC, Coldstream Capital Management Inc, Twelve Points Wealth Management LLC, Wells Fargo & Company/mn, Northwestern Mutual Wealth Management Co, UBS Group AG, Bank Of America Corp /de/, and Commonwealth Equity Services, Llc .
Invesco Exchange-Traded Fund Trust - Invesco S&P MidCap 400 Pure Growth ETF (ARCA:RFG) Institutionell ägarstruktur visar institutioners och fonders nuvarande positioner i företaget, samt de senaste förändringarna i positionernas storlek. Större aktieägare kan vara enskilda investerare, fonder, hedgefonder eller institutioner. Bilaga 13D visar att investeraren äger (eller ägde) mer än 5% av företaget och avser (eller avsåg) att aktivt eftersträva en förändring av affärsstrategin. Schedule 13G indikerar en passiv investering på över 5%.
The share price as of September 8, 2025 is 51,32 / share. Previously, on September 9, 2024, the share price was 45,79 / share. This represents an increase of 12,08% over that period.
Fondsentimentets poäng
Fondsentimentet poängen(fka Ägarackumulation-poäng) visar vilka aktier som är mest köpta av fonder. Det är resultatet av en sofistikerad kvantitativ flerfaktormodell som identifierar företag med de högsta nivåerna av institutionell ackumulering. Poängsättningsmodellen använder en kombination av den totala ökningen av redovisade ägare, förändringarna i portföljallokeringarna för dessa ägare och andra mått. Siffran sträcker sig från 0 till 100, där högre siffror indikerar en högre nivå av ackumulering i förhållande till sina konkurrenter, och 50 är genomsnittet.
Uppdateringsfrekvens: Dagligen
Se Ownership Explorer, som innehåller en lista över de högst rankade företagen.
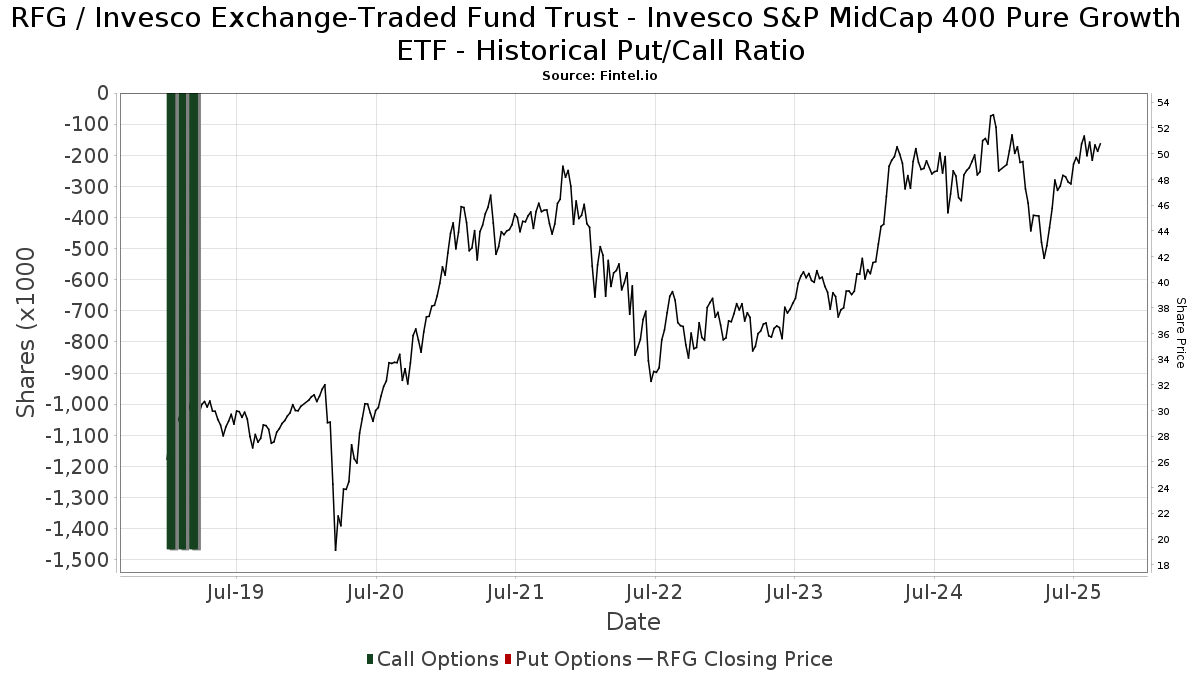
Institutionell sälj/köp-kvot
Förutom att rapportera vanliga eget kapital- och skuldemissioner måste institutioner med mer än 100MM tillgångar under förvaltning också avslöja sina innehav av sälj- och köpoptioner. Eftersom säljoptioner i allmänhet indikerar ett negativt sentiment och köpoptioner indikerar ett positivt sentiment, kan vi få en uppfattning om det övergripande institutionella sentimentet genom att plotta förhållandet mellan säljoptioner och köpoptioner. Diagrammet till höger visar det historiska förhållandet mellan sälj- och köpoptioner för detta instrument.
Genom att använda sälj/köp-kvoten som en indikator på aktieägarnas sentiment undviker man en av de största bristerna med att använda det totala institutionella ägandet, nämligen att en betydande del av de förvaltade tillgångarna investeras passivt för att följa index. Passivt förvaltade fonder köper vanligtvis inte optioner, så indikatorn för sälj/köp-kvoten ger en bättre bild av stämningen i aktivt förvaltade fonder.
13F- och NPORT-arkiveringar
Detaljer om 13F-arkiveringar är gratis. Detaljer om NP-arkiveringar kräver ett premiummedlemskap. Gröna rader indikerar nya positioner. Röda rader indikerar stängda positioner. Klicka på länk symbolen för att se hela transaktionshistoriken.
Uppgradera
för att låsa upp premiumdata och exportera till Excel ![]() .
.
| Fil Datum | Källa | Investerare | Typ | Genomsnittligt pris (beräknat) |
Aktier | Δ Aktier (%) |
Rapporterat värde (1000 USD) |
Δ Värde (%) |
Portföljallokering (%) |
|
|---|---|---|---|---|---|---|---|---|---|---|
| 2025-07-11 | 13F | Arrow Investment Advisors, LLC | 17 680 | −0,12 | 862 | 11,10 | ||||
| 2025-07-30 | 13F | Pacific Sun Financial Corp | 11 705 | 0,00 | 571 | 11,11 | ||||
| 2025-07-07 | 13F | Trust Co | 2 268 | 0,00 | 111 | 11,11 | ||||
| 2025-08-12 | 13F | Founders Financial Alliance, LLC | 192 | 0,00 | 9 | 12,50 | ||||
| 2025-08-14 | 13F | Marshall Investment Management, Llc | 0 | −100,00 | 0 | |||||
| 2025-08-11 | 13F | HighTower Advisors, LLC | 18 453 | −0,96 | 900 | 10,17 | ||||
| 2025-08-14 | 13F | GWM Advisors LLC | 960 | −4,95 | 47 | 4,55 | ||||
| 2025-08-04 | 13F | Assetmark, Inc | 0 | −100,00 | 0 | |||||
| 2025-07-08 | 13F/A | Salem Investment Counselors Inc | 2 500 | 0,00 | 122 | 11,01 | ||||
| 2025-08-14 | 13F | Comerica Bank | 4 850 | 0,00 | 236 | 11,32 | ||||
| 2025-07-30 | 13F/A | KPP Advisory Services LLC | 31 395 | 3,89 | 1 531 | 15,56 | ||||
| 2025-07-24 | 13F | IFP Advisors, Inc | 677 | 0,15 | 33 | 13,79 | ||||
| 2025-08-05 | 13F | GHP Investment Advisors, Inc. | 1 734 | 0,00 | 85 | 12,00 | ||||
| 2025-08-15 | 13F | Kestra Advisory Services, LLC | 14 076 | 0,34 | 686 | 11,73 | ||||
| 2025-08-12 | 13F | PSI Advisors, LLC | 0 | −100,00 | 0 | |||||
| 2025-08-08 | 13F | Ironwood Investment Counsel, LLC | 7 135 | 0,00 | 348 | 11,22 | ||||
| 2025-08-14 | 13F | Goldman Sachs Group Inc | 47 141 | 46,54 | 2 298 | 63,09 | ||||
| 2025-07-21 | 13F | Ameritas Advisory Services, LLC | 45 071 | −25,22 | 2 197 | −24,63 | ||||
| 2025-07-24 | 13F | Blair William & Co/il | 265 | 0,00 | 13 | 9,09 | ||||
| 2025-08-08 | 13F | Glassman Wealth Services | 4 635 | 0,00 | 226 | 10,84 | ||||
| 2025-08-12 | 13F | LPL Financial LLC | 199 499 | −1,06 | 9 726 | 10,05 | ||||
| 2025-08-12 | 13F | Howe & Rusling Inc | 2 650 | 129 | ||||||
| 2025-08-15 | 13F | Equitable Holdings, Inc. | 4 242 | 207 | ||||||
| 2025-08-14 | 13F | Royal Bank Of Canada | 21 546 | −14,90 | 1 051 | −5,32 | ||||
| 2025-08-07 | 13F | Cahill Financial Advisors Inc | 4 920 | 0,00 | 240 | 11,16 | ||||
| 2025-07-25 | 13F | Cwm, Llc | 200 | −25,09 | 0 | |||||
| 2025-07-09 | 13F | Christopher J. Hasenberg, Inc | 260 | −56,95 | 13 | −53,85 | ||||
| 2025-08-04 | 13F | Spire Wealth Management | 3 150 | 0,25 | 154 | 11,68 | ||||
| 2025-08-14 | 13F | Synovus Financial Corp | 8 996 | 0,25 | 439 | 11,45 | ||||
| 2025-04-29 | 13F | Lee Danner & Bass Inc | 0 | −100,00 | 0 | −100,00 | ||||
| 2025-08-12 | 13F | J.w. Cole Advisors, Inc. | 6 371 | 0,11 | 311 | 11,51 | ||||
| 2025-08-12 | 13F | Jpmorgan Chase & Co | 528 | −62,07 | 26 | −59,02 | ||||
| 2025-07-14 | 13F | Sowell Financial Services LLC | 15 044 | −2,48 | 733 | 8,43 | ||||
| 2025-07-10 | 13F | Vista Investment Partners Llc | 10 873 | 11,82 | 530 | 24,41 | ||||
| 2025-07-22 | 13F | Merit Financial Group, LLC | 6 886 | 0,09 | 336 | 11,30 | ||||
| 2025-07-29 | 13F | Stephens Inc /ar/ | 23 420 | 0,00 | 1 142 | 11,21 | ||||
| 2025-08-11 | 13F | Citigroup Inc | 650 | −99,00 | 32 | −98,92 | ||||
| 2025-08-14 | 13F | AllSquare Wealth Management LLC | 1 525 | 0,00 | 74 | 12,12 | ||||
| 2025-05-02 | 13F | BlackRock, Inc. | 0 | −100,00 | 0 | |||||
| 2025-08-06 | 13F | Commonwealth Equity Services, Llc | 50 690 | −1,41 | 2 | 0,00 | ||||
| 2025-08-14 | 13F | Mercer Global Advisors Inc /adv | 18 180 | −1,08 | 886 | 10,06 | ||||
| 2025-05-06 | 13F | PFG Advisors | 0 | −100,00 | 0 | −100,00 | ||||
| 2025-08-14 | 13F | Bank Of America Corp /de/ | 55 788 | 0,97 | 2 720 | 12,31 | ||||
| 2025-08-13 | 13F | Northwestern Mutual Wealth Management Co | 61 005 | 38,88 | 2 974 | 54,49 | ||||
| 2025-08-14 | 13F | Quantinno Capital Management LP | 4 272 | 208 | ||||||
| 2025-08-04 | 13F | Integrity Alliance, Llc. | 14 939 | −50,00 | 728 | −44,39 | ||||
| 2025-07-10 | 13F | Compton Wealth Advisory Group, LLC | 47 500 | 0,00 | 2 316 | 11,24 | ||||
| 2025-07-31 | 13F | Cambridge Investment Research Advisors, Inc. | 24 450 | −10,20 | 1 | 0,00 | ||||
| 2025-08-08 | 13F | Pnc Financial Services Group, Inc. | 53 | 0,00 | 3 | 0,00 | ||||
| 2025-07-11 | 13F | Farther Finance Advisors, LLC | 534 | 1,52 | 26 | 13,04 | ||||
| 2025-07-31 | 13F | Topsail Wealth Management, LLC | 750 | 0,00 | 37 | 12,50 | ||||
| 2025-08-12 | 13F | Proequities, Inc. | 0 | 0 | ||||||
| 2025-05-08 | 13F | Tiaa Trust, National Association | 0 | −100,00 | 0 | |||||
| 2025-08-11 | 13F | Principal Securities, Inc. | 1 700 | −1,85 | 83 | −1,20 | ||||
| 2025-08-14 | 13F/A | Barclays Plc | 600 | 0,00 | 0 | |||||
| 2025-08-14 | 13F | Wells Fargo & Company/mn | 67 665 | −3,07 | 3 299 | 7,81 | ||||
| 2025-08-15 | 13F | Tower Research Capital LLC (TRC) | 3 626 | −71,64 | 177 | −68,57 | ||||
| 2025-08-05 | 13F | American Institute for Advanced Investment Management, LLP | 6 662 | 3,10 | 325 | 14,49 | ||||
| 2025-08-11 | 13F | Strategic Wealth Partners, Ltd. | 250 | 12 | ||||||
| 2025-07-15 | 13F | Main Street Group, LTD | 325 | 0,00 | 16 | 7,14 | ||||
| 2025-08-15 | 13F | Morgan Stanley | 229 144 | −23,51 | 11 171 | −14,93 | ||||
| 2025-07-25 | 13F | Commonwealth Financial Services, LLC | 19 462 | −13,77 | 949 | −4,15 | ||||
| 2025-08-08 | 13F | Cetera Investment Advisers | 20 070 | 6,74 | 978 | 18,69 | ||||
| 2025-09-04 | 13F/A | Advisor Group Holdings, Inc. | 32 839 | −40,12 | 1 600 | −33,44 | ||||
| 2025-08-07 | 13F | New England Private Wealth Advisors LLC | 186 145 | −3,86 | 9 561 | 12,67 | ||||
| 2025-08-14 | 13F | Raymond James Financial Inc | 24 635 | 8,46 | 1 201 | 20,70 | ||||
| 2025-08-15 | 13F | Northeast Financial Consultants Inc | 21 000 | 0,00 | 1 024 | 11,20 | ||||
| 2025-07-14 | 13F | Matrix Trust Co | 0 | −100,00 | 0 | |||||
| 2025-07-16 | 13F | Badgley Phelps Wealth Managers, LLC | 4 310 | −6,51 | 210 | 3,96 | ||||
| 2025-07-08 | 13F | Parallel Advisors, LLC | 1 250 | 0,00 | 61 | 11,11 | ||||
| 2025-08-05 | 13F | Prosperity Consulting Group, LLC | 43 575 | −4,67 | 2 124 | 6,04 | ||||
| 2025-08-05 | 13F | GPS Wealth Strategies Group, LLC | 1 415 | 0,00 | 69 | 9,68 | ||||
| 2025-08-14 | 13F | Glen Eagle Advisors, LLC | 502 | 0,20 | 24 | 14,29 | ||||
| 2025-07-15 | 13F | Ballentine Partners, LLC | 8 730 | 0,00 | 426 | 11,26 | ||||
| 2025-07-14 | 13F | Toth Financial Advisory Corp | 750 | 0,00 | 37 | 12,50 | ||||
| 2025-08-08 | 13F | Flaharty Asset Management, LLC | 0 | −100,00 | 0 | |||||
| 2025-08-14 | 13F | Sunbelt Securities, Inc. | 880 | 0,00 | 43 | 10,53 | ||||
| 2025-07-07 | 13F | Horizons Wealth Management | 1 349 | 0,00 | 66 | 10,17 | ||||
| 2025-08-19 | 13F | National Asset Management, Inc. | 16 204 | −3,25 | 790 | −2,59 | ||||
| 2025-08-01 | 13F | Envestnet Asset Management Inc | 12 915 | 9,25 | 630 | 21,43 | ||||
| 2025-07-24 | 13F | Trust Co Of Toledo Na /oh/ | 1 020 | 50 | ||||||
| 2025-08-12 | 13F | CIBC Private Wealth Group, LLC | 203 | 0,00 | 10 | 28,57 | ||||
| 2025-08-08 | 13F | Hartland & Co., LLC | 0 | −100,00 | 0 | |||||
| 2025-07-15 | 13F | Genesis Wealth Advisors, LLC | 5 570 | 0,00 | 272 | 11,07 | ||||
| 2025-07-22 | 13F | Valley National Advisers Inc | 540 | 0,00 | 0 | |||||
| 2025-08-13 | 13F | Berry Wealth Group, LP | 4 250 | 207 | ||||||
| 2025-08-12 | 13F | Heritage Trust Co | 5 780 | 0,00 | 282 | 11,07 | ||||
| 2025-08-14 | 13F | Citadel Advisors Llc | 0 | −100,00 | 0 | |||||
| 2025-08-13 | 13F | Flow Traders U.s. Llc | 0 | −100,00 | 0 | |||||
| 2025-08-14 | 13F | Fmr Llc | 6 663 | 9,23 | 325 | 21,35 | ||||
| 2025-08-07 | 13F | Commerce Bank | 6 510 | 0,00 | 317 | 11,23 | ||||
| 2025-08-12 | 13F | Coldstream Capital Management Inc | 77 954 | −11,88 | 3 800 | −1,99 | ||||
| 2025-08-14 | 13F | Integrated Wealth Concepts LLC | 5 205 | 0,00 | 254 | 10,96 | ||||
| 2025-04-29 | 13F | Element Wealth, LLC | 0 | −100,00 | 0 | |||||
| 2025-08-14 | 13F | Connecticut Wealth Management, LLC | 11 325 | 0,00 | 552 | 11,29 | ||||
| 2025-07-09 | 13F | Fiduciary Alliance LLC | 4 309 | 210 | ||||||
| 2025-07-30 | 13F | Princeton Global Asset Management LLC | 2 519 | 0,00 | 123 | 10,91 | ||||
| 2025-07-31 | 13F | Oppenheimer & Co Inc | 15 917 | 107,60 | 776 | 130,65 | ||||
| 2025-08-14 | 13F | UBS Group AG | 60 357 | 7,00 | 2 943 | 19,01 | ||||
| 2025-08-11 | 13F | CBIZ Investment Advisory Services, LLC | 143 | 0,70 | 7 | 0,00 | ||||
| 2025-08-12 | 13F | Jacobi Capital Management LLC | 7 238 | 0,24 | 353 | 11,39 | ||||
| 2025-08-13 | 13F | Jones Financial Companies Lllp | 2 544 | 22,96 | 124 | 36,67 | ||||
| 2025-08-07 | 13F | Hughes Financial Services, LLC | 1 615 | 0,00 | 81 | 12,68 | ||||
| 2025-07-21 | 13F | DHJJ Financial Advisors, Ltd. | 260 | 0,00 | 13 | 9,09 | ||||
| 2025-07-29 | 13F | Dale Q Rice Investment Management Ltd | 9 908 | −54,61 | 488 | −48,95 | ||||
| 2025-08-12 | 13F | Steward Partners Investment Advisory, Llc | 290 | 0,00 | 14 | 16,67 | ||||
| 2025-08-08 | 13F | Citizens Financial Group Inc/ri | 5 471 | 0,00 | 267 | 11,30 | ||||
| 2025-07-16 | 13F | Twelve Points Wealth Management LLC | 70 309 | −65,74 | 3 428 | −61,89 | ||||
| 2025-07-21 | 13F | Segment Wealth Management, LLC | 4 830 | 0,00 | 235 | 11,37 | ||||
| 2025-08-14 | 13F | Stifel Financial Corp | 7 759 | 16,03 | 378 | 29,01 | ||||
| 2025-08-15 | 13F | CI Private Wealth, LLC | 5 437 | −16,38 | 265 | −6,69 | ||||
| 2025-05-14 | 13F | Mml Investors Services, Llc | 0 | −100,00 | 0 | |||||
| 2025-07-22 | 13F | Wealthcare Advisory Partners LLC | 0 | −100,00 | 0 | |||||
| 2025-08-13 | 13F | Cary Street Partners Financial Llc | 6 253 | 0,00 | 305 | 10,95 | ||||
| 2025-06-26 | NP | DWAFX - ARROW DWA BALANCED FUND CLASS A SHARES | 17 558 | −0,81 | 777 | −12,42 | ||||
| 2025-08-13 | 13F | M Holdings Securities, Inc. | 13 974 | 1 | ||||||
| 2025-08-01 | 13F | Rossby Financial, LCC | 280 | 0,00 | 14 | 8,33 | ||||
| 2025-08-15 | 13F | Cornerstone Financial Group, LLC /NE/ | 26 564 | −0,03 | 1 295 | 2,37 | ||||
| 2025-08-14 | 13F | Ameriprise Financial Inc | 6 566 | 14,05 | 320 | 26,98 | ||||
| 2025-07-22 | 13F | Willner & Heller, Llc | 11 544 | 0,25 | 563 | 11,51 | ||||
| 2025-08-14 | 13F | McIlrath & Eck, LLC | 50 | 0,00 | 2 | 0,00 | ||||
| 2025-07-10 | 13F | Wealth Enhancement Advisory Services, Llc | 10 107 | −8,62 | 501 | 3,51 | ||||
| 2025-07-21 | 13F | Pflug Koory, LLC | 442 | 22 |