Grundläggande statistik
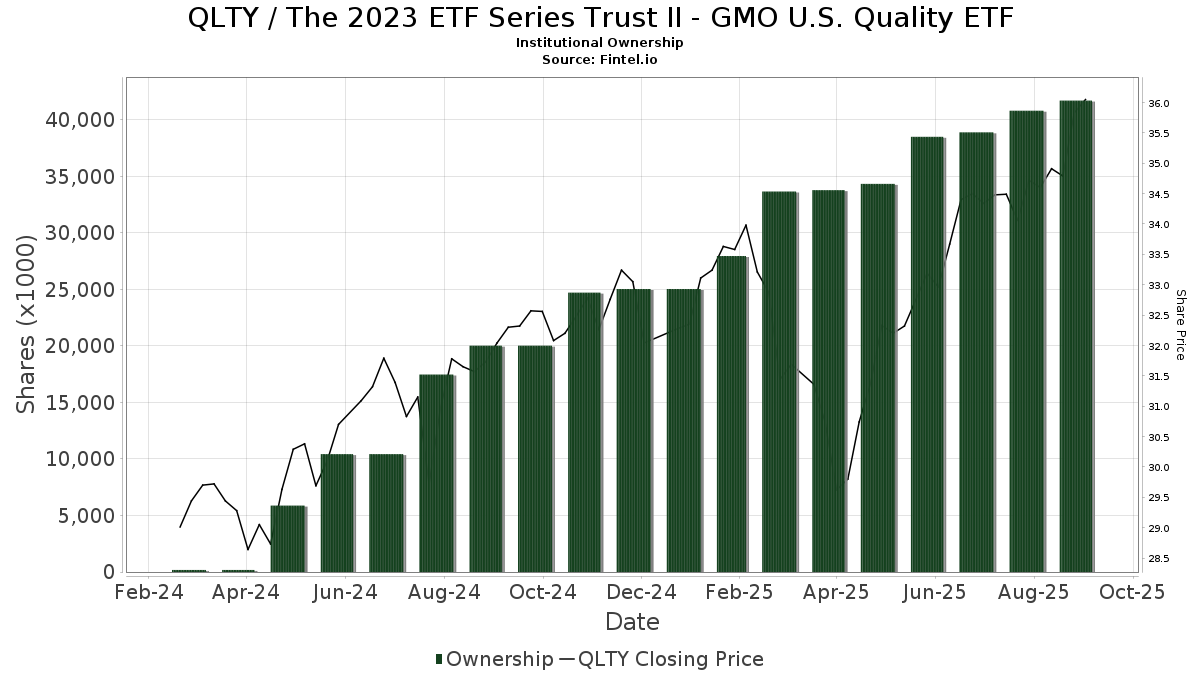
| Institutionella ägare | 111 total, 111 long only, 0 short only, 0 long/short - change of −0,89% MRQ |
| Genomsnittlig portföljallokering | 1.2266 % - change of 58,96% MRQ |
| Institutionella aktier (lång) | 41 691 564 (ex 13D/G) - change of 3,20MM shares 8,33% MRQ |
| Institutionellt värde (lång) | $ 1 353 441 USD ($1000) |
Institutionellt ägande och aktieägare
The 2023 ETF Series Trust II - GMO U.S. Quality ETF (US:QLTY) har 111 Institutionella ägare och aktieägare som har lämnat in 13D/G- eller 13F-formulär till Securities Exchange Commission (SEC). Dessa institut innehar totalt 41,691,564 aktier. Största aktieägare inkluderar AIA Group Ltd, Allworth Financial LP, Merit Financial Group, LLC, Gitterman Wealth Management, LLC, Fft Wealth Management Llc, Lazard Asset Management Llc, Raymond James Financial Inc, Crestwood Advisors Group LLC, Colony Group, LLC, and Pinnacle Associates Ltd .
The 2023 ETF Series Trust II - GMO U.S. Quality ETF (ARCA:QLTY) Institutionell ägarstruktur visar institutioners och fonders nuvarande positioner i företaget, samt de senaste förändringarna i positionernas storlek. Större aktieägare kan vara enskilda investerare, fonder, hedgefonder eller institutioner. Bilaga 13D visar att investeraren äger (eller ägde) mer än 5% av företaget och avser (eller avsåg) att aktivt eftersträva en förändring av affärsstrategin. Schedule 13G indikerar en passiv investering på över 5%.
The share price as of September 18, 2025 is 36,21 / share. Previously, on September 19, 2024, the share price was 32,48 / share. This represents an increase of 11,48% over that period.
Fondsentimentets poäng
Fondsentimentet poängen(fka Ägarackumulation-poäng) visar vilka aktier som är mest köpta av fonder. Det är resultatet av en sofistikerad kvantitativ flerfaktormodell som identifierar företag med de högsta nivåerna av institutionell ackumulering. Poängsättningsmodellen använder en kombination av den totala ökningen av redovisade ägare, förändringarna i portföljallokeringarna för dessa ägare och andra mått. Siffran sträcker sig från 0 till 100, där högre siffror indikerar en högre nivå av ackumulering i förhållande till sina konkurrenter, och 50 är genomsnittet.
Uppdateringsfrekvens: Dagligen
Se Ownership Explorer, som innehåller en lista över de högst rankade företagen.
Institutionell sälj/köp-kvot
Förutom att rapportera vanliga eget kapital- och skuldemissioner måste institutioner med mer än 100MM tillgångar under förvaltning också avslöja sina innehav av sälj- och köpoptioner. Eftersom säljoptioner i allmänhet indikerar ett negativt sentiment och köpoptioner indikerar ett positivt sentiment, kan vi få en uppfattning om det övergripande institutionella sentimentet genom att plotta förhållandet mellan säljoptioner och köpoptioner. Diagrammet till höger visar det historiska förhållandet mellan sälj- och köpoptioner för detta instrument.
Genom att använda sälj/köp-kvoten som en indikator på aktieägarnas sentiment undviker man en av de största bristerna med att använda det totala institutionella ägandet, nämligen att en betydande del av de förvaltade tillgångarna investeras passivt för att följa index. Passivt förvaltade fonder köper vanligtvis inte optioner, så indikatorn för sälj/köp-kvoten ger en bättre bild av stämningen i aktivt förvaltade fonder.
13F- och NPORT-arkiveringar
Detaljer om 13F-arkiveringar är gratis. Detaljer om NP-arkiveringar kräver ett premiummedlemskap. Gröna rader indikerar nya positioner. Röda rader indikerar stängda positioner. Klicka på länk symbolen för att se hela transaktionshistoriken.
Uppgradera
för att låsa upp premiumdata och exportera till Excel ![]() .
.
| Fil Datum | Källa | Investerare | Typ | Genomsnittligt pris (beräknat) |
Aktier | Δ Aktier (%) |
Rapporterat värde (1000 USD) |
Δ Värde (%) |
Portföljallokering (%) |
|
|---|---|---|---|---|---|---|---|---|---|---|
| 2025-05-13 | 13F | Evoke Wealth, Llc | 0 | −100,00 | 0 | |||||
| 2025-08-12 | 13F | Heron Bay Capital Management | 13 101 | −26,91 | 449 | −20,00 | ||||
| 2025-07-25 | 13F | Pathway Financial Advisors LLC | 19 108 | 655 | ||||||
| 2025-08-13 | 13F | Quadrature Capital Ltd | 12 361 | 0,00 | 424 | 9,59 | ||||
| 2025-09-04 | 13F/A | Advisor Group Holdings, Inc. | 12 117 | −3,74 | 415 | 5,60 | ||||
| 2025-08-11 | 13F | HighTower Advisors, LLC | 114 910 | −91,73 | 3 937 | −90,94 | ||||
| 2025-07-22 | 13F | Merit Financial Group, LLC | 6 823 572 | 43,51 | 233 776 | 57,28 | ||||
| 2025-08-12 | 13F | Atlas Capital Advisors Llc | 400 | −33,33 | 14 | −27,78 | ||||
| 2025-08-12 | 13F | Accredited Wealth Management, LLC | 86 848 | −4,91 | 2 975 | 4,06 | ||||
| 2025-08-12 | 13F | Heritage Trust Co | 67 510 | 21,76 | 2 313 | 33,41 | ||||
| 2025-08-01 | 13F | Envestnet Asset Management Inc | 290 039 | 1 165,22 | 9 937 | 1 287,71 | ||||
| 2025-08-11 | 13F | Dorsey & Whitney Trust CO LLC | 8 101 | 0,00 | 278 | 9,49 | ||||
| 2025-08-06 | 13F | Commonwealth Equity Services, Llc | 108 394 | 214,30 | 4 | 200,00 | ||||
| 2025-08-13 | 13F | Botty Investors LLC | 199 000 | 18,45 | 6 818 | 29,63 | ||||
| 2025-08-14 | 13F | Colony Group, LLC | 1 002 731 | 12,49 | 34 354 | 23,29 | ||||
| 2025-08-14 | 13F | Wells Fargo & Company/mn | 428 | −72,10 | 15 | −70,21 | ||||
| 2025-07-01 | 13F | Stonehearth Capital Management, LLC | 389 209 | 13 334 | ||||||
| 2025-08-07 | 13F | Allworth Financial LP | 8 130 788 | 2,17 | 278 561 | 14,96 | ||||
| 2025-08-11 | 13F | VSM Wealth Advisory, LLC | 0 | −100,00 | 0 | |||||
| 2025-07-08 | 13F | Chemistry Wealth Management LLC | 10 022 | 0,00 | 343 | 9,58 | ||||
| 2025-08-11 | 13F | Berkeley, Inc | 30 505 | −49,80 | 1 045 | −44,97 | ||||
| 2025-08-12 | 13F | Global Retirement Partners, LLC | 34 800 | −0,80 | 1 192 | 6,33 | ||||
| 2025-08-11 | 13F | Principal Securities, Inc. | 4 556 | 63,53 | 156 | 75,28 | ||||
| 2025-08-07 | 13F | CENTRAL TRUST Co | 2 447 | −10,73 | 84 | −2,35 | ||||
| 2025-07-15 | 13F | Northside Capital Management, LLC | 15 680 | 0,00 | 537 | 9,59 | ||||
| 2025-07-17 | 13F | Tempus Wealth Planning, LLC | 142 150 | −2,57 | 4 870 | 6,80 | ||||
| 2025-08-05 | 13F | Crestwood Advisors Group LLC | 1 075 016 | 2,63 | 36 830 | 12,48 | ||||
| 2025-08-12 | 13F | Gitterman Wealth Management, LLC | 1 624 912 | 2,90 | 55 670 | 12,78 | ||||
| 2025-08-14 | 13F | Jane Street Group, Llc | 18 897 | 17,57 | 647 | 28,88 | ||||
| 2025-08-14 | 13F | Mml Investors Services, Llc | 595 163 | 106,58 | 20 | 122,22 | ||||
| 2025-08-11 | 13F | Madison Asset Management, LLC | 20 389 | −2,38 | 699 | 7,06 | ||||
| 2025-08-06 | 13F | Prodigy Asset Management LLC | 72 216 | 14,62 | 2 474 | 25,65 | ||||
| 2025-07-14 | 13F | Kfg Wealth Management, Llc | 11 491 | −0,55 | 394 | 8,86 | ||||
| 2025-08-14 | 13F | Lazard Asset Management Llc | 1 182 219 | 91,26 | 41 | 73,91 | ||||
| 2025-08-14 | 13F | D. E. Shaw & Co., Inc. | 8 232 | −11,79 | 282 | −3,09 | ||||
| 2025-08-13 | 13F | Lido Advisors, LLC | 21 200 | 0,00 | 726 | 9,50 | ||||
| 2025-08-15 | 13F | CI Private Wealth, LLC | 77 170 | 240,00 | 2 644 | 272,25 | ||||
| 2025-08-06 | 13F | AIA Group Ltd | 8 658 486 | −1,12 | 296 640 | 8,37 | ||||
| 2025-08-15 | 13F | Fft Wealth Management Llc | 1 405 041 | 16,84 | 47 814 | 26,99 | ||||
| 2025-08-15 | 13F | Morgan Stanley | 7 121 | 712 000,00 | 244 | |||||
| 2025-08-12 | 13F | Proequities, Inc. | 0 | 0 | ||||||
| 2025-08-13 | 13F | Global Endowment Management, LP | 16 000 | 0,00 | 548 | 9,60 | ||||
| 2025-07-18 | 13F | Truist Financial Corp | 8 249 | 1,29 | 283 | 11,02 | ||||
| 2025-07-31 | 13F | Longview Financial Advisors, Inc. | 0 | −100,00 | 0 | |||||
| 2025-08-11 | 13F | Eq Llc | 33 904 | 1 162 | ||||||
| 2025-07-24 | 13F | IFP Advisors, Inc | 142 | 0,00 | 5 | 0,00 | ||||
| 2025-08-18 | 13F | Geneos Wealth Management Inc. | 738 | 0,14 | 25 | 8,70 | ||||
| 2025-08-14 | 13F | Arete Wealth Advisors, LLC | 46 556 | −7,91 | 2 | 0,00 | ||||
| 2025-07-25 | 13F | Stonehage Fleming Financial Services Holdings Ltd | 89 765 | 22,39 | 3 075 | 34,16 | ||||
| 2025-07-29 | 13F | Kelman-Lazarov, Inc. | 368 729 | 5,79 | 12 633 | 15,94 | ||||
| 2025-05-14 | 13F | Van Hulzen Asset Management, LLC | 0 | −100,00 | 0 | |||||
| 2025-05-15 | 13F | Bank Of America Corp /de/ | 0 | −100,00 | 0 | |||||
| 2025-07-17 | 13F | HB Wealth Management, LLC | 434 135 | 111,45 | 14 873 | 131,74 | ||||
| 2025-08-14 | 13F | Leisure Capital Management | 234 622 | 4,40 | 8 038 | 14,42 | ||||
| 2025-08-14 | 13F | Ancora Advisors, LLC | 695 | 0,00 | 24 | 9,52 | ||||
| 2025-07-09 | 13F | Breakwater Capital Group | 12 842 | 5,76 | 440 | 15,83 | ||||
| 2025-07-10 | 13F | Wealth Enhancement Advisory Services, Llc | 35 444 | −29,01 | 1 228 | −21,35 | ||||
| 2025-07-16 | 13F | Essex Financial Services, Inc. | 8 877 | 0,00 | 304 | 9,75 | ||||
| 2025-08-14 | 13F | UBS Group AG | 6 610 | −48,78 | 226 | −43,92 | ||||
| 2025-07-09 | 13F | Archer Investment Management, LLC | 229 350 | −28,45 | 7 858 | −21,59 | ||||
| 2025-07-10 | 13F | Exchange Traded Concepts, Llc | 77 418 | 24,53 | 2 652 | 36,49 | ||||
| 2025-07-17 | 13F | Janney Montgomery Scott LLC | 30 588 | 53,63 | 1 | |||||
| 2025-08-12 | 13F | BlackRock, Inc. | 0 | −100,00 | 0 | |||||
| 2025-08-13 | 13F | Certior Financial Group, Llc | 36 065 | 1,00 | 1 236 | 10,66 | ||||
| 2025-07-28 | 13F | Mutual Advisors, LLC | 44 321 | 0,06 | 1 537 | 13,43 | ||||
| 2025-07-15 | 13F | Verum Partners LLC | 373 289 | −2,71 | 12 789 | 6,62 | ||||
| 2025-07-16 | 13F | Paragon Capital Management Ltd | 359 049 | 6,15 | 12 301 | 16,34 | ||||
| 2025-08-14 | 13F | Susquehanna International Group, Llp | 74 938 | −42,34 | 2 567 | −36,80 | ||||
| 2025-07-08 | 13F | Parallel Advisors, LLC | 29 938 | −31,57 | 1 026 | −25,02 | ||||
| 2025-08-14 | 13F | Comerica Bank | 9 363 | 321 | ||||||
| 2025-07-11 | 13F | Annex Advisory Services, LLC | 688 515 | −47,43 | 23 589 | −42,38 | ||||
| 2025-04-29 | 13F | Bank of New York Mellon Corp | 0 | −100,00 | 0 | |||||
| 2025-04-15 | 13F | Focus Financial Network, Inc. | 0 | −100,00 | 0 | |||||
| 2025-07-11 | 13F | Diversified Trust Co | 203 944 | 33,56 | 6 987 | 46,39 | ||||
| 2025-08-12 | 13F | Jpmorgan Chase & Co | 127 276 | −38,95 | 4 360 | −33,10 | ||||
| 2025-07-23 | 13F | Colony Family Offices, LLC | 511 676 | −9,20 | 17 530 | −0,63 | ||||
| 2025-08-04 | 13F | Pinnacle Associates Ltd | 828 557 | 0,04 | 28 386 | 9,64 | ||||
| 2025-08-12 | 13F | LPL Financial LLC | 164 673 | 21,56 | 5 642 | 33,23 | ||||
| 2025-08-13 | 13F | Hollow Brook Wealth Management LLC | 53 202 | 67,83 | 1 823 | 84,04 | ||||
| 2025-07-29 | 13F | TFC Financial Management | 1 850 | 63 | ||||||
| 2025-08-11 | 13F | Brown Brothers Harriman & Co | 158 368 | 5 426 | ||||||
| 2025-08-13 | 13F | Allegheny Financial Group LTD | 82 842 | 197,81 | 2 838 | 226,58 | ||||
| 2025-08-14 | 13F | CIBC World Markets Inc. | 124 086 | −4,49 | 4 251 | 4,68 | ||||
| 2025-08-07 | 13F | New England Private Wealth Advisors LLC | 183 552 | 2,00 | 6 331 | 12,53 | ||||
| 2025-07-11 | 13F | Sprinkle Financial Consultants LLC | 69 008 | 33,91 | 2 364 | 46,83 | ||||
| 2025-07-03 | 13F | Lam Group, Inc. | 20 605 | −2,09 | 706 | 7,31 | ||||
| 2025-07-10 | 13F | Triangle Securities Wealth Management | 56 671 | 27,43 | 1 942 | 39,64 | ||||
| 2025-07-14 | 13F | GAMMA Investing LLC | 37 | 1 | ||||||
| 2025-07-24 | 13F | Financial Connections Group, Inc. | 183 428 | 29,68 | 6 | 50,00 | ||||
| 2025-08-12 | 13F | New Republic Capital, LLC | 223 202 | 78,55 | 7 647 | 95,40 | ||||
| 2025-08-14 | 13F | Wiley Bros.-aintree Capital, Llc | 259 884 | 8 975 | ||||||
| 2025-08-05 | 13F | Harel Insurance Investments & Financial Services Ltd. | 14 000 | 180,00 | 0 | |||||
| 2025-08-12 | 13F | Argent Trust Co | 101 339 | 15,04 | 3 472 | 26,08 | ||||
| 2025-07-31 | 13F | Kathleen S. Wright Associates Inc. | 2 035 | 804,44 | 70 | 885,71 | ||||
| 2025-08-07 | 13F | Legacy Advisors, LLC | 89 183 | 2 603 | ||||||
| 2025-08-13 | 13F | National Bank Of Canada /fi/ | 0 | −100,00 | 0 | |||||
| 2025-08-14 | 13F | Fort Point Capital Partners LLC | 0 | −100,00 | 0 | |||||
| 2025-08-14 | 13F | Royal Bank Of Canada | 462 | −97,41 | 16 | −97,13 | ||||
| 2025-04-24 | 13F | Canvas Wealth Advisors, LLC | 0 | −100,00 | 0 | |||||
| 2025-08-15 | 13F | Lgl Partners, Llc | 186 202 | 13,26 | 6 336 | 23,10 | ||||
| 2025-08-14 | 13F | Principia Wealth Advisory, LLC | 5 995 | 3,34 | 205 | 15,17 | ||||
| 2025-08-13 | 13F | StoneX Group Inc. | 49 135 | 3,62 | 1 683 | 13,41 | ||||
| 2025-08-06 | 13F | Prospera Financial Services Inc | 27 500 | 69,75 | 942 | 86,17 | ||||
| 2025-07-09 | 13F | Dynamic Advisor Solutions LLC | 7 991 | 0,16 | 274 | 9,64 | ||||
| 2025-08-12 | 13F | Coston, McIsaac & Partners | 7 | 0,00 | 0 | |||||
| 2025-07-23 | 13F | Joel Isaacson & Co., LLC | 7 743 | −24,88 | 265 | −17,70 | ||||
| 2025-08-12 | 13F | Auxano Advisors, LLC | 560 964 | 3,92 | 19 219 | 13,88 | ||||
| 2025-07-25 | 13F | Cwm, Llc | 0 | −100,00 | 0 | |||||
| 2025-07-29 | 13F | Wingate Wealth Advisors, Inc. | 71 141 | −1,45 | 2 437 | 8,02 | ||||
| 2025-08-08 | 13F | Creative Planning | 0 | −100,00 | 0 | |||||
| 2025-07-11 | 13F | Farther Finance Advisors, LLC | 64 968 | −0,71 | 2 226 | 8,96 | ||||
| 2025-07-30 | 13F | Studio Investment Management Llc | 32 908 | 0,45 | 1 127 | 9,95 | ||||
| 2025-07-29 | 13F | Aspiriant, Llc | 8 304 | 0,00 | 284 | 9,65 | ||||
| 2025-08-05 | 13F | J. W. Coons Advisors, LLC | 30 654 | 2,68 | 1 050 | 12,54 | ||||
| 2025-08-04 | 13F | Assetmark, Inc | 360 | 12 | ||||||
| 2025-06-26 | NP | FLCE - Frontier Asset U.S. Large Cap Equity ETF | 68 034 | 9,43 | 2 091 | 0,29 | ||||
| 2025-08-13 | 13F | Northwestern Mutual Wealth Management Co | 4 442 | 73,45 | 152 | 90,00 | ||||
| 2025-05-08 | 13F | Eastern Bank | 0 | −100,00 | 0 | |||||
| 2025-08-07 | 13F | Gryphon Financial Partners LLC | 10 873 | 373 | ||||||
| 2025-08-11 | 13F | Nations Financial Group Inc, /ia/ /adv | 0 | −100,00 | 0 | |||||
| 2025-07-25 | 13F | Hazlett, Burt & Watson, Inc. | 274 | 0,00 | 0 | |||||
| 2025-08-06 | 13F | SOUTH STATE Corp | 269 334 | −2,92 | 9 227 | 6,40 | ||||
| 2025-08-12 | 13F | MAI Capital Management | 67 | 0,00 | 2 | 0,00 | ||||
| 2025-08-11 | 13F | Private Advisor Group, LLC | 9 593 | −0,54 | 329 | 8,97 | ||||
| 2025-05-07 | 13F | David R. Rahn & Associates Inc. | 0 | −100,00 | 0 | |||||
| 2025-07-30 | 13F | Princeton Global Asset Management LLC | 101 772 | −1,99 | 3 487 | 7,43 | ||||
| 2025-08-14 | 13F | GWM Advisors LLC | 6 459 | −36,18 | 221 | −30,06 | ||||
| 2025-07-25 | 13F | Atria Wealth Solutions, Inc. | 0 | −100,00 | 0 | |||||
| 2025-08-14 | 13F | Raymond James Financial Inc | 1 160 492 | 10,03 | 39 758 | 20,60 |