Grundläggande statistik
| Institutionella ägare | 114 total, 114 long only, 0 short only, 0 long/short - change of 10,68% MRQ |
| Genomsnittlig portföljallokering | 0.0735 % - change of 1,56% MRQ |
| Institutionella aktier (lång) | 3 042 370 (ex 13D/G) - change of 1,32MM shares 76,87% MRQ |
| Institutionellt värde (lång) | $ 319 628 USD ($1000) |
Institutionellt ägande och aktieägare
iShares Trust - iShares Global Comm Services ETF (US:IXP) har 114 Institutionella ägare och aktieägare som har lämnat in 13D/G- eller 13F-formulär till Securities Exchange Commission (SEC). Dessa institut innehar totalt 3,042,370 aktier. Största aktieägare inkluderar Hsbc Holdings Plc, Green Harvest Asset Management LLC, Bank Of America Corp /de/, Pictet Asset Management Holding SA, Morgan Stanley, Money Design Co.,Ltd., BlackRock, Inc., Destination Wealth Management, AE Wealth Management LLC, and Wells Fargo & Company/mn .
iShares Trust - iShares Global Comm Services ETF (ARCA:IXP) Institutionell ägarstruktur visar institutioners och fonders nuvarande positioner i företaget, samt de senaste förändringarna i positionernas storlek. Större aktieägare kan vara enskilda investerare, fonder, hedgefonder eller institutioner. Bilaga 13D visar att investeraren äger (eller ägde) mer än 5% av företaget och avser (eller avsåg) att aktivt eftersträva en förändring av affärsstrategin. Schedule 13G indikerar en passiv investering på över 5%.
The share price as of September 10, 2025 is 122,98 / share. Previously, on September 11, 2024, the share price was 87,54 / share. This represents an increase of 40,48% over that period.

Fondsentimentets poäng
Fondsentimentet poängen(fka Ägarackumulation-poäng) visar vilka aktier som är mest köpta av fonder. Det är resultatet av en sofistikerad kvantitativ flerfaktormodell som identifierar företag med de högsta nivåerna av institutionell ackumulering. Poängsättningsmodellen använder en kombination av den totala ökningen av redovisade ägare, förändringarna i portföljallokeringarna för dessa ägare och andra mått. Siffran sträcker sig från 0 till 100, där högre siffror indikerar en högre nivå av ackumulering i förhållande till sina konkurrenter, och 50 är genomsnittet.
Uppdateringsfrekvens: Dagligen
Se Ownership Explorer, som innehåller en lista över de högst rankade företagen.
Institutionell sälj/köp-kvot
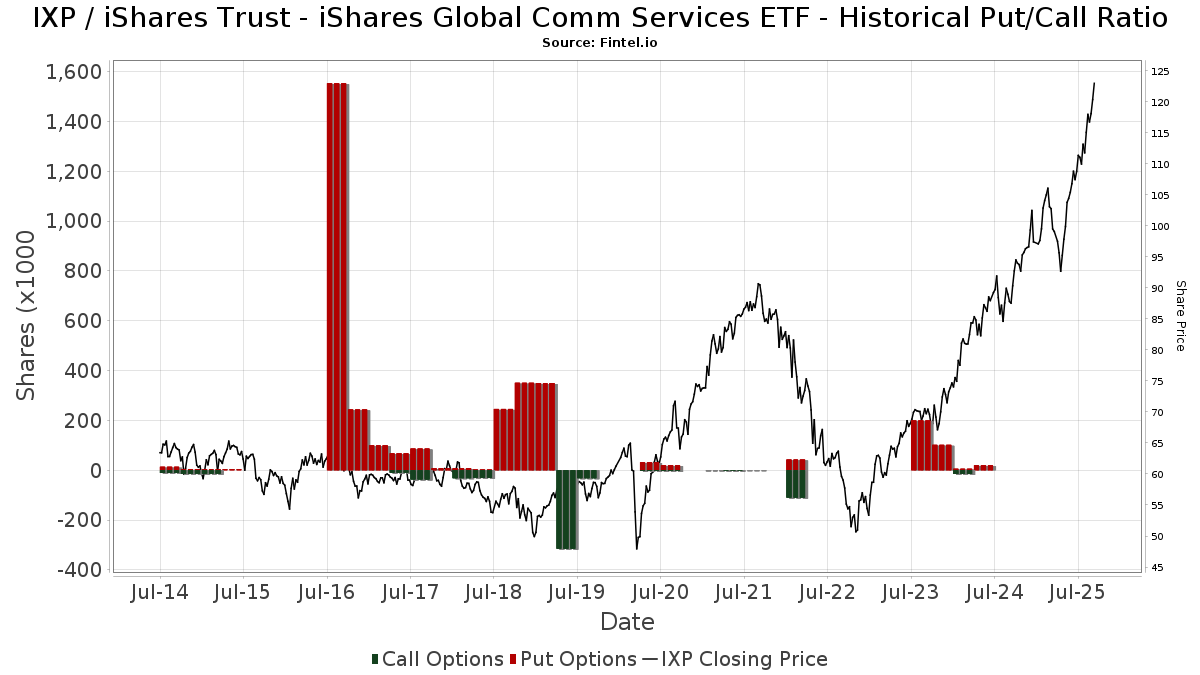
Förutom att rapportera vanliga eget kapital- och skuldemissioner måste institutioner med mer än 100MM tillgångar under förvaltning också avslöja sina innehav av sälj- och köpoptioner. Eftersom säljoptioner i allmänhet indikerar ett negativt sentiment och köpoptioner indikerar ett positivt sentiment, kan vi få en uppfattning om det övergripande institutionella sentimentet genom att plotta förhållandet mellan säljoptioner och köpoptioner. Diagrammet till höger visar det historiska förhållandet mellan sälj- och köpoptioner för detta instrument.
Genom att använda sälj/köp-kvoten som en indikator på aktieägarnas sentiment undviker man en av de största bristerna med att använda det totala institutionella ägandet, nämligen att en betydande del av de förvaltade tillgångarna investeras passivt för att följa index. Passivt förvaltade fonder köper vanligtvis inte optioner, så indikatorn för sälj/köp-kvoten ger en bättre bild av stämningen i aktivt förvaltade fonder.
13F- och NPORT-arkiveringar
Detaljer om 13F-arkiveringar är gratis. Detaljer om NP-arkiveringar kräver ett premiummedlemskap. Gröna rader indikerar nya positioner. Röda rader indikerar stängda positioner. Klicka på länk symbolen för att se hela transaktionshistoriken.
Uppgradera
för att låsa upp premiumdata och exportera till Excel ![]() .
.
| Fil Datum | Källa | Investerare | Typ | Genomsnittligt pris (beräknat) |
Aktier | Δ Aktier (%) |
Rapporterat värde (1000 USD) |
Δ Värde (%) |
Portföljallokering (%) |
|
|---|---|---|---|---|---|---|---|---|---|---|
| 2025-04-09 | 13F | RFG Advisory, LLC | 0 | −100,00 | 0 | |||||
| 2025-07-31 | 13F | Money Design Co.,Ltd. | 92 136 | −3,00 | 10 | 11,11 | ||||
| 2025-07-30 | 13F | Wbh Advisory Inc | 4 254 | 70,30 | 478 | 97,11 | ||||
| 2025-09-04 | 13F/A | Advisor Group Holdings, Inc. | 5 331 | 25,97 | 599 | 46,10 | ||||
| 2025-08-19 | 13F | Advisory Services Network, LLC | 11 470 | 1 302 | ||||||
| 2025-08-13 | 13F | Flow Traders U.s. Llc | 41 874 | 50,59 | 5 | 100,00 | ||||
| 2025-08-14 | 13F | Integrated Wealth Concepts LLC | 15 652 | 3,27 | 1 758 | 19,59 | ||||
| 2025-08-14 | 13F | Alliancebernstein L.p. | 1 932 | 217 | ||||||
| 2025-08-18 | 13F | Goodman Advisory Group, LLC | 0 | −100,00 | 0 | |||||
| 2025-04-30 | 13F | Allworth Financial LP | 0 | −100,00 | 0 | |||||
| 2025-08-14 | 13F | Destination Wealth Management | 80 951 | 0,04 | 9 092 | 15,82 | ||||
| 2025-08-01 | 13F | Financial Counselors Inc | 0 | −100,00 | 0 | |||||
| 2025-08-01 | 13F | Corrado Advisors, Llc | 35 723 | 7,20 | 4 012 | 24,10 | ||||
| 2025-08-07 | 13F | HC Advisors, LLC | 27 989 | −3,72 | 3 144 | 11,45 | ||||
| 2025-07-15 | 13F | North Star Investment Management Corp. | 1 205 | 0,17 | 135 | 16,38 | ||||
| 2025-08-07 | 13F | Cascade Financial Partners, LLC | 3 000 | 337 | ||||||
| 2025-07-16 | 13F | Meridian Investment Counsel Inc. | 6 700 | 0,00 | 753 | 15,69 | ||||
| 2025-08-12 | 13F | Proequities, Inc. | 0 | 0 | ||||||
| 2025-08-13 | 13F | Per Stirling Capital Management, LLC. | 14 838 | 0,19 | 1 667 | 16,02 | ||||
| 2025-08-12 | 13F | CIBC Private Wealth Group, LLC | 0 | −100,00 | 0 | |||||
| 2025-08-01 | 13F | Transcend Wealth Collective, Llc | 2 489 | 4,06 | 280 | 20,26 | ||||
| 2025-08-06 | 13F | Commonwealth Equity Services, Llc | 18 809 | −0,92 | 2 | 100,00 | ||||
| 2025-07-14 | 13F | U.S. Capital Wealth Advisors, LLC | 11 285 | 1,81 | 1 268 | 17,86 | ||||
| 2025-07-10 | 13F | Rockland Trust Co | 38 781 | −3,34 | 4 356 | 11,90 | ||||
| 2025-07-23 | 13F | Slow Capital, Inc. | 20 722 | −1,74 | 2 328 | 13,73 | ||||
| 2025-05-01 | 13F | Quest 10 Wealth Builders, Inc. | 1 | 0,00 | 0 | |||||
| 2025-08-12 | 13F | Jpmorgan Chase & Co | 25 183 | 21,15 | 2 829 | 40,28 | ||||
| 2025-08-01 | 13F | Bessemer Group Inc | 5 142 | 0,00 | 1 | |||||
| 2025-07-23 | 13F | Independent Solutions Wealth Management, LLC | 2 490 | 4,71 | 280 | 21,30 | ||||
| 2025-07-24 | 13F | Us Bancorp \de\ | 6 113 | 0,00 | 687 | 15,68 | ||||
| 2025-08-08 | 13F | Family Firm, Inc. | 0 | −100,00 | 0 | |||||
| 2025-07-23 | 13F | Bellevue Asset Management, Llc | 0 | −100,00 | 0 | |||||
| 2025-08-06 | 13F | AE Wealth Management LLC | 77 629 | 8,03 | 8 719 | 25,06 | ||||
| 2025-08-13 | 13F | Kayne Anderson Rudnick Investment Management Llc | 130 | 15 | ||||||
| 2025-08-08 | 13F | Union Savings Bank | 73 | 0,00 | 8 | 14,29 | ||||
| 2025-08-12 | 13F | Gladstone Institutional Advisory LLC | 4 576 | 30,48 | 514 | 50,88 | ||||
| 2025-08-14 | 13F | Royal Bank Of Canada | 3 547 | −12,59 | 398 | 1,02 | ||||
| 2025-08-05 | 13F | Bank Of Montreal /can/ | 542 | −60,38 | 61 | −54,55 | ||||
| 2025-08-15 | 13F | Semmax Financial Advisors Inc. | 12 | 0,00 | 1 | 0,00 | ||||
| 2025-08-14 | 13F | Wiley Bros.-aintree Capital, Llc | 1 804 | 203 | ||||||
| 2025-05-16 | 13F | Laidlaw Wealth Management LLC | 0 | −100,00 | 0 | |||||
| 2025-07-25 | 13F | NorthRock Partners, LLC | 998 | 0,00 | 112 | 16,67 | ||||
| 2025-08-12 | 13F | Journey Strategic Wealth Llc | 23 808 | 16,34 | 2 674 | 34,71 | ||||
| 2025-08-14 | 13F | Mml Investors Services, Llc | 13 649 | −15,23 | 2 | 0,00 | ||||
| 2025-08-11 | 13F | Aptus Capital Advisors, LLC | 14 | 0,00 | 2 | 0,00 | ||||
| 2025-04-21 | 13F | Beacon Capital Management, LLC | 0 | −100,00 | 0 | |||||
| 2025-05-05 | 13F | Mandatum Life Insurance Co Ltd | 0 | −100,00 | 0 | |||||
| 2025-08-08 | 13F | SBI Securities Co., Ltd. | 952 | 19,75 | 107 | 37,66 | ||||
| 2025-07-21 | 13F | Ameritas Advisory Services, LLC | 15 | 2 | ||||||
| 2025-07-17 | 13F | Sound Income Strategies, LLC | 77 | 0,00 | 9 | 14,29 | ||||
| 2025-08-06 | 13F | Moors & Cabot, Inc. | 1 869 | 210 | ||||||
| 2025-07-17 | 13F | Janney Montgomery Scott LLC | 7 389 | 4,31 | 1 | |||||
| 2025-08-06 | 13F | New Millennium Group LLC | 7 | 0,00 | 1 | |||||
| 2025-07-24 | 13F | Ronald Blue Trust, Inc. | 130 | 0,00 | 15 | 16,67 | ||||
| 2025-08-01 | 13F | Envestnet Asset Management Inc | 9 555 | 3,96 | 1 073 | 20,43 | ||||
| 2025-08-14 | 13F | Stifel Financial Corp | 2 564 | 1,67 | 288 | 18,03 | ||||
| 2025-08-13 | 13F | Jones Financial Companies Lllp | 7 090 | 55,93 | 792 | 79,37 | ||||
| 2025-08-04 | 13F | Pensionmark Financial Group, Llc | 15 989 | 40,28 | 1 796 | 62,44 | ||||
| 2025-08-08 | 13F | Avantax Advisory Services, Inc. | 17 542 | −10,51 | 1 970 | 3,63 | ||||
| 2025-08-14 | 13F | Susquehanna International Group, Llp | 4 103 | −69,31 | 461 | −64,53 | ||||
| 2025-05-13 | 13F | HighTower Advisors, LLC | 0 | −100,00 | 0 | −100,00 | ||||
| 2025-08-13 | 13F | Hsbc Holdings Plc | 700 747 | 78 708 | ||||||
| 2025-08-13 | 13F | Northern Trust Corp | 3 953 | 444 | ||||||
| 2025-07-21 | 13F | Ntv Asset Management Llc | 1 900 | 213 | ||||||
| 2025-08-13 | 13F | Marshall Wace, Llp | 2 368 | −31,14 | 266 | −20,42 | ||||
| 2025-08-13 | 13F | GeoWealth Management, LLC | 15 455 | 1 736 | ||||||
| 2025-08-14 | 13F | Jane Street Group, Llc | 0 | −100,00 | 0 | |||||
| 2025-08-12 | 13F | J.w. Cole Advisors, Inc. | 2 510 | 282 | ||||||
| 2025-08-14 | 13F | Quantinno Capital Management LP | 36 252 | 1,59 | 4 072 | 17,59 | ||||
| 2025-04-17 | 13F | Grimes & Company, Inc. | 0 | −100,00 | 0 | |||||
| 2025-08-18 | 13F/A | National Bank Of Canada /fi/ | 788 | −46,97 | 88 | −38,89 | ||||
| 2025-08-04 | 13F | Assetmark, Inc | 34 | 0,00 | 4 | 0,00 | ||||
| 2025-08-15 | 13F | CI Private Wealth, LLC | 32 911 | 92,66 | 3 697 | 123,05 | ||||
| 2025-08-14 | 13F | Bank Of America Corp /de/ | 295 753 | 427,49 | 33 219 | 510,74 | ||||
| 2025-05-13 | 13F | Hartland & Co., LLC | 0 | −100,00 | 0 | |||||
| 2025-08-07 | 13F | Parkside Financial Bank & Trust | 462 | 52 | ||||||
| 2025-08-08 | 13F | Creative Planning | 2 135 | 0,00 | 240 | 15,46 | ||||
| 2025-07-30 | 13F | LGT Financial Advisors LLC | 126 | 0,00 | 14 | 16,67 | ||||
| 2025-08-13 | 13F | Pictet Asset Management Holding SA | 288 000 | 333,08 | 32 155 | 398,30 | ||||
| 2025-08-13 | 13F | Continuum Advisory, LLC | 0 | −100,00 | 0 | |||||
| 2025-07-31 | 13F | CVA Family Office, LLC | 700 | 0,00 | 79 | 16,42 | ||||
| 2025-08-04 | 13F | Arkadios Wealth Advisors | 1 914 | 215 | ||||||
| 2025-07-24 | 13F | Blair William & Co/il | 85 | 0,00 | 10 | 12,50 | ||||
| 2025-08-13 | 13F | Cerity Partners LLC | 18 011 | 4,65 | 2 023 | 21,15 | ||||
| 2025-07-15 | 13F | Fifth Third Bancorp | 1 108 | 0,00 | 124 | 15,89 | ||||
| 2025-08-04 | 13F | Creative Financial Designs Inc /adv | 2 305 | 0,00 | 259 | 15,70 | ||||
| 2025-08-18 | 13F | Front Row Advisors LLC | 718 | −16,32 | 81 | −3,61 | ||||
| 2025-07-17 | 13F | Youngs Advisory Group, Inc. | 2 825 | 10,57 | 318 | 28,23 | ||||
| 2025-07-24 | 13F | IFP Advisors, Inc | 51 | −45,16 | 6 | −44,44 | ||||
| 2025-03-21 | 13F | Prostatis Group LLC | 0 | −100,00 | 0 | |||||
| 2025-08-13 | 13F | Cresset Asset Management, LLC | 15 842 | −7,29 | 1 779 | 7,36 | ||||
| 2025-08-14 | 13F | Hrt Financial Lp | 0 | −100,00 | 0 | |||||
| 2025-08-14 | 13F | Comerica Bank | 463 | 0,00 | 52 | 18,18 | ||||
| 2025-08-12 | 13F | Global Retirement Partners, LLC | 77 | 9 | ||||||
| 2025-08-12 | 13F | MAI Capital Management | 6 881 | 0,01 | 773 | 15,74 | ||||
| 2025-08-14 | 13F | Wells Fargo & Company/mn | 75 678 | −1,43 | 8 500 | 14,12 | ||||
| 2025-08-14 | 13F | UBS Group AG | 28 017 | −17,21 | 3 147 | −4,17 | ||||
| 2025-08-12 | 13F | BlackRock, Inc. | 81 399 | 0,21 | 9 143 | 16,02 | ||||
| 2025-08-12 | 13F | AlphaCore Capital LLC | 11 | 0,00 | 1 | 0,00 | ||||
| 2025-08-14 | 13F | Vivaldi Capital Management, LLC | 2 135 | 240 | ||||||
| 2025-08-26 | 13F/A | Thrivent Financial For Lutherans | 10 966 | −7,46 | 1 | 0,00 | ||||
| 2025-08-14 | 13F | Fmr Llc | 1 065 | 8,45 | 120 | 25,26 | ||||
| 2025-08-14 | 13F | CoreCap Advisors, LLC | 119 | 0,00 | 13 | 18,18 | ||||
| 2025-08-12 | 13F | One Charles Private Wealth Services, LLC | 3 988 | 5,39 | 448 | 21,80 | ||||
| 2025-08-04 | 13F | Spire Wealth Management | 175 | 0,00 | 20 | 18,75 | ||||
| 2025-04-29 | 13F | Raleigh Capital Management Inc. | 0 | −100,00 | 0 | |||||
| 2025-07-09 | 13F | Breakwater Investment Management | 201 | 0,00 | 23 | 15,79 | ||||
| 2025-08-14 | 13F | Federation des caisses Desjardins du Quebec | 3 332 | 0,00 | 374 | 15,79 | ||||
| 2025-08-15 | 13F | Morgan Stanley | 194 359 | 3,35 | 21 830 | 19,65 | ||||
| 2025-08-11 | 13F | Principal Securities, Inc. | 0 | 0 | ||||||
| 2025-08-11 | 13F | Independent Advisor Alliance | 0 | −100,00 | 0 | |||||
| 2025-08-11 | 13F | Citigroup Inc | 96 | 0,00 | 11 | 11,11 | ||||
| 2025-08-12 | 13F | Laurel Wealth Advisors LLC | 2 161 | 10 705,00 | 0 | −100,00 | ||||
| 2025-07-08 | 13F | Nbc Securities, Inc. | 316 | −3,66 | 0 | |||||
| 2025-08-14 | 13F | Gotham Asset Management, LLC | 2 037 | 229 | ||||||
| 2025-08-07 | 13F | Winch Advisory Services, LLC | 137 | 0,00 | 15 | 15,38 | ||||
| 2025-08-12 | 13F | Pathstone Holdings, LLC | 6 132 | 0,00 | 689 | 15,82 | ||||
| 2025-07-25 | 13F | Atria Wealth Solutions, Inc. | 0 | −100,00 | 0 | |||||
| 2025-07-02 | 13F | Central Pacific Bank - Trust Division | 61 | 0,00 | 7 | 20,00 | ||||
| 2025-07-25 | 13F | Sequoia Financial Advisors, LLC | 2 403 | 270 | ||||||
| 2025-08-14 | 13F | Gen-Wealth Partners Inc | 100 | 0,00 | 11 | 22,22 | ||||
| 2025-07-31 | 13F | Cambridge Investment Research Advisors, Inc. | 1 800 | 0 | ||||||
| 2025-07-08 | 13F | Parallel Advisors, LLC | 1 270 | 104,84 | 143 | 136,67 | ||||
| 2025-07-17 | 13F | Global Trust Asset Management, LLC | 22 | 0,00 | 2 | 0,00 | ||||
| 2025-08-11 | 13F | TD Waterhouse Canada Inc. | 225 | 0,00 | 25 | 19,05 | ||||
| 2025-07-16 | 13F/A | CX Institutional | 92 | 0 | ||||||
| 2025-08-12 | 13F | LPL Financial LLC | 66 129 | 14,81 | 7 428 | 32,91 | ||||
| 2025-08-07 | 13F | Bradley & Co. Private Wealth Management, LLC | 350 | 0,00 | 39 | 18,18 | ||||
| 2025-08-14 | 13F | Raymond James Financial Inc | 12 726 | 3,09 | 1 429 | 19,38 | ||||
| 2025-08-13 | 13F | Northwestern Mutual Wealth Management Co | 152 | 17 | ||||||
| 2025-07-25 | 13F | Johnson Investment Counsel Inc | 2 400 | 0,00 | 270 | 15,95 | ||||
| 2025-08-14 | 13F | GWM Advisors LLC | 30 022 | 611,08 | 3 372 | 724,45 | ||||
| 2025-08-13 | 13F | Green Harvest Asset Management LLC | 399 185 | 25,28 | 44 836 | 45,04 | ||||
| 2025-08-14 | 13F | Sunbelt Securities, Inc. | 2 451 | 22,06 | 237 | 21,65 | ||||
| 2025-08-07 | 13F | Midwest Trust Co | 6 250 | 702 | ||||||
| 2025-08-11 | 13F | Capital Square, LLC | 1 900 | 209 | ||||||
| 2025-08-14 | 13F | Citadel Advisors Llc | 0 | −100,00 | 0 | |||||
| 2025-04-22 | 13F | Synergy Financial Management, LLC | 0 | −100,00 | 0 |
Other Listings
| MX:IXP |