Grundläggande statistik
| Institutionella ägare | 96 total, 96 long only, 0 short only, 0 long/short - change of −3,96% MRQ |
| Genomsnittlig portföljallokering | 0.0812 % - change of −36,08% MRQ |
| Institutionella aktier (lång) | 3 247 643 (ex 13D/G) - change of −0,70MM shares −17,76% MRQ |
| Institutionellt värde (lång) | $ 59 067 USD ($1000) |
Institutionellt ägande och aktieägare
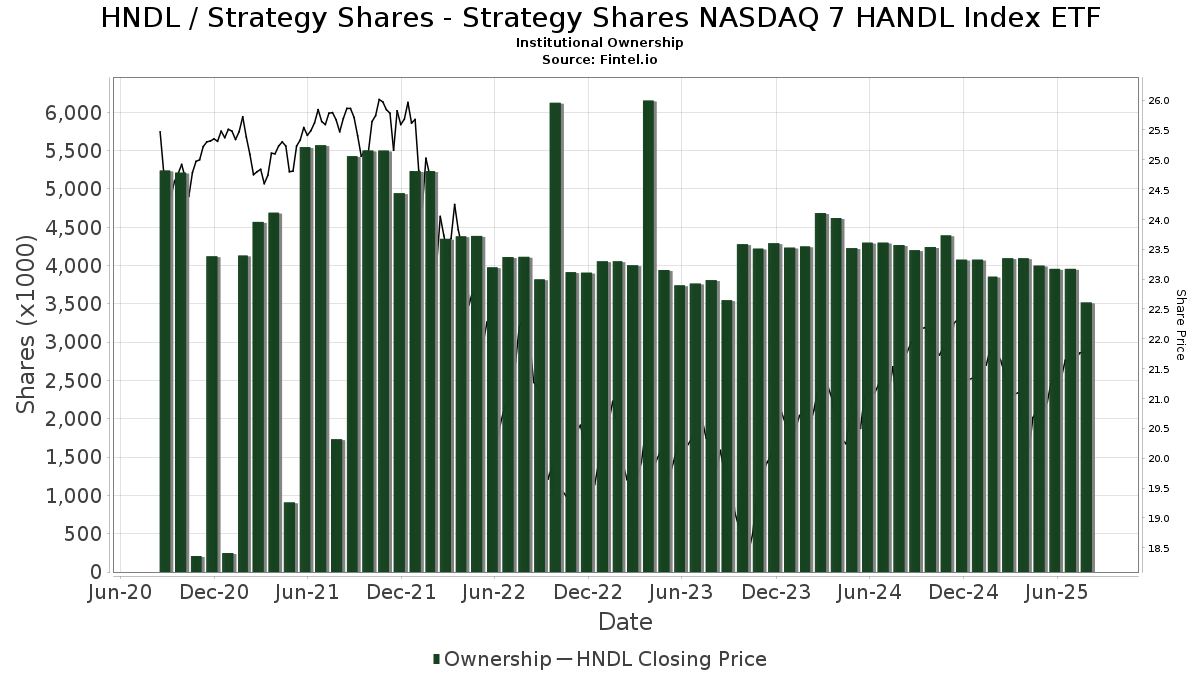
Strategy Shares - Strategy Shares NASDAQ 7 HANDL Index ETF (US:HNDL) har 96 Institutionella ägare och aktieägare som har lämnat in 13D/G- eller 13F-formulär till Securities Exchange Commission (SEC). Dessa institut innehar totalt 3,247,643 aktier. Största aktieägare inkluderar LPL Financial LLC, Cambridge Investment Research Advisors, Inc., Advisor Group Holdings, Inc., Mercer Global Advisors Inc /adv, Private Advisor Group, LLC, Berger Financial Group, Inc, Cetera Investment Advisers, Newbridge Financial Services Group, Inc., Creative Planning, and MFUL - Mindful Conservative ETF .
Strategy Shares - Strategy Shares NASDAQ 7 HANDL Index ETF (NasdaqGM:HNDL) Institutionell ägarstruktur visar institutioners och fonders nuvarande positioner i företaget, samt de senaste förändringarna i positionernas storlek. Större aktieägare kan vara enskilda investerare, fonder, hedgefonder eller institutioner. Bilaga 13D visar att investeraren äger (eller ägde) mer än 5% av företaget och avser (eller avsåg) att aktivt eftersträva en förändring av affärsstrategin. Schedule 13G indikerar en passiv investering på över 5%.
The share price as of September 19, 2025 is 22,18 / share. Previously, on September 23, 2024, the share price was 22,25 / share. This represents a decline of 0,31% over that period.
Fondsentimentets poäng
Fondsentimentet poängen(fka Ägarackumulation-poäng) visar vilka aktier som är mest köpta av fonder. Det är resultatet av en sofistikerad kvantitativ flerfaktormodell som identifierar företag med de högsta nivåerna av institutionell ackumulering. Poängsättningsmodellen använder en kombination av den totala ökningen av redovisade ägare, förändringarna i portföljallokeringarna för dessa ägare och andra mått. Siffran sträcker sig från 0 till 100, där högre siffror indikerar en högre nivå av ackumulering i förhållande till sina konkurrenter, och 50 är genomsnittet.
Uppdateringsfrekvens: Dagligen
Se Ownership Explorer, som innehåller en lista över de högst rankade företagen.
AI+ Ask Fintel’s AI assistant about Strategy Shares - Strategy Shares NASDAQ 7 HANDL Index ETF.
Thinking of good questions…
Institutionell sälj/köp-kvot
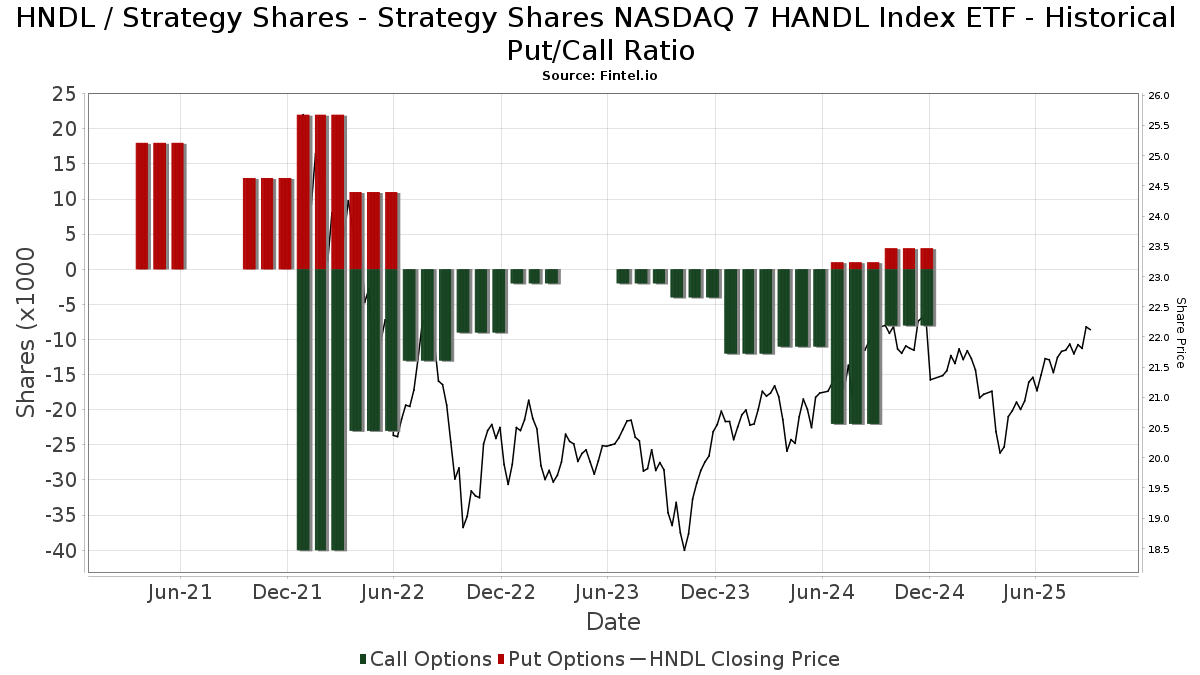
Förutom att rapportera vanliga eget kapital- och skuldemissioner måste institutioner med mer än 100MM tillgångar under förvaltning också avslöja sina innehav av sälj- och köpoptioner. Eftersom säljoptioner i allmänhet indikerar ett negativt sentiment och köpoptioner indikerar ett positivt sentiment, kan vi få en uppfattning om det övergripande institutionella sentimentet genom att plotta förhållandet mellan säljoptioner och köpoptioner. Diagrammet till höger visar det historiska förhållandet mellan sälj- och köpoptioner för detta instrument.
Genom att använda sälj/köp-kvoten som en indikator på aktieägarnas sentiment undviker man en av de största bristerna med att använda det totala institutionella ägandet, nämligen att en betydande del av de förvaltade tillgångarna investeras passivt för att följa index. Passivt förvaltade fonder köper vanligtvis inte optioner, så indikatorn för sälj/köp-kvoten ger en bättre bild av stämningen i aktivt förvaltade fonder.
13F- och NPORT-arkiveringar
Detaljer om 13F-arkiveringar är gratis. Detaljer om NP-arkiveringar kräver ett premiummedlemskap. Gröna rader indikerar nya positioner. Röda rader indikerar stängda positioner. Klicka på länk symbolen för att se hela transaktionshistoriken.
Uppgradera
för att låsa upp premiumdata och exportera till Excel ![]() .
.
| Fil Datum | Källa | Investerare | Typ | Genomsnittligt pris (beräknat) |
Aktier | Δ Aktier (%) |
Rapporterat värde (1000 USD) |
Δ Värde (%) |
Portföljallokering (%) |
|
|---|---|---|---|---|---|---|---|---|---|---|
| 2025-05-16 | 13F | Coppell Advisory Solutions LLC | 0 | −100,00 | 0 | |||||
| 2025-08-05 | 13F | GPS Wealth Strategies Group, LLC | 4 597 | 0,00 | 100 | 3,13 | ||||
| 2025-08-12 | 13F | LPL Financial LLC | 774 802 | 8,01 | 16 782 | 10,93 | ||||
| 2025-07-28 | 13F | Harbour Investments, Inc. | 42 882 | −6,96 | 929 | −4,53 | ||||
| 2025-07-29 | 13F | Stratos Wealth Partners, LTD. | 10 621 | −4,14 | 230 | −1,29 | ||||
| 2025-07-22 | 13F | Coastal Investment Advisors, Inc. | 10 362 | −1,33 | 224 | 1,36 | ||||
| 2025-08-14 | 13F | Sunbelt Securities, Inc. | 400 | 0,00 | 9 | 0,00 | ||||
| 2025-08-15 | 13F | Morgan Stanley | 11 463 | −15,51 | 248 | −13,29 | ||||
| 2025-07-21 | 13F | Patriot Financial Group Insurance Agency, LLC | 0 | −100,00 | 0 | |||||
| 2025-08-04 | 13F | Creative Financial Designs Inc /adv | 1 | 0,00 | 0 | |||||
| 2025-08-14 | 13F | Susquehanna International Group, Llp | 0 | −100,00 | 0 | |||||
| 2025-05-15 | 13F | Tower Research Capital LLC (TRC) | 0 | −100,00 | 0 | |||||
| 2025-05-15 | 13F | Citadel Advisors Llc | Call | 0 | −100,00 | 0 | −100,00 | |||
| 2025-07-08 | 13F | Nbc Securities, Inc. | 4 759 | −31,98 | 0 | |||||
| 2025-08-12 | 13F | Steward Partners Investment Advisory, Llc | 462 | 0,00 | 10 | 11,11 | ||||
| 2025-08-01 | 13F | Advisory Alpha, LLC | 11 776 | −1,32 | 255 | 1,59 | ||||
| 2025-08-15 | 13F | Asset Allocation Strategies LLC | 20 932 | −54,55 | 453 | −53,35 | ||||
| 2025-08-14 | 13F | UBS Group AG | 0 | −100,00 | 0 | |||||
| 2025-08-12 | 13F | Jpmorgan Chase & Co | 48 439 | 7,63 | 1 049 | 10,54 | ||||
| 2025-08-28 | NP | MFUL - Mindful Conservative ETF | 64 780 | −22,92 | 1 403 | −21,71 | ||||
| 2025-08-06 | 13F | AE Wealth Management LLC | 0 | −100,00 | 0 | |||||
| 2025-07-31 | 13F | Glass Jacobson Investment Advisors llc | 155 | 0,00 | 3 | 0,00 | ||||
| 2025-05-09 | 13F | Commonwealth Financial Services, LLC | 0 | −100,00 | 0 | |||||
| 2025-08-11 | 13F | Private Advisor Group, LLC | 119 079 | −5,78 | 2 579 | −3,23 | ||||
| 2025-05-15 | 13F | Citadel Advisors Llc | Put | 0 | −100,00 | 0 | −100,00 | |||
| 2025-08-11 | 13F | Hexagon Capital Partners LLC | 0 | −100,00 | 0 | |||||
| 2025-07-21 | 13F | New Century Financial Group, LLC | 0 | −100,00 | 0 | |||||
| 2025-08-08 | 13F | Cetera Investment Advisers | 99 633 | 0,20 | 2 158 | 2,91 | ||||
| 2025-07-11 | 13F | Farther Finance Advisors, LLC | 10 946 | −8,15 | 237 | −5,58 | ||||
| 2025-07-24 | 13F | Ronald Blue Trust, Inc. | 3 | 0 | ||||||
| 2025-08-11 | 13F | Principal Securities, Inc. | 0 | −100,00 | 0 | |||||
| 2025-08-12 | 13F | Proequities, Inc. | 0 | 0 | ||||||
| 2025-08-19 | 13F | Asset Dedication, LLC | 565 | −12,54 | 12 | −7,69 | ||||
| 2025-07-22 | 13F | Wealthcare Advisory Partners LLC | 13 496 | 0,33 | 292 | 3,18 | ||||
| 2025-07-28 | 13F | BRYN MAWR TRUST Co | 1 610 | 0,00 | 35 | 3,03 | ||||
| 2025-08-14 | 13F | Fmr Llc | 330 | −41,90 | 7 | −36,36 | ||||
| 2025-08-06 | 13F | Commonwealth Equity Services, Llc | 61 641 | −2,86 | 1 | 0,00 | ||||
| 2025-08-12 | 13F | CIBC Private Wealth Group, LLC | 208 | 1,96 | 5 | 33,33 | ||||
| 2025-08-14 | 13F | Royal Bank Of Canada | 0 | −100,00 | 0 | |||||
| 2025-08-08 | 13F | Creative Planning | 64 833 | 11,95 | 1 404 | 14,99 | ||||
| 2025-08-14 | 13F | Wells Fargo & Company/mn | 101 | −94,55 | 2 | −94,87 | ||||
| 2025-07-30 | 13F | St. Johns Investment Management Company, LLC | 0 | −100,00 | 0 | |||||
| 2025-08-19 | 13F | Cape Investment Advisory, Inc. | 200 | 0,00 | 4 | 0,00 | ||||
| 2025-08-14 | 13F | Federation des caisses Desjardins du Quebec | 275 | 0,00 | 6 | 0,00 | ||||
| 2025-07-16 | 13F | Cadent Capital Advisors, LLC | 30 638 | −8,92 | 664 | −6,49 | ||||
| 2025-07-25 | 13F | We Are One Seven, LLC | 11 759 | −14,54 | 255 | −12,41 | ||||
| 2025-08-01 | 13F | Envestnet Asset Management Inc | 38 044 | −5,20 | 824 | −2,60 | ||||
| 2025-08-14 | 13F | Mariner, LLC | 0 | −100,00 | 0 | |||||
| 2025-05-02 | 13F | Apollon Wealth Management, LLC | 0 | −100,00 | 0 | |||||
| 2025-08-11 | 13F | Western Wealth Management, LLC | 9 312 | 202 | ||||||
| 2025-07-24 | 13F | Us Bancorp \de\ | 1 750 | 0,00 | 38 | 2,78 | ||||
| 2025-08-14 | 13F | Old Mission Capital Llc | 63 732 | 54 371,79 | 1 380 | 68 900,00 | ||||
| 2025-07-28 | 13F | Mutual Advisors, LLC | 12 000 | 0,00 | 261 | 5,69 | ||||
| 2025-08-13 | 13F | Capital Analysts, Inc. | 229 | 10,10 | 0 | |||||
| 2025-08-08 | 13F | Gts Securities Llc | 15 246 | 330 | ||||||
| 2025-08-12 | 13F | Park Square Financial Group, LLC | 180 | 0,00 | 4 | 0,00 | ||||
| 2025-07-28 | 13F | RFG Advisory, LLC | 52 025 | 0,69 | 1 127 | 3,40 | ||||
| 2025-07-09 | 13F | Massmutual Trust Co Fsb/adv | 9 857 | 0,00 | 214 | 2,90 | ||||
| 2025-08-11 | 13F | Cornerstone Planning Group LLC | 39 | 1 | ||||||
| 2025-08-14 | 13F | Jane Street Group, Llc | 13 249 | 287 | ||||||
| 2025-08-14 | 13F | Raymond James Financial Inc | 7 923 | 172 | ||||||
| 2025-07-24 | 13F | IFP Advisors, Inc | 900 | 200,00 | 20 | 216,67 | ||||
| 2025-08-14 | 13F | GWM Advisors LLC | 33 175 | −4,87 | 719 | −2,31 | ||||
| 2025-08-11 | 13F | VSM Wealth Advisory, LLC | 309 | 33,19 | 7 | 50,00 | ||||
| 2025-07-07 | 13F | Investors Research Corp | 503 | 0,00 | 11 | 0,00 | ||||
| 2025-08-01 | 13F | Gwn Securities Inc. | 0 | −100,00 | 0 | |||||
| 2025-08-18 | 13F | Geneos Wealth Management Inc. | 1 300 | 1 200,00 | 28 | 1 300,00 | ||||
| 2025-04-29 | 13F | Lee Danner & Bass Inc | 0 | −100,00 | 0 | |||||
| 2025-08-18 | 13F | Hollencrest Capital Management | 975 | 0,00 | 21 | 5,00 | ||||
| 2025-07-11 | 13F | OxenFree Capital LLC | 50 445 | 4,15 | 1 093 | 14,59 | ||||
| 2025-08-04 | 13F | Arkadios Wealth Advisors | 14 395 | 50,56 | 312 | 54,73 | ||||
| 2025-07-17 | 13F | Vermillion Wealth Management, Inc. | 500 | 0,00 | 11 | 0,00 | ||||
| 2025-08-11 | 13F | Regal Investment Advisors LLC | 0 | −100,00 | 0 | |||||
| 2025-07-31 | 13F | Cambridge Investment Research Advisors, Inc. | 376 982 | 0,69 | 8 | 14,29 | ||||
| 2025-08-13 | 13F | Continuum Advisory, LLC | 0 | −100,00 | 0 | |||||
| 2025-07-07 | 13F | Insight Wealth Strategies, LLC | 17 152 | 1,69 | 371 | 4,23 | ||||
| 2025-07-30 | 13F | IMG Wealth Management, Inc. | 6 704 | 11,23 | 145 | 14,17 | ||||
| 2025-07-21 | 13F | Ameritas Advisory Services, LLC | 2 965 | 64 | ||||||
| 2025-08-14 | 13F | Mml Investors Services, Llc | 60 765 | −6,12 | 1 | 0,00 | ||||
| 2025-07-10 | 13F | Atticus Wealth Management, Llc | 782 | 17 | ||||||
| 2025-07-16 | 13F | St Germain D J Co Inc | 700 | 0,00 | 15 | 7,14 | ||||
| 2025-08-13 | 13F | Johnson Financial Group, Inc. | 972 | 0,00 | 21 | 5,00 | ||||
| 2025-07-25 | 13F | Atria Wealth Solutions, Inc. | 9 285 | 201 | ||||||
| 2025-08-05 | 13F | Huntington National Bank | 6 | |||||||
| 2025-07-29 | 13F | Private Wealth Management Group, LLC | 852 | 0,00 | 18 | 5,88 | ||||
| 2025-07-16 | 13F | PFS Partners, LLC | 11 | 0 | ||||||
| 2025-08-04 | 13F | Spire Wealth Management | 17 031 | −34,84 | 369 | −33,21 | ||||
| 2025-08-11 | 13F | Nations Financial Group Inc, /ia/ /adv | 16 800 | 27,27 | 364 | 30,58 | ||||
| 2025-08-14 | 13F | Mercer Global Advisors Inc /adv | 136 614 | −68,92 | 2 959 | −68,08 | ||||
| 2025-08-08 | 13F | Avantax Advisory Services, Inc. | 42 007 | −4,84 | 910 | −2,26 | ||||
| 2025-05-15 | 13F | Hrt Financial Lp | 0 | −100,00 | 0 | |||||
| 2025-08-14 | 13F | CoreCap Advisors, LLC | 12 089 | 0,17 | 262 | 2,76 | ||||
| 2025-08-15 | 13F | Kestra Advisory Services, LLC | 10 507 | 228 | ||||||
| 2025-08-12 | 13F | MAI Capital Management | 1 838 | 0,11 | 40 | 2,63 | ||||
| 2025-08-12 | 13F | Bokf, Na | 1 011 | 0,00 | 22 | 0,00 | ||||
| 2025-08-01 | 13F | Motco | 0 | −100,00 | 0 | |||||
| 2025-07-14 | 13F | Sowell Financial Services LLC | 40 096 | 5,66 | 868 | 8,50 | ||||
| 2025-07-22 | 13F | Berger Financial Group, Inc | 107 301 | −0,46 | 2 324 | 2,24 | ||||
| 2025-08-19 | 13F | Newbridge Financial Services Group, Inc. | 98 109 | −5,47 | 2 125 | −2,88 | ||||
| 2025-07-22 | 13F | Accel Wealth Management | 31 477 | −0,07 | 682 | 2,56 | ||||
| 2025-07-15 | 13F | Retireful, LLC | 64 780 | 1 403 | ||||||
| 2025-08-04 | 13F | Assetmark, Inc | 145 | 1 218,18 | 3 | |||||
| 2025-08-04 | 13F | WNY Asset Management, LLC | 10 608 | −22,06 | 230 | −20,21 | ||||
| 2025-07-15 | 13F | North Star Investment Management Corp. | 500 | 0,00 | 11 | 0,00 | ||||
| 2025-05-09 | 13F | GeoWealth Management, LLC | 0 | −100,00 | 0 | −100,00 | ||||
| 2025-05-14 | 13F | Caitlin John, LLC | 0 | −100,00 | 0 | |||||
| 2025-07-09 | 13F | Dynamic Advisor Solutions LLC | 18 183 | 0,26 | 394 | 2,88 | ||||
| 2025-07-23 | 13F | Kingswood Wealth Advisors, Llc | 0 | −100,00 | 0 | −100,00 | ||||
| 2025-08-14 | 13F | Sequent Planning LLC | 12 927 | 280 | ||||||
| 2025-08-05 | 13F | Fourth Dimension Wealth, LLC | 5 | −99,01 | 0 | −100,00 | ||||
| 2025-08-05 | 13F | BEAM Asset Management, LLC | 22 981 | −1,72 | 498 | 0,81 | ||||
| 2025-04-15 | 13F | Capital Advisory Group Advisory Services, LLC | 0 | −100,00 | 0 | |||||
| 2025-07-15 | 13F | Main Street Group, LTD | 0 | −100,00 | 0 | |||||
| 2025-08-08 | 13F | Larson Financial Group LLC | 51 865 | 19,13 | 1 123 | 22,33 | ||||
| 2025-08-11 | 13F | Aptus Capital Advisors, LLC | 2 102 | 0,00 | 46 | 2,27 | ||||
| 2025-09-04 | 13F/A | Advisor Group Holdings, Inc. | 204 633 | −2,19 | 4 432 | 0,45 | ||||
| 2025-08-07 | 13F | Allworth Financial LP | 8 190 | 0,32 | 177 | 5,99 | ||||
| 2025-08-12 | 13F | J.w. Cole Advisors, Inc. | 47 601 | 51,47 | 1 031 | 55,74 | ||||
| 2025-08-01 | 13F | Vision Financial Markets Llc | 500 | 1,83 | 11 | 0,00 | ||||
| 2025-07-25 | 13F | Cwm, Llc | 14 768 | 0,01 | 0 | |||||
| 2025-08-12 | 13F | Virtu Financial LLC | 0 | −100,00 | 0 | |||||
| 2025-07-09 | 13F | Key Client Fiduciary Advisors, LLC | 0 | −100,00 | 0 | |||||
| 2025-07-10 | 13F | Ferguson Wellman Capital Management, Inc | 10 100 | 219 | ||||||
| 2025-07-23 | 13F | Bellevue Asset Management, Llc | 350 | 0,00 | 8 | 0,00 | ||||
| 2025-08-14 | 13F | Bank Of America Corp /de/ | 1 470 | 32 | ||||||
| 2025-08-08 | 13F | Pnc Financial Services Group, Inc. | 0 | −100,00 | 0 | |||||
| 2025-08-11 | 13F | HighTower Advisors, LLC | 21 763 | 0,09 | 471 | 2,84 | ||||
| 2025-08-14 | 13F | Citadel Advisors Llc | 14 286 | 309 |