Grundläggande statistik
| Institutionella ägare | 159 total, 159 long only, 0 short only, 0 long/short - change of 3,25% MRQ |
| Genomsnittlig portföljallokering | 0.4050 % - change of −11,38% MRQ |
| Institutionella aktier (lång) | 46 387 017 (ex 13D/G) - change of 0,94MM shares 2,08% MRQ |
| Institutionellt värde (lång) | $ 867 689 USD ($1000) |
Institutionellt ägande och aktieägare
First Trust Exchange-Traded Fund IV - First Trust Limited Duration Investment Grade Corporate ETF (US:FSIG) har 159 Institutionella ägare och aktieägare som har lämnat in 13D/G- eller 13F-formulär till Securities Exchange Commission (SEC). Dessa institut innehar totalt 46,387,017 aktier. Största aktieägare inkluderar Morgan Stanley, LPL Financial LLC, Wells Fargo & Company/mn, First Trust Advisors Lp, LDSF - First Trust Low Duration Strategic Focus ETF, Ameriprise Financial Inc, Royal Bank Of Canada, Csenge Advisory Group, Envestnet Asset Management Inc, and Raymond James Financial Inc .
First Trust Exchange-Traded Fund IV - First Trust Limited Duration Investment Grade Corporate ETF (ARCA:FSIG) Institutionell ägarstruktur visar institutioners och fonders nuvarande positioner i företaget, samt de senaste förändringarna i positionernas storlek. Större aktieägare kan vara enskilda investerare, fonder, hedgefonder eller institutioner. Bilaga 13D visar att investeraren äger (eller ägde) mer än 5% av företaget och avser (eller avsåg) att aktivt eftersträva en förändring av affärsstrategin. Schedule 13G indikerar en passiv investering på över 5%.
The share price as of September 8, 2025 is 19,28 / share. Previously, on September 9, 2024, the share price was 19,23 / share. This represents an increase of 0,26% over that period.

Fondsentimentets poäng
Fondsentimentet poängen(fka Ägarackumulation-poäng) visar vilka aktier som är mest köpta av fonder. Det är resultatet av en sofistikerad kvantitativ flerfaktormodell som identifierar företag med de högsta nivåerna av institutionell ackumulering. Poängsättningsmodellen använder en kombination av den totala ökningen av redovisade ägare, förändringarna i portföljallokeringarna för dessa ägare och andra mått. Siffran sträcker sig från 0 till 100, där högre siffror indikerar en högre nivå av ackumulering i förhållande till sina konkurrenter, och 50 är genomsnittet.
Uppdateringsfrekvens: Dagligen
Se Ownership Explorer, som innehåller en lista över de högst rankade företagen.
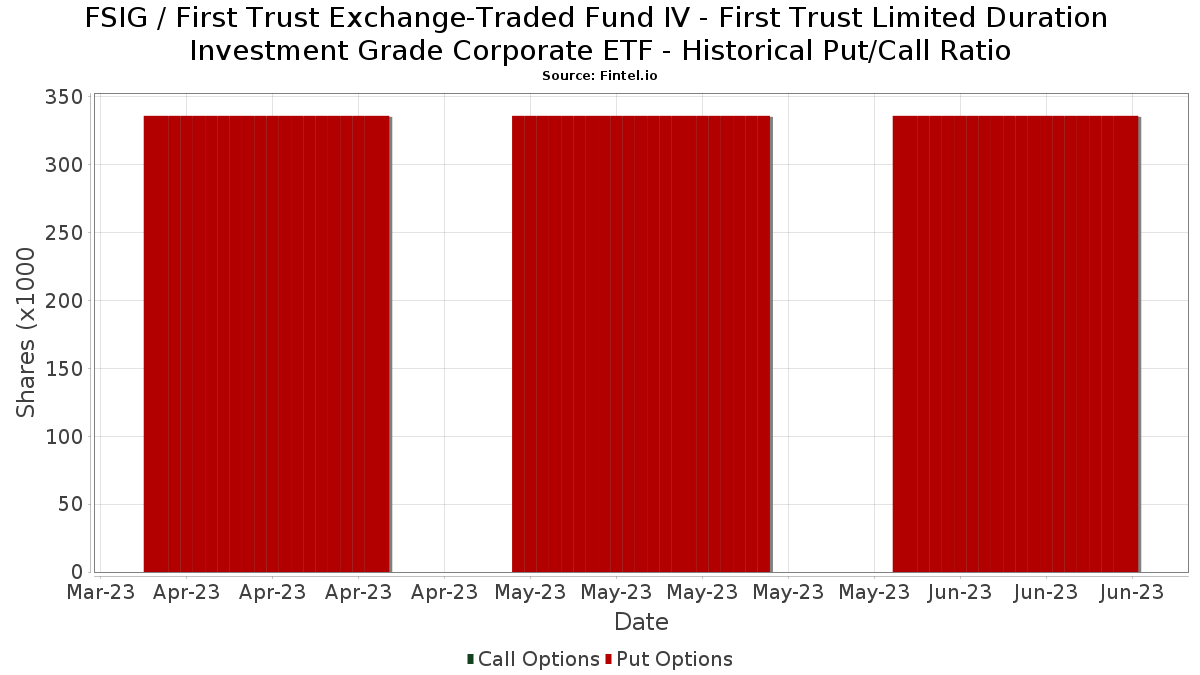
Institutionell sälj/köp-kvot
Förutom att rapportera vanliga eget kapital- och skuldemissioner måste institutioner med mer än 100MM tillgångar under förvaltning också avslöja sina innehav av sälj- och köpoptioner. Eftersom säljoptioner i allmänhet indikerar ett negativt sentiment och köpoptioner indikerar ett positivt sentiment, kan vi få en uppfattning om det övergripande institutionella sentimentet genom att plotta förhållandet mellan säljoptioner och köpoptioner. Diagrammet till höger visar det historiska förhållandet mellan sälj- och köpoptioner för detta instrument.
Genom att använda sälj/köp-kvoten som en indikator på aktieägarnas sentiment undviker man en av de största bristerna med att använda det totala institutionella ägandet, nämligen att en betydande del av de förvaltade tillgångarna investeras passivt för att följa index. Passivt förvaltade fonder köper vanligtvis inte optioner, så indikatorn för sälj/köp-kvoten ger en bättre bild av stämningen i aktivt förvaltade fonder.
13D/G-Arkiveringar
Vi presenterar 13D/G-arkiveringar separat från 13F-arkiveringar på grund av att de behandlas olika av SEC. 13D/G-arkiveringar kan lämnas in av grupper av investerare (med en ledare), medan 13F-arkiveringar inte kan det. Detta leder till situationer där en investerare kan lämna in en 13D/G-ansökan med ett värde för de totala aktierna (vilket motsvarar alla aktier som ägs av investerargruppen), men sedan lämna in en 13F-ansökan med ett annat värde för de totala aktierna (vilket motsvarar enbart deras eget ägande). Detta innebär att aktieägandet i 13D/G-arkiveringar och 13F-arkiveringar ofta inte är direkt jämförbara, så vi presenterar dem separat.
Notera: Från och med den 16 maj 2021 visar vi inte längre ägare som inte har lämnat in en 13D/G under det senaste året. Tidigare visade vi hela historiken för 13D/G-arkiveringar. I allmänhet måste enheter som är skyldiga att lämna in 13D/G-arkiveringar lämna in minst en gång per år innan de lämnar in en stängningsarkivering. Fonder avslutar dock ibland positioner utan att lämna in en avslutande arkivering (dvs. de avvecklar), så att visa hela historiken resulterade ibland i förvirring om det nuvarande ägandet. För att förhindra förvirring visar vi nu endast "nuvarande" ägare - det vill säga ägare som har lämnat in en ansökan under det senaste året.
Upgrade to unlock premium data.
| Fil Datum | Formulär | Investerare | Föregående aktier |
Senaste aktier |
Δ Aktier (Procent) |
Ägande (Procent) |
Δ Ägande (Procent) |
|
|---|---|---|---|---|---|---|---|---|
| 2025-04-16 | FIRST TRUST PORTFOLIOS LP | 10,516,965 | 13,979,138 | 32.92 | 20.14 | -8.58 |
13F- och NPORT-arkiveringar
Detaljer om 13F-arkiveringar är gratis. Detaljer om NP-arkiveringar kräver ett premiummedlemskap. Gröna rader indikerar nya positioner. Röda rader indikerar stängda positioner. Klicka på länk symbolen för att se hela transaktionshistoriken.
Uppgradera
för att låsa upp premiumdata och exportera till Excel ![]() .
.
| Fil Datum | Källa | Investerare | Typ | Genomsnittligt pris (beräknat) |
Aktier | Δ Aktier (%) |
Rapporterat värde (1000 USD) |
Δ Värde (%) |
Portföljallokering (%) |
|
|---|---|---|---|---|---|---|---|---|---|---|
| 2025-08-14 | 13F | Two Sigma Securities, Llc | 0 | −100,00 | 0 | |||||
| 2025-08-14 | 13F | Wells Fargo & Company/mn | 3 297 148 | 2,13 | 63 041 | 3,10 | ||||
| 2025-08-13 | 13F | Virtue Capital Management, LLC | 0 | −100,00 | 0 | |||||
| 2025-04-10 | 13F | TrueWealth Advisors, LLC | 0 | −100,00 | 0 | −100,00 | ||||
| 2025-07-15 | 13F | EWG Elevate Inc. | 205 087 | −0,42 | 3 921 | 0,54 | ||||
| 2025-08-08 | 13F | Larson Financial Group LLC | 800 | 0,00 | 15 | 0,00 | ||||
| 2025-05-15 | 13F/A | Orion Portfolio Solutions, LLC | 103 247 | −4,52 | 1 955 | −4,17 | ||||
| 2025-07-16 | 13F | Perigon Wealth Management, LLC | 14 623 | 0,00 | 280 | 1,09 | ||||
| 2025-07-17 | 13F | Wagner Wealth Management, Llc | 629 | −21,77 | 12 | −20,00 | ||||
| 2025-08-14 | 13F | Comerica Bank | 26 923 | 13,92 | 515 | 14,99 | ||||
| 2025-08-11 | 13F | Core Wealth Partners LLC | 0 | −100,00 | 0 | |||||
| 2025-08-11 | 13F | Principal Securities, Inc. | 2 788 | −4,91 | 53 | −3,64 | ||||
| 2025-08-08 | 13F | Kingsview Wealth Management, LLC | 59 330 | 7,93 | 1 134 | 8,93 | ||||
| 2025-08-13 | 13F | Twin Peaks Wealth Advisors, LLC | 24 243 | −1,09 | 465 | 0,43 | ||||
| 2025-08-04 | 13F | Arkadios Wealth Advisors | 13 668 | 11,41 | 261 | 12,50 | ||||
| 2025-07-24 | 13F | WMG Financial Advisors, LLC | 13 064 | −4,19 | 250 | −3,49 | ||||
| 2025-07-14 | 13F | Iams Wealth Management, Llc | 76 126 | 0,06 | 1 456 | 0,97 | ||||
| 2025-08-13 | 13F | Transce3nd, LLC | 62 | 0,00 | 1 | 0,00 | ||||
| 2025-08-06 | 13F | Csenge Advisory Group | 1 818 613 | −0,15 | 34 535 | 0,11 | ||||
| 2025-08-14 | 13F | Goldman Sachs Group Inc | 14 039 | −80,54 | 268 | −80,38 | ||||
| 2025-08-14 | 13F | Susquehanna International Group, Llp | 185 514 | 108,01 | 3 547 | 110,01 | ||||
| 2025-08-08 | 13F | Cetera Investment Advisers | 674 383 | −0,87 | 12 894 | 0,08 | ||||
| 2025-08-06 | 13F | Golden State Wealth Management, LLC | 22 608 | 432 | ||||||
| 2025-07-31 | 13F | Cambridge Investment Research Advisors, Inc. | 425 394 | −20,34 | 8 | −20,00 | ||||
| 2025-04-21 | 13F | PSI Advisors, LLC | 0 | −100,00 | 0 | |||||
| 2025-07-25 | 13F | Envestnet Portfolio Solutions, Inc. | 339 463 | −16,23 | 6 491 | −15,44 | ||||
| 2025-08-14 | 13F | Visionary Wealth Advisors | 72 097 | −45,11 | 1 378 | −44,59 | ||||
| 2025-08-29 | 13F | Centaurus Financial, Inc. | 6 099 | 0,00 | 0 | |||||
| 2025-07-24 | 13F | Blair William & Co/il | 694 | 13 | ||||||
| 2025-08-04 | 13F | Merkkuri Wealth Advisors LLC | 18 046 | −3,21 | 345 | −2,27 | ||||
| 2025-08-07 | 13F | PFG Advisors | 16 149 | −23,44 | 309 | −22,81 | ||||
| 2025-08-18 | 13F | Geneos Wealth Management Inc. | 2 871 | 68,68 | 55 | 68,75 | ||||
| 2025-08-11 | 13F | Synergy Investment Management, LLC | 0 | −100,00 | 0 | |||||
| 2025-08-14 | 13F | Raymond James Financial Inc | 1 025 541 | 13,69 | 19 608 | 14,77 | ||||
| 2025-07-21 | 13F | Barrett & Company, Inc. | 7 000 | 0,00 | 134 | 0,76 | ||||
| 2025-08-25 | NP | FTBI - First Trust Balanced Income ETF | 7 074 | 135 | ||||||
| 2025-08-12 | 13F | SRS Capital Advisors, Inc. | 15 738 | 187,35 | 301 | 191,26 | ||||
| 2025-07-08 | 13F | Nbc Securities, Inc. | 2 687 | −27,96 | 0 | |||||
| 2025-07-22 | 13F | DAVENPORT & Co LLC | 139 709 | −0,47 | 2 671 | 0,49 | ||||
| 2025-08-14 | 13F | Wiley Bros.-aintree Capital, Llc | 302 832 | −1,43 | 5 789 | −2,20 | ||||
| 2025-07-28 | 13F | RFG Advisory, LLC | 47 859 | 30,24 | 915 | 31,65 | ||||
| 2025-08-14 | 13F | Old Mission Capital Llc | 69 169 | −83,23 | 1 323 | −83,08 | ||||
| 2025-08-14 | 13F | Harvest Investment Services, LLC | 70 358 | −1,94 | 1 345 | −0,96 | ||||
| 2025-07-30 | 13F | D.a. Davidson & Co. | 105 648 | 22,96 | 2 020 | 24,09 | ||||
| 2025-07-14 | 13F | GAMMA Investing LLC | 259 | 0,00 | 5 | 0,00 | ||||
| 2025-08-15 | 13F | Fsb Premier Wealth Management, Inc. | 120 089 | 16,51 | 2 296 | 17,62 | ||||
| 2025-08-04 | 13F | Pensionmark Financial Group, Llc | 13 523 | −37,96 | 259 | −37,38 | ||||
| 2025-08-14 | 13F | CoreCap Advisors, LLC | 30 | 1 | ||||||
| 2025-07-24 | 13F | IFP Advisors, Inc | 3 975 | −72,52 | 76 | −72,53 | ||||
| 2025-07-31 | 13F | Moloney Securities Asset Management, LLC | 10 450 | 1,10 | 200 | 2,05 | ||||
| 2025-07-25 | 13F | Cwm, Llc | 1 903 | 95,38 | 0 | |||||
| 2025-07-28 | 13F | Harbour Investments, Inc. | 45 124 | 12,11 | 863 | 13,12 | ||||
| 2025-08-12 | 13F | Gladstone Institutional Advisory LLC | 10 760 | 6,28 | 206 | 7,33 | ||||
| 2025-08-13 | 13F | Stenger Family Office, LLC | 113 744 | 2 169 | ||||||
| 2025-07-29 | 13F | Private Trust Co Na | 17 090 | −9,37 | 327 | −8,68 | ||||
| 2025-08-13 | 13F | Maia Wealth LLC | 37 167 | −11,10 | 711 | −9,78 | ||||
| 2025-07-29 | 13F | Koshinski Asset Management, Inc. | 16 556 | 12,50 | 317 | 13,67 | ||||
| 2025-08-13 | 13F | Flow Traders U.s. Llc | 54 280 | −40,13 | 1 | 0,00 | ||||
| 2025-08-14 | 13F | Benjamin Edwards Inc | 172 489 | 23,08 | 3 298 | 24,23 | ||||
| 2025-08-04 | 13F | Creative Financial Designs Inc /adv | 19 821 | −12,41 | 379 | −11,68 | ||||
| 2025-08-08 | 13F | Capital Investment Advisory Services, LLC | 750 | −73,68 | 14 | −73,58 | ||||
| 2025-08-13 | 13F | Continuum Advisory, LLC | 47 176 | 39,30 | 902 | 40,72 | ||||
| 2025-08-14 | 13F | Integrated Wealth Concepts LLC | 420 921 | −0,80 | 8 048 | 0,15 | ||||
| 2025-08-12 | 13F | LPL Financial LLC | 7 030 503 | 7,52 | 134 423 | 8,54 | ||||
| 2025-08-15 | 13F | Global View Capital Management LLC | 0 | −100,00 | 0 | |||||
| 2025-08-06 | 13F | Tradewinds, LLC. | 18 046 | 345 | ||||||
| 2025-08-06 | 13F | Vestmark Advisory Solutions, Inc. | 930 458 | 100,25 | 17 790 | 102,16 | ||||
| 2025-09-04 | 13F/A | Advisor Group Holdings, Inc. | 899 735 | 8,30 | 17 191 | 9,25 | ||||
| 2025-08-14 | 13F | Acorn Wealth Advisors, LLC | 10 480 | 200 | ||||||
| 2025-08-07 | 13F | Kestra Private Wealth Services, Llc | 79 252 | 1,21 | 1 515 | 2,16 | ||||
| 2025-08-04 | 13F | Daymark Wealth Partners, Llc | 52 371 | 3,70 | 1 001 | 4,71 | ||||
| 2025-08-06 | 13F | Commonwealth Equity Services, Llc | 144 594 | 8,93 | 3 | 0,00 | ||||
| 2025-04-18 | 13F | Prosperity Wealth Management, Inc. | 0 | −100,00 | 0 | |||||
| 2025-05-12 | 13F | Independent Advisor Alliance | 0 | −100,00 | 0 | |||||
| 2025-08-08 | 13F | Avantax Advisory Services, Inc. | 62 562 | −31,35 | 1 196 | −30,67 | ||||
| 2025-07-11 | 13F | Pinnacle Bancorp, Inc. | 3 206 | 0,00 | 61 | 1,67 | ||||
| 2025-08-14 | 13F | Mariner, LLC | 58 335 | 18,44 | 1 115 | 19,64 | ||||
| 2025-07-28 | 13F | Naviter Wealth, LLC | 0 | −100,00 | 0 | |||||
| 2025-08-04 | 13F | IFG Advisory, LLC | 74 279 | −59,23 | 1 420 | −58,84 | ||||
| 2025-08-11 | 13F | Aptus Capital Advisors, LLC | 46 150 | 2,56 | 882 | 3,52 | ||||
| 2025-08-13 | 13F | StoneX Group Inc. | 20 789 | 5,39 | 397 | 6,43 | ||||
| 2025-05-01 | 13F | Quest 10 Wealth Builders, Inc. | 1 063 | −7,89 | 20 | −4,76 | ||||
| 2025-08-12 | 13F | TCP Asset Management, LLC | 239 261 | 2,14 | 4 575 | 3,11 | ||||
| 2025-08-13 | 13F | Capital Analysts, Inc. | 12 602 | −4,61 | 0 | |||||
| 2025-07-17 | 13F | Janney Montgomery Scott LLC | 151 904 | −26,60 | 3 | −33,33 | ||||
| 2025-08-12 | 13F | Proequities, Inc. | 0 | 0 | ||||||
| 2025-07-18 | 13F | Truist Financial Corp | 874 139 | 45,10 | 16 714 | 46,48 | ||||
| 2025-08-12 | 13F | Archer Investment Corp | 119 210 | 1,83 | 2 279 | 2,80 | ||||
| 2025-08-13 | 13F | Jones Financial Companies Lllp | 271 909 | 61,51 | 5 193 | 62,99 | ||||
| 2025-08-12 | 13F | Global Retirement Partners, LLC | 9 972 | 21,46 | 191 | 23,38 | ||||
| 2025-08-12 | 13F | Park Square Financial Group, LLC | 94 991 | −23,02 | 1 816 | −22,29 | ||||
| 2025-07-15 | 13F | FLP Wealth Management, LLC | 0 | −100,00 | 0 | |||||
| 2025-05-12 | 13F | Ameritas Investment Partners, Inc. | 0 | −100,00 | 0 | |||||
| 2025-07-10 | 13F | Kmg Fiduciary Partners, Llc | 415 564 | 11,63 | 7 946 | 12,70 | ||||
| 2025-07-25 | NP | LDSF - First Trust Low Duration Strategic Focus ETF This fund is a listed as child fund of First Trust Advisors Lp and if that institution has disclosed ownership in this security, then these positions will not be double counted when calculating total shares and total value | 2 280 230 | −1,38 | 43 302 | −1,48 | ||||
| 2025-07-09 | 13F | Beacon Financial Group | 52 292 | 0,00 | 1 000 | 0,91 | ||||
| 2025-07-31 | 13F | Oppenheimer & Co Inc | 55 808 | −2,96 | 1 067 | −2,02 | ||||
| 2025-07-28 | 13F | Mutual Advisors, LLC | 68 390 | −41,33 | 1 304 | −41,05 | ||||
| 2025-08-14 | 13F | BancorpSouth Bank | 10 269 | 0,00 | 196 | 1,03 | ||||
| 2025-07-30 | 13F | Insight Advisors, LLC/ PA | 138 739 | 2,17 | 2 653 | 3,15 | ||||
| 2025-07-30 | 13F | TFB Advisors LLC | 31 319 | 1,27 | 599 | 2,22 | ||||
| 2025-07-23 | 13F | Tcfg Wealth Management, Llc | 23 168 | −18,34 | 443 | −17,69 | ||||
| 2025-07-30 | 13F | Rehmann Capital Advisory Group | 135 768 | −1,82 | 2 596 | −0,92 | ||||
| 2025-08-05 | 13F | Sigma Planning Corp | 75 075 | −47,85 | 1 435 | −47,36 | ||||
| 2025-08-14 | 13F | Sequent Planning LLC | 47 611 | 2,02 | 910 | 3,06 | ||||
| 2025-08-14 | 13F | Stifel Financial Corp | 742 502 | −17,32 | 14 196 | −16,54 | ||||
| 2025-08-15 | 13F | Kestra Advisory Services, LLC | 154 327 | −10,96 | 2 951 | −10,12 | ||||
| 2025-08-14 | 13F | Hilltop Holdings Inc. | 48 879 | 4,73 | 935 | 5,78 | ||||
| 2025-07-14 | 13F | U.S. Capital Wealth Advisors, LLC | 103 294 | 10,13 | 1 975 | 11,15 | ||||
| 2025-08-15 | 13F | Morgan Stanley | 10 547 138 | 4,17 | 201 661 | 5,16 | ||||
| 2025-08-01 | 13F | Envestnet Asset Management Inc | 1 636 675 | 19,63 | 31 293 | 20,77 | ||||
| 2025-08-14 | 13F | Sunbelt Securities, Inc. | 317 | 6 | ||||||
| 2025-07-01 | 13F | Private Client Services, Llc | 10 867 | 0,00 | 208 | 0,98 | ||||
| 2025-08-12 | 13F | J.w. Cole Advisors, Inc. | 45 178 | 4,95 | 864 | 5,89 | ||||
| 2025-08-14 | 13F | Royal Bank Of Canada | 1 923 182 | −0,53 | 36 772 | 0,42 | ||||
| 2025-08-14 | 13F | Mml Investors Services, Llc | 75 145 | −11,40 | 1 | 0,00 | ||||
| 2025-04-10 | 13F | Clarus Wealth Advisors | 0 | −100,00 | 0 | |||||
| 2025-07-29 | 13F | Stephens Inc /ar/ | 738 771 | −5,27 | 14 125 | −4,37 | ||||
| 2025-08-12 | 13F | Leigh Baldwin & Co., Llc | 13 850 | 3,75 | 265 | 4,76 | ||||
| 2025-07-21 | 13F | Ameritas Advisory Services, LLC | 7 579 | 145 | ||||||
| 2025-08-13 | 13F | First Trust Advisors Lp | 2 549 886 | 12,16 | 48 754 | 13,22 | ||||
| 2025-08-12 | 13F | Steward Partners Investment Advisory, Llc | 40 638 | −0,98 | 777 | −0,13 | ||||
| 2025-07-14 | 13F | Park Avenue Securities Llc | 86 383 | −0,36 | 2 | 0,00 | ||||
| 2025-07-11 | 13F | Essex Savings Bank | 15 079 | 0,00 | 288 | 1,05 | ||||
| 2025-07-29 | 13F | Stratos Wealth Advisors, LLC | 10 740 | 205 | ||||||
| 2025-08-13 | 13F | Gateway Wealth Partners, LLC | 24 856 | −15,92 | 475 | −15,03 | ||||
| 2025-08-06 | 13F | Walkner Condon Financial Advisors LLC | 0 | −100,00 | 0 | |||||
| 2025-08-14 | 13F | Ameriprise Financial Inc | 2 223 405 | 5,15 | 42 498 | 6,06 | ||||
| 2025-08-14 | 13F | Mpwm Advisory Solutions, Llc | 572 | 11 | ||||||
| 2025-05-12 | 13F | Fmr Llc | 0 | −100,00 | 0 | |||||
| 2025-07-24 | 13F | Us Bancorp \de\ | 15 499 | 296 | ||||||
| 2025-07-14 | 13F | Signature Securities Group Corporation | 12 795 | 0,31 | 245 | 1,24 | ||||
| 2025-08-04 | 13F | Assetmark, Inc | 500 517 | 5,76 | 9 570 | 6,76 | ||||
| 2025-08-11 | 13F | Platform Technology Partners | 87 427 | −0,17 | 1 672 | 0,78 | ||||
| 2025-08-14 | 13F | LaSalle St. Investment Advisors, LLC | 26 141 | 2,07 | 0 | |||||
| 2025-08-13 | 13F | GeoWealth Management, LLC | 0 | −100,00 | 0 | |||||
| 2025-08-14 | 13F | Pinnacle Family Advisors, LLC | 10 473 | 200 | ||||||
| 2025-07-28 | 13F | WJ Wealth Management, LLC | 233 411 | −16,45 | 4 463 | −15,67 | ||||
| 2025-08-06 | 13F | Prospera Financial Services Inc | 47 402 | 6,83 | 906 | 7,86 | ||||
| 2025-08-14 | 13F | IHT Wealth Management, LLC | 10 084 | −34,49 | 193 | −34,02 | ||||
| 2025-05-02 | 13F | Capital A Wealth Management, LLC | 0 | −100,00 | 0 | |||||
| 2025-08-14 | 13F | Harwood Advisory Group, LLC | 35 474 | −10,60 | 678 | −9,36 | ||||
| 2025-07-16 | 13F | American National Bank | 193 | 0,00 | 4 | 0,00 | ||||
| 2025-08-05 | 13F | Key FInancial Inc | 1 496 | 29 | ||||||
| 2025-05-16 | 13F/A | Kestra Investment Management, LLC | 0 | −100,00 | 0 | |||||
| 2025-07-29 | 13F | Stratos Wealth Partners, LTD. | 20 287 | 2,44 | 388 | 3,20 | ||||
| 2025-08-04 | 13F | Center for Financial Planning, Inc. | 151 850 | 12,46 | 2 903 | 13,53 | ||||
| 2025-08-04 | 13F | Spire Wealth Management | 25 972 | −40,44 | 497 | −39,88 | ||||
| 2025-08-14 | 13F | Guardian Wealth Advisors, Llc / Nc | 45 000 | 0,00 | 860 | 0,94 | ||||
| 2025-07-25 | 13F | Atria Wealth Solutions, Inc. | 0 | −100,00 | 0 | |||||
| 2025-07-07 | 13F | Investors Research Corp | 336 | 0,00 | 6 | 0,00 | ||||
| 2025-07-09 | 13F | VisionPoint Advisory Group, LLC | 57 858 | 1 106 | ||||||
| 2025-08-01 | 13F | Winebrenner Capital Management Llc | 29 327 | 0,00 | 561 | 0,90 | ||||
| 2025-06-25 | NP | HISF - First Trust Strategic Income ETF This fund is a listed as child fund of First Trust Advisors Lp and if that institution has disclosed ownership in this security, then these positions will not be double counted when calculating total shares and total value | 122 362 | −47,24 | 2 329 | −46,83 | ||||
| 2025-08-04 | 13F | Atria Investments Llc | 53 668 | 28,59 | 1 026 | 29,87 | ||||
| 2025-07-17 | 13F | Raleigh Capital Management Inc. | 1 616 | 1,13 | 31 | 0,00 | ||||
| 2025-08-08 | 13F | SBI Securities Co., Ltd. | 25 | 0,00 | 0 | |||||
| 2025-08-14 | 13F | GWM Advisors LLC | 440 360 | −14,49 | 8 420 | −13,68 | ||||
| 2025-08-14 | 13F | Snowden Capital Advisors LLC | 23 213 | 0,00 | 444 | 0,91 | ||||
| 2025-08-12 | 13F | Jpmorgan Chase & Co | 28 460 | 1 140,09 | 544 | 1 165,12 | ||||
| 2025-08-26 | NP | FIRST TRUST VARIABLE INSURANCE TRUST - First Trust Multi Income Allocation Portfolio Class I This fund is a listed as child fund of First Trust Advisors Lp and if that institution has disclosed ownership in this security, then these positions will not be double counted when calculating total shares and total value | 23 013 | −3,91 | 440 | −2,87 | ||||
| 2025-07-21 | 13F | Ameriflex Group, Inc. | 3 796 | 38,44 | 73 | 41,18 | ||||
| 2025-07-25 | 13F | Concurrent Investment Advisors, LLC | 128 114 | 6,17 | 2 450 | 7,18 | ||||
| 2025-04-17 | 13F | RiverTree Advisors, LLC | 0 | −100,00 | 0 | |||||
| 2025-08-07 | 13F | Resources Investment Advisors, LLC. | 20 156 | 12,64 | 385 | 13,91 | ||||
| 2025-08-11 | 13F | HighTower Advisors, LLC | 79 677 | 24,48 | 1 523 | 25,66 | ||||
| 2025-08-15 | 13F | Equitable Holdings, Inc. | 63 507 | 17,86 | 1 214 | 19,02 | ||||
| 2025-08-04 | 13F | Hantz Financial Services, Inc. | 264 | 0,00 | 0 | |||||
| 2025-08-27 | 13F/A | Brinker Capital Investments, LLC | 95 622 | −7,39 | 1 828 | −6,50 | ||||
| 2025-08-14 | 13F | Bank Of America Corp /de/ | 609 | −44,84 | 12 | −45,00 | ||||
| 2025-08-06 | 13F | AE Wealth Management LLC | 35 780 | −17,10 | 684 | −16,28 | ||||
| 2025-08-20 | 13F/A | Coppell Advisory Solutions LLC | 30 620 | 23,07 | 585 | 23,73 | ||||
| 2025-08-01 | 13F | Rossby Financial, LCC | 3 647 | 0,25 | 70 | 0,00 | ||||
| 2025-08-14 | 13F | Citadel Advisors Llc | 83 801 | −53,25 | 1 602 | −52,80 | ||||
| 2025-08-05 | 13F | Bank of New York Mellon Corp | 69 739 | 1,77 | 1 333 | 2,78 | ||||
| 2025-08-12 | 13F | Wealthbridge Capital Management, Llc | 71 981 | −0,25 | 1 376 | 0,73 | ||||
| 2025-08-14 | 13F | Jane Street Group, Llc | 158 757 | −43,67 | 3 035 | −43,14 | ||||
| 2025-08-11 | 13F | Private Advisor Group, LLC | 47 092 | −5,20 | 900 | −4,26 | ||||
| 2025-05-13 | 13F | Nations Financial Group Inc, /ia/ /adv | 0 | −100,00 | 0 | |||||
| 2025-08-01 | 13F | Ashton Thomas Private Wealth, LLC | 42 464 | 9,18 | 812 | 10,19 |