Grundläggande statistik
| Institutionella ägare | 144 total, 144 long only, 0 short only, 0 long/short - change of −1,37% MRQ |
| Genomsnittlig portföljallokering | 0.1834 % - change of −13,04% MRQ |
| Institutionella aktier (lång) | 7 133 878 (ex 13D/G) - change of 0,10MM shares 1,49% MRQ |
| Institutionellt värde (lång) | $ 424 000 USD ($1000) |
Institutionellt ägande och aktieägare
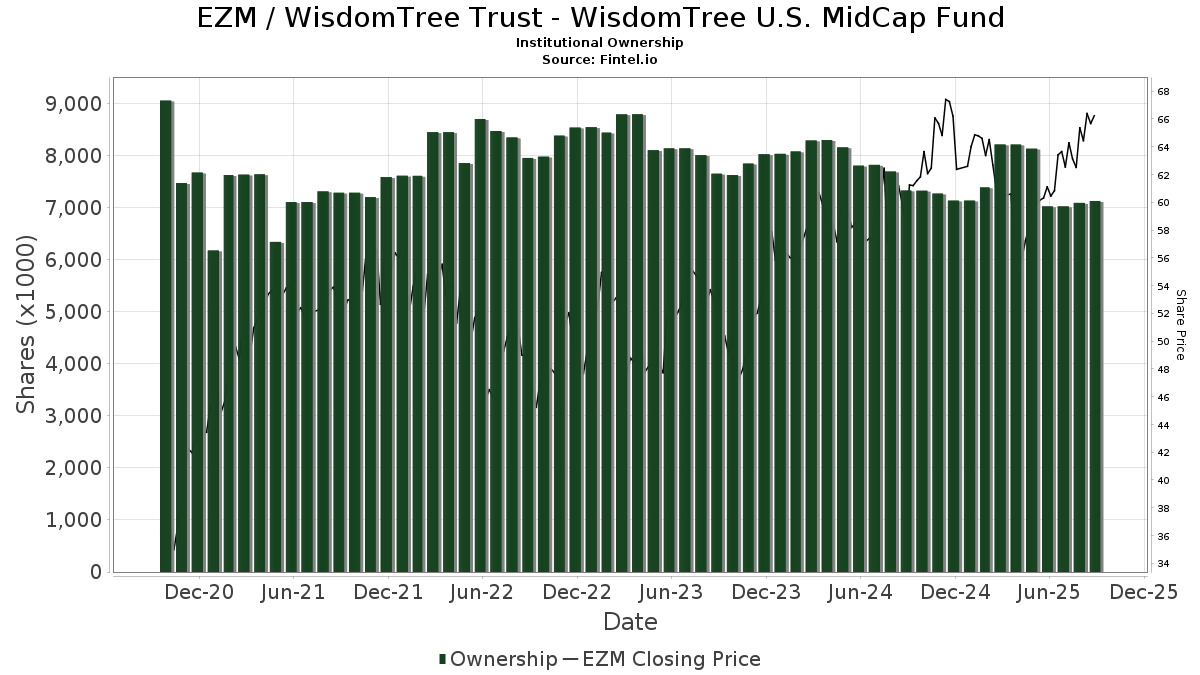
WisdomTree Trust - WisdomTree U.S. MidCap Fund (US:EZM) har 144 Institutionella ägare och aktieägare som har lämnat in 13D/G- eller 13F-formulär till Securities Exchange Commission (SEC). Dessa institut innehar totalt 7,133,878 aktier. Största aktieägare inkluderar DAVENPORT & Co LLC, UBS Group AG, Bank Of America Corp /de/, Morgan Stanley, Truist Financial Corp, Eqis Capital Management, Inc., Baird Financial Group, Inc., Private Advisor Group, LLC, Ieq Capital, Llc, and LPL Financial LLC .
WisdomTree Trust - WisdomTree U.S. MidCap Fund (ARCA:EZM) Institutionell ägarstruktur visar institutioners och fonders nuvarande positioner i företaget, samt de senaste förändringarna i positionernas storlek. Större aktieägare kan vara enskilda investerare, fonder, hedgefonder eller institutioner. Bilaga 13D visar att investeraren äger (eller ägde) mer än 5% av företaget och avser (eller avsåg) att aktivt eftersträva en förändring av affärsstrategin. Schedule 13G indikerar en passiv investering på över 5%.
The share price as of September 15, 2025 is 66,09 / share. Previously, on September 16, 2024, the share price was 60,61 / share. This represents an increase of 9,04% over that period.
Fondsentimentets poäng
Fondsentimentet poängen(fka Ägarackumulation-poäng) visar vilka aktier som är mest köpta av fonder. Det är resultatet av en sofistikerad kvantitativ flerfaktormodell som identifierar företag med de högsta nivåerna av institutionell ackumulering. Poängsättningsmodellen använder en kombination av den totala ökningen av redovisade ägare, förändringarna i portföljallokeringarna för dessa ägare och andra mått. Siffran sträcker sig från 0 till 100, där högre siffror indikerar en högre nivå av ackumulering i förhållande till sina konkurrenter, och 50 är genomsnittet.
Uppdateringsfrekvens: Dagligen
Se Ownership Explorer, som innehåller en lista över de högst rankade företagen.
Institutionell sälj/köp-kvot
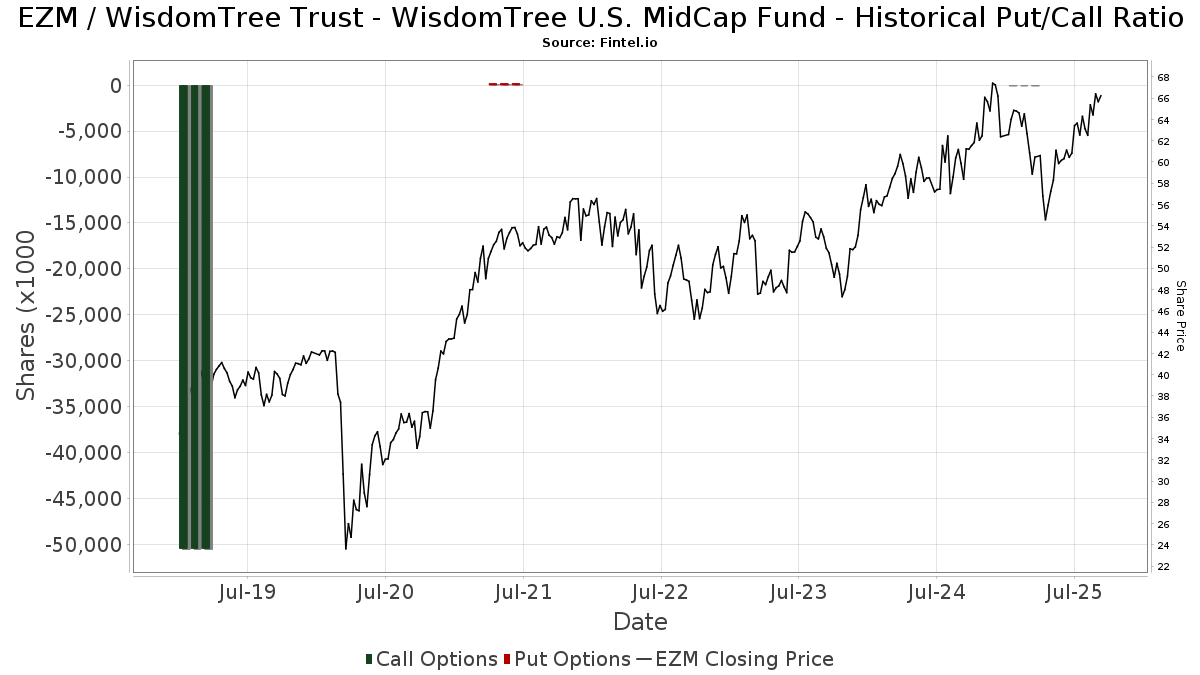
Förutom att rapportera vanliga eget kapital- och skuldemissioner måste institutioner med mer än 100MM tillgångar under förvaltning också avslöja sina innehav av sälj- och köpoptioner. Eftersom säljoptioner i allmänhet indikerar ett negativt sentiment och köpoptioner indikerar ett positivt sentiment, kan vi få en uppfattning om det övergripande institutionella sentimentet genom att plotta förhållandet mellan säljoptioner och köpoptioner. Diagrammet till höger visar det historiska förhållandet mellan sälj- och köpoptioner för detta instrument.
Genom att använda sälj/köp-kvoten som en indikator på aktieägarnas sentiment undviker man en av de största bristerna med att använda det totala institutionella ägandet, nämligen att en betydande del av de förvaltade tillgångarna investeras passivt för att följa index. Passivt förvaltade fonder köper vanligtvis inte optioner, så indikatorn för sälj/köp-kvoten ger en bättre bild av stämningen i aktivt förvaltade fonder.
13F- och NPORT-arkiveringar
Detaljer om 13F-arkiveringar är gratis. Detaljer om NP-arkiveringar kräver ett premiummedlemskap. Gröna rader indikerar nya positioner. Röda rader indikerar stängda positioner. Klicka på länk symbolen för att se hela transaktionshistoriken.
Uppgradera
för att låsa upp premiumdata och exportera till Excel ![]() .
.
| Fil Datum | Källa | Investerare | Typ | Genomsnittligt pris (beräknat) |
Aktier | Δ Aktier (%) |
Rapporterat värde (1000 USD) |
Δ Värde (%) |
Portföljallokering (%) |
|
|---|---|---|---|---|---|---|---|---|---|---|
| 2025-08-06 | 13F | Golden State Wealth Management, LLC | 1 050 | 0,00 | 65 | 3,23 | ||||
| 2025-08-19 | 13F | Newbridge Financial Services Group, Inc. | 632 | 0,00 | 39 | 5,41 | ||||
| 2025-07-21 | 13F | Ameritas Advisory Services, LLC | 225 | 14 | ||||||
| 2025-08-12 | 13F | Centric Wealth Management | 6 995 | −3,74 | 437 | 0,92 | ||||
| 2025-05-28 | 13F | Wealth Management Associates, Inc. | 0 | −100,00 | 0 | −100,00 | ||||
| 2025-07-10 | 13F | Wealth Enhancement Advisory Services, Llc | 8 842 | −6,66 | 563 | −0,35 | ||||
| 2025-08-13 | 13F | Twin Peaks Wealth Advisors, LLC | 89 | 6 | ||||||
| 2025-08-15 | 13F | Kestra Advisory Services, LLC | 19 816 | 4,44 | 1 224 | 8,32 | ||||
| 2025-08-13 | 13F | Lauer Wealth, LLC | 35 492 | −54,51 | 2 213 | −50,65 | ||||
| 2025-08-12 | 13F | Steward Partners Investment Advisory, Llc | 119 509 | 14,00 | 7 382 | 18,17 | ||||
| 2025-07-22 | 13F | Financial Insights, Inc. | 3 563 | 0,00 | 220 | 3,77 | ||||
| 2025-08-14 | 13F | UBS Group AG | 665 277 | 5,97 | 41 094 | 9,82 | ||||
| 2025-04-28 | 13F | Great Point Wealth Advisors, LLC | 59 905 | −1,95 | 3 570 | −6,52 | ||||
| 2025-07-25 | 13F | Cwm, Llc | 2 878 | 0,24 | 0 | |||||
| 2025-08-05 | 13F | GPS Wealth Strategies Group, LLC | 249 | −51,27 | 15 | −50,00 | ||||
| 2025-07-08 | 13F | Nbc Securities, Inc. | 289 | 0,00 | 0 | |||||
| 2025-07-17 | 13F | Janney Montgomery Scott LLC | 70 526 | 10,11 | 4 | 33,33 | ||||
| 2025-07-14 | 13F | S.A. Mason LLC | 6 079 | 0,00 | 376 | 3,59 | ||||
| 2025-07-17 | 13F | Oakworth Capital, Inc. | 554 | 0,00 | 34 | 3,03 | ||||
| 2025-08-01 | 13F | Financial Counselors Inc | 0 | −100,00 | 0 | |||||
| 2025-08-08 | 13F | Cetera Investment Advisers | 55 899 | −15,24 | 3 453 | −12,16 | ||||
| 2025-08-04 | 13F | Bristlecone Advisors, LLC | 200 | 0,00 | 12 | 9,09 | ||||
| 2025-07-18 | 13F | Truist Financial Corp | 416 759 | −4,06 | 25 743 | −0,56 | ||||
| 2025-07-24 | 13F | Aurora Private Wealth, Inc. | 10 934 | 0,41 | 1 | |||||
| 2025-08-14 | 13F | Ieq Capital, Llc | 205 093 | 0,00 | 12 669 | 3,64 | ||||
| 2025-07-11 | 13F | Kaydan Wealth Management, Inc. | 3 450 | 0,00 | 213 | 3,90 | ||||
| 2025-07-24 | 13F | Capital Advisors, Ltd. LLC | 1 232 | 0,00 | 0 | |||||
| 2025-08-13 | 13F | Continuum Advisory, LLC | 0 | −100,00 | 0 | |||||
| 2025-08-08 | 13F | Creative Planning | 8 762 | 1,51 | 541 | 5,25 | ||||
| 2025-08-14 | 13F | Qube Research & Technologies Ltd | 741 | −5,61 | 46 | −2,17 | ||||
| 2025-08-15 | 13F | Equitable Holdings, Inc. | 81 987 | −6,96 | 5 064 | −3,58 | ||||
| 2025-08-14 | 13F/A | Rockefeller Capital Management L.P. | 15 417 | −4,93 | 952 | −1,45 | ||||
| 2025-07-22 | 13F | Team Financial Group, LLC | 7 001 | −16,65 | 432 | −13,60 | ||||
| 2025-07-24 | 13F | Us Bancorp \de\ | 1 250 | 0,00 | 77 | 4,05 | ||||
| 2025-08-14 | 13F | Note Advisors, LLC | 0 | −100,00 | 0 | |||||
| 2025-07-15 | 13F | Mather Group, Llc. | 25 303 | −1,87 | 1 563 | 1,69 | ||||
| 2025-07-22 | 13F | DAVENPORT & Co LLC | 666 452 | 11,80 | 41 167 | 15,87 | ||||
| 2025-08-12 | 13F | Clearwater Capital Advisors, LLC | 178 844 | 4,14 | 11 047 | 7,93 | ||||
| 2025-07-24 | 13F | Blair William & Co/il | 6 808 | −2,49 | 421 | 0,96 | ||||
| 2025-08-12 | 13F | BlackRock, Inc. | 90 | 0,00 | 6 | 0,00 | ||||
| 2025-04-28 | 13F | Strategic Financial Concepts, LLC | 0 | −100,00 | 0 | −100,00 | ||||
| 2025-08-14 | 13F | Citadel Advisors Llc | 15 283 | 50,04 | 944 | 55,52 | ||||
| 2025-08-14 | 13F | Mariner, LLC | 4 404 | 16,23 | 272 | 20,89 | ||||
| 2025-07-31 | 13F | Cambridge Investment Research Advisors, Inc. | 82 954 | −18,75 | 5 | −16,67 | ||||
| 2025-07-15 | 13F | Unified Investment Management | 3 771 | 0,03 | 233 | 3,57 | ||||
| 2025-08-13 | 13F | Dana Investment Advisors, Inc. | 6 462 | 89,50 | 399 | 96,55 | ||||
| 2025-08-11 | 13F | Culbertson A N & Co Inc | 46 413 | 0,10 | 2 867 | 3,73 | ||||
| 2025-07-25 | 13F | Astoria Portfolio Advisors LLC. | 3 377 | 215 | ||||||
| 2025-08-14 | 13F | GWM Advisors LLC | 5 549 | −21,58 | 343 | −18,76 | ||||
| 2025-08-14 | 13F/A | Skopos Labs, Inc. | 141 | 0,00 | 9 | 0,00 | ||||
| 2025-05-08 | 13F | Tiaa Trust, National Association | 0 | −100,00 | 0 | −100,00 | ||||
| 2025-08-04 | 13F | Assetmark, Inc | 1 008 | 62 | ||||||
| 2025-07-30 | 13F | Whittier Trust Co Of Nevada Inc | 900 | 0,00 | 56 | 3,77 | ||||
| 2025-08-14 | 13F | Susquehanna International Group, Llp | 41 105 | 2 539 | ||||||
| 2025-07-30 | 13F | Principle Wealth Partners Llc | 3 500 | 0,00 | 216 | 3,85 | ||||
| 2025-07-07 | 13F | LBJ Family Wealth Advisors, Ltd. | 10 795 | 0,32 | 1 | |||||
| 2025-08-14 | 13F | Royal Bank Of Canada | 54 342 | 32,66 | 3 357 | 37,53 | ||||
| 2025-07-22 | 13F | Miracle Mile Advisors, LLC | 6 329 | 391 | ||||||
| 2025-08-11 | 13F | Private Advisor Group, LLC | 211 477 | 1,74 | 13 063 | 5,44 | ||||
| 2025-08-13 | 13F | Summit Financial, LLC | 18 878 | 1 166 | ||||||
| 2025-07-14 | 13F | Foster Group, Inc. | 19 275 | 1 191 | ||||||
| 2025-08-05 | 13F | Mason Investment Advisory Services, Inc. | 17 434 | 0,00 | 1 077 | 3,56 | ||||
| 2025-08-14 | 13F | Synovus Financial Corp | 82 203 | −7,92 | 5 078 | −4,57 | ||||
| 2025-07-07 | 13F | Horizons Wealth Management | 1 233 | 0,00 | 76 | 4,11 | ||||
| 2025-08-08 | 13F | Kingsview Wealth Management, LLC | 5 049 | 0,00 | 312 | 3,67 | ||||
| 2025-08-11 | 13F | Wealthspire Advisors, LLC | 6 618 | −1,80 | 409 | 1,75 | ||||
| 2025-08-14 | 13F | Glen Eagle Advisors, LLC | 306 | 0,00 | 19 | 0,00 | ||||
| 2025-05-06 | 13F | Retirement Income Solutions, Inc | 0 | −100,00 | 0 | |||||
| 2025-08-14 | 13F | Price T Rowe Associates Inc /md/ | 14 651 | 0,00 | 1 | |||||
| 2025-07-31 | 13F | CVA Family Office, LLC | 7 269 | 0,01 | 449 | 3,46 | ||||
| 2025-07-07 | 13F | Investors Research Corp | 6 695 | −0,86 | 414 | 2,74 | ||||
| 2025-08-08 | 13F | Hartland & Co., LLC | 652 | 40 | ||||||
| 2025-08-14 | 13F | D. E. Shaw & Co., Inc. | 4 191 | 0,00 | 259 | 3,61 | ||||
| 2025-08-14 | 13F | Mml Investors Services, Llc | 6 165 | 27,67 | 0 | |||||
| 2025-08-07 | 13F | Allworth Financial LP | 606 | 15,21 | 37 | 23,33 | ||||
| 2025-08-11 | 13F | Howard Wealth Management, Llc | 4 455 | 0,00 | 275 | 3,77 | ||||
| 2025-08-14 | 13F | Sunbelt Securities, Inc. | 0 | −100,00 | 0 | |||||
| 2025-08-19 | 13F | Asset Dedication, LLC | 11 963 | 0,00 | 739 | 3,65 | ||||
| 2025-08-07 | 13F | Midwest Trust Co | 4 044 | 250 | ||||||
| 2025-08-06 | 13F | AE Wealth Management LLC | 2 719 | 536,77 | 168 | 568,00 | ||||
| 2025-07-22 | 13F | Belpointe Asset Management LLC | 0 | −100,00 | 0 | |||||
| 2025-08-05 | 13F | Sensible Money, LLC | 11 866 | −1,49 | 733 | 2,09 | ||||
| 2025-08-14 | 13F | Ancora Advisors, LLC | 2 560 | 0,00 | 158 | 3,95 | ||||
| 2025-08-08 | 13F | Avantax Advisory Services, Inc. | 17 231 | 0,12 | 1 064 | 3,80 | ||||
| 2025-08-14 | 13F | Bank Of America Corp /de/ | 533 933 | 3,57 | 32 981 | 7,34 | ||||
| 2025-07-18 | 13F | Consolidated Planning Corp | 194 607 | 6,27 | 12 021 | 10,13 | ||||
| 2025-07-28 | 13F | Capital Management Corp /va | 4 710 | 2,66 | 291 | 6,23 | ||||
| 2025-08-07 | 13F | CENTRAL TRUST Co | 29 272 | 2,79 | 1 808 | 6,54 | ||||
| 2025-08-14 | 13F | Bragg Financial Advisors, Inc | 7 042 | 435 | ||||||
| 2025-08-15 | 13F | Tower Research Capital LLC (TRC) | 5 | 0 | ||||||
| 2025-08-07 | 13F | Montag A & Associates Inc | 0 | −100,00 | 0 | |||||
| 2025-08-13 | 13F | Oxler Private Wealth LLC | 10 676 | −5,51 | 659 | −2,08 | ||||
| 2025-08-12 | 13F | Proequities, Inc. | 0 | 0 | ||||||
| 2025-08-04 | 13F | Amplius Wealth Advisors, LLC | 6 650 | 411 | ||||||
| 2025-07-30 | 13F | Atlantic Edge Private Wealth Management, LLC | 45 | 0,00 | 3 | 0,00 | ||||
| 2025-08-14 | 13F | Ameriprise Financial Inc | 38 160 | 22,24 | 2 357 | 26,67 | ||||
| 2025-08-13 | 13F | Cresset Asset Management, LLC | 6 975 | 0,00 | 431 | 3,61 | ||||
| 2025-08-13 | 13F | Flow Traders U.s. Llc | 6 543 | 0 | ||||||
| 2025-08-08 | 13F | L & S Advisors Inc | 26 475 | 22,69 | 1 635 | 27,14 | ||||
| 2025-08-13 | 13F | Financial Freedom, LLC | 1 068 | 0,09 | 66 | 3,17 | ||||
| 2025-07-25 | 13F | Ruedi Wealth Management, Inc. | 0 | −100,00 | 0 | |||||
| 2025-08-12 | 13F | PSI Advisors, LLC | 7 675 | 0,00 | 474 | 3,72 | ||||
| 2025-07-21 | 13F | DHJJ Financial Advisors, Ltd. | 2 370 | 0,00 | 146 | 3,55 | ||||
| 2025-04-21 | 13F | Envestnet Portfolio Solutions, Inc. | 0 | −100,00 | 0 | |||||
| 2025-08-11 | 13F | HighTower Advisors, LLC | 174 756 | −0,95 | 10 795 | 2,65 | ||||
| 2025-08-15 | 13F | Northeast Financial Consultants Inc | 29 505 | −9,23 | 1 823 | −5,94 | ||||
| 2025-08-12 | 13F | Jpmorgan Chase & Co | 128 762 | −16,97 | 7 954 | −13,95 | ||||
| 2025-07-30 | 13F | Exencial Wealth Advisors, Llc | 0 | −100,00 | 0 | |||||
| 2025-07-18 | 13F | Vicus Capital | 4 586 | −21,30 | 283 | −18,44 | ||||
| 2025-08-13 | 13F | Baird Financial Group, Inc. | 310 148 | 6,16 | 19 158 | 10,03 | ||||
| 2025-08-05 | 13F | GHP Investment Advisors, Inc. | 40 137 | −1,56 | 2 479 | 2,02 | ||||
| 2025-07-14 | 13F | Cathy Pareto & Associates, Inc | 8 186 | −16,31 | 506 | −13,23 | ||||
| 2025-07-18 | 13F | Provident Wealth Management, LLC | 92 592 | 1,24 | 5 719 | 4,94 | ||||
| 2025-07-30 | 13F | Eqis Capital Management, Inc. | 325 994 | 4,45 | 20 137 | 8,25 | ||||
| 2025-04-29 | 13F | Bank of New York Mellon Corp | 0 | −100,00 | 0 | |||||
| 2025-08-01 | 13F | Envestnet Asset Management Inc | 90 911 | −1,61 | 5 616 | 1,98 | ||||
| 2025-08-14 | 13F | Fmr Llc | 2 865 | −23,76 | 177 | −21,08 | ||||
| 2025-05-14 | 13F | Smartleaf Asset Management LLC | 0 | −100,00 | 0 | |||||
| 2025-08-13 | 13F | Per Stirling Capital Management, LLC. | 9 737 | −2,33 | 601 | 1,18 | ||||
| 2025-08-13 | 13F | Jones Financial Companies Lllp | 1 042 | 82,17 | 64 | 93,94 | ||||
| 2025-05-08 | 13F | Harbour Investments, Inc. | 0 | −100,00 | 0 | |||||
| 2025-07-30 | 13F | Pacific Sun Financial Corp | 10 955 | 0,00 | 677 | 3,68 | ||||
| 2025-08-14 | 13F | Stifel Financial Corp | 6 336 | −18,16 | 391 | −15,18 | ||||
| 2025-08-15 | 13F | Morgan Stanley | 458 733 | 1,05 | 28 336 | 4,73 | ||||
| 2025-08-04 | 13F | Pensionmark Financial Group, Llc | 14 377 | −12,98 | 888 | −9,76 | ||||
| 2025-07-22 | 13F | Davidson Kahn Capital Management, LLC | 70 974 | 6,11 | 4 403 | 10,46 | ||||
| 2025-07-25 | 13F | Northwest Capital Management Inc | 0 | −100,00 | 0 | |||||
| 2025-07-18 | 13F | Institute for Wealth Management, LLC. | 12 790 | 0,00 | 790 | 3,67 | ||||
| 2025-08-06 | 13F | Commonwealth Equity Services, Llc | 62 634 | 2,20 | 4 | 0,00 | ||||
| 2025-08-04 | 13F | Quaker Wealth Management, LLC | Put | 0 | −100,00 | 0 | −100,00 | |||
| 2025-08-12 | 13F | LPL Financial LLC | 195 415 | −1,78 | 12 071 | 1,79 | ||||
| 2025-08-12 | 13F | Cornerstone Wealth Management, LLC | 5 717 | 25,04 | 353 | 29,78 | ||||
| 2025-07-16 | 13F | Sylvest Advisors, LLC | 38 525 | 8,69 | 2 380 | 12,64 | ||||
| 2025-09-04 | 13F/A | Advisor Group Holdings, Inc. | 28 270 | 7,96 | 1 747 | 11,85 | ||||
| 2025-07-09 | 13F | Post Resch Tallon Group Inc. | 3 440 | −7,28 | 212 | −3,64 | ||||
| 2025-08-14 | 13F | Sargent Investment Group, LLC | 7 575 | −2,95 | 474 | 1,72 | ||||
| 2025-08-04 | 13F | Creative Financial Designs Inc /adv | 547 | 0,00 | 34 | 3,13 | ||||
| 2025-07-22 | 13F | Wealthcare Advisory Partners LLC | 3 523 | 218 | ||||||
| 2025-08-14 | 13F | Warren Averett Asset Management, LLC | 12 634 | −14,93 | 780 | −11,86 | ||||
| 2025-07-24 | 13F | McKinley Carter Wealth Services, Inc. | 4 208 | 0,00 | 260 | 3,60 | ||||
| 2025-07-22 | 13F | Stanich Group LLC | 4 118 | 0,00 | 262 | 6,53 | ||||
| 2025-07-09 | 13F | Breakwater Capital Group | 91 652 | 2,70 | 5 661 | 6,45 | ||||
| 2025-07-18 | 13F | Trust Co Of Vermont | 400 | 0,00 | 25 | 4,35 | ||||
| 2025-08-13 | 13F | Northwestern Mutual Wealth Management Co | 9 620 | −1,44 | 594 | 2,24 | ||||
| 2025-07-08 | 13F | Apella Capital, LLC | 20 925 | 0,00 | 1 317 | 10,86 | ||||
| 2025-08-14 | 13F | Jane Street Group, Llc | 0 | −100,00 | 0 | |||||
| 2025-08-13 | 13F | Beacon Pointe Advisors, LLC | 6 927 | 0,00 | 428 | 3,64 | ||||
| 2025-07-29 | 13F | Crux Wealth Advisors | 30 701 | −26,15 | 1 896 | −23,46 | ||||
| 2025-08-04 | 13F | Quaker Wealth Management, LLC | 457 | 28 | ||||||
| 2025-05-13 | 13F | EPG Wealth Management LLC | 0 | −100,00 | 0 | −100,00 | ||||
| 2025-08-04 | 13F | Flagship Harbor Advisors, Llc | 25 342 | −6,48 | 1 565 | −3,10 | ||||
| 2025-08-08 | 13F | Pnc Financial Services Group, Inc. | 1 403 | 0,00 | 87 | 3,61 | ||||
| 2025-08-12 | 13F | Global Retirement Partners, LLC | 528 | −11,11 | 33 | −13,51 | ||||
| 2025-08-06 | 13F | Savant Capital, LLC | 12 000 | 0,00 | 741 | 3,64 | ||||
| 2025-08-14 | 13F | Comerica Bank | 2 970 | −8,95 | 183 | −5,67 | ||||
| 2025-08-14 | 13F | Raymond James Financial Inc | 142 634 | −11,69 | 8 811 | −8,48 | ||||
| 2025-05-12 | 13F | First Western Trust Bank | 0 | −100,00 | 0 | |||||
| 2025-08-11 | 13F | Western Wealth Management, LLC | 13 867 | −15,02 | 857 | −11,93 | ||||
| 2025-08-12 | 13F | Lionshead Wealth Management, LLC | 49 798 | −6,00 | 3 076 | −2,57 | ||||
| 2025-08-15 | 13F | Captrust Financial Advisors | 0 | −100,00 | 0 | |||||
| 2025-08-11 | 13F | Theory Financial Llc | 83 787 | 23,38 | 5 249 | 29,68 | ||||
| 2025-07-28 | 13F | Revolve Wealth Partners, LLC | 3 616 | 0,00 | 223 | 3,72 | ||||
| 2025-08-05 | 13F | NewSquare Capital LLC | 39 444 | 7,75 | 2 436 | 11,69 | ||||
| 2025-08-14 | 13F | Wells Fargo & Company/mn | 97 227 | −0,74 | 6 006 | 2,88 | ||||
| 2025-07-10 | 13F | Envision Financial LLC | 12 394 | 0,10 | 766 | 3,80 | ||||
| 2025-07-15 | 13F | RVW Wealth, LLC | 16 313 | −7,09 | 1 008 | −3,73 | ||||
| 2025-07-30 | 13F | BlueChip Wealth Advisors LLC | 3 610 | 0,00 | 223 | 3,26 | ||||
| 2025-08-14 | 13F | Two Sigma Securities, Llc | 0 | −100,00 | 0 |