Grundläggande statistik
| Institutionella ägare | 99 total, 99 long only, 0 short only, 0 long/short - change of 0,00% MRQ |
| Genomsnittlig portföljallokering | 0.1473 % - change of −15,73% MRQ |
| Institutionella aktier (lång) | 4 705 818 (ex 13D/G) - change of −0,26MM shares −5,31% MRQ |
| Institutionellt värde (lång) | $ 149 392 USD ($1000) |
Institutionellt ägande och aktieägare
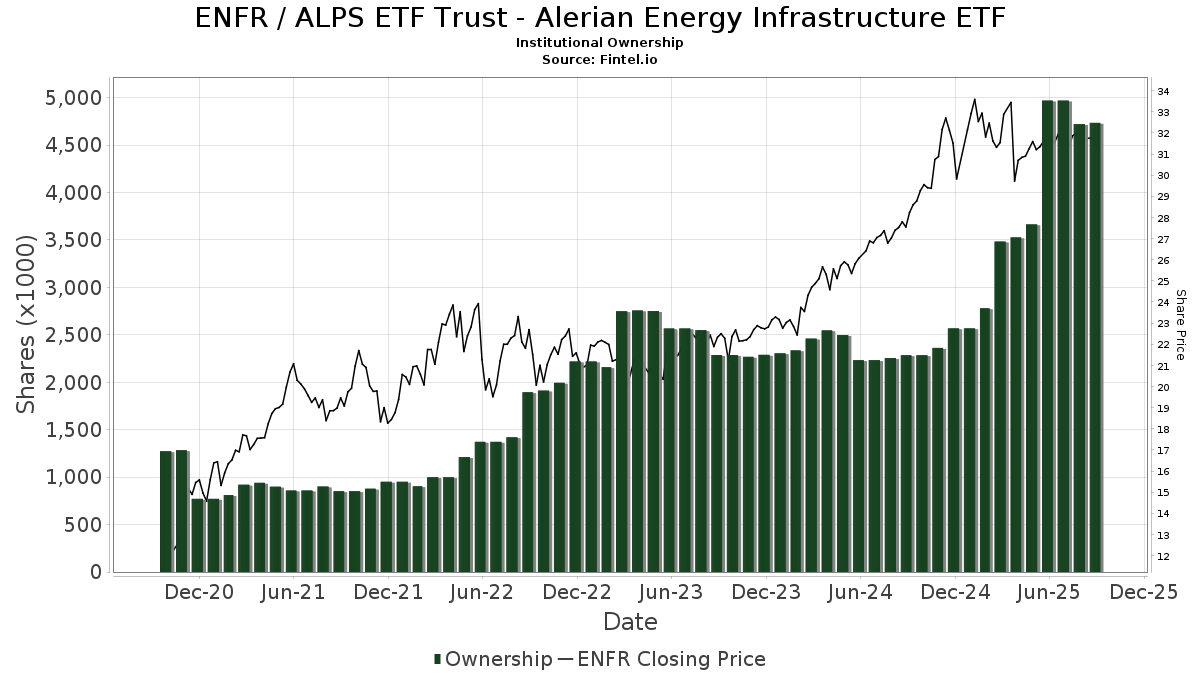
ALPS ETF Trust - Alerian Energy Infrastructure ETF (US:ENFR) har 99 Institutionella ägare och aktieägare som har lämnat in 13D/G- eller 13F-formulär till Securities Exchange Commission (SEC). Dessa institut innehar totalt 4,705,818 aktier. Största aktieägare inkluderar Raymond James Financial Inc, Wells Fargo & Company/mn, Morgan Stanley, LPL Financial LLC, UMI - USCF Midstream Energy Income Fund, Miller Howard Investments Inc /ny, Mariner, LLC, Bank Of America Corp /de/, Ameriprise Financial Inc, and WT Wealth Management .
ALPS ETF Trust - Alerian Energy Infrastructure ETF (ARCA:ENFR) Institutionell ägarstruktur visar institutioners och fonders nuvarande positioner i företaget, samt de senaste förändringarna i positionernas storlek. Större aktieägare kan vara enskilda investerare, fonder, hedgefonder eller institutioner. Bilaga 13D visar att investeraren äger (eller ägde) mer än 5% av företaget och avser (eller avsåg) att aktivt eftersträva en förändring av affärsstrategin. Schedule 13G indikerar en passiv investering på över 5%.
The share price as of September 9, 2025 is 31,53 / share. Previously, on September 10, 2024, the share price was 27,64 / share. This represents an increase of 14,07% over that period.
Fondsentimentets poäng
Fondsentimentet poängen(fka Ägarackumulation-poäng) visar vilka aktier som är mest köpta av fonder. Det är resultatet av en sofistikerad kvantitativ flerfaktormodell som identifierar företag med de högsta nivåerna av institutionell ackumulering. Poängsättningsmodellen använder en kombination av den totala ökningen av redovisade ägare, förändringarna i portföljallokeringarna för dessa ägare och andra mått. Siffran sträcker sig från 0 till 100, där högre siffror indikerar en högre nivå av ackumulering i förhållande till sina konkurrenter, och 50 är genomsnittet.
Uppdateringsfrekvens: Dagligen
Se Ownership Explorer, som innehåller en lista över de högst rankade företagen.
Institutionell sälj/köp-kvot
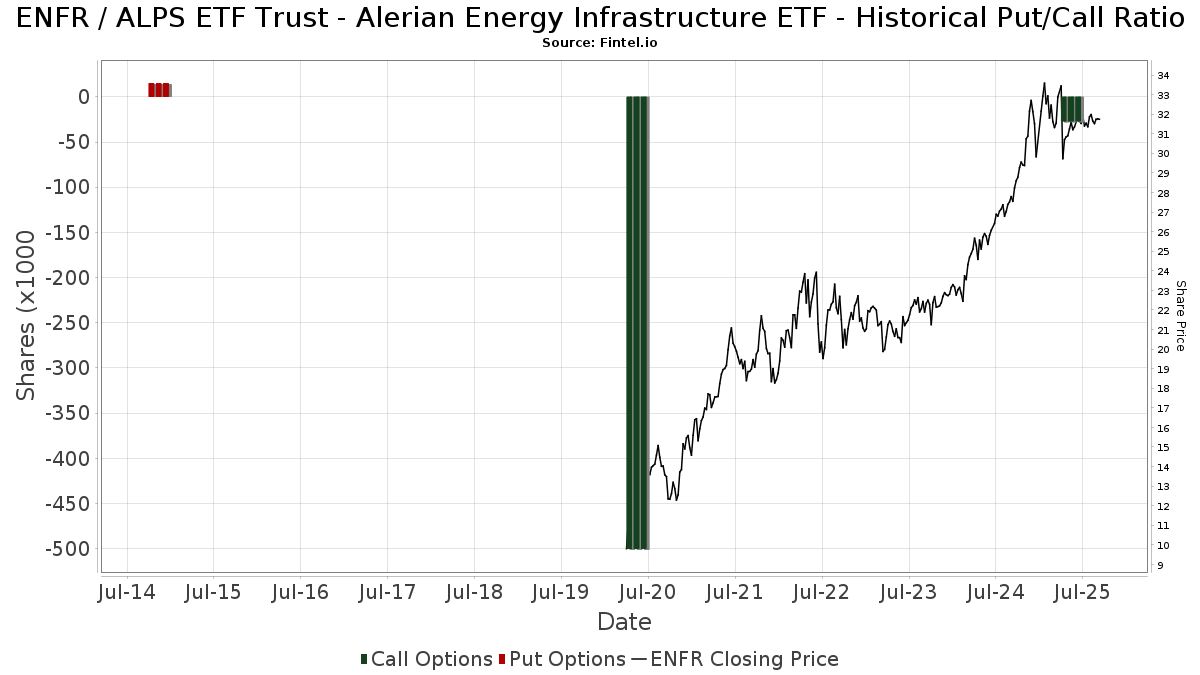
Förutom att rapportera vanliga eget kapital- och skuldemissioner måste institutioner med mer än 100MM tillgångar under förvaltning också avslöja sina innehav av sälj- och köpoptioner. Eftersom säljoptioner i allmänhet indikerar ett negativt sentiment och köpoptioner indikerar ett positivt sentiment, kan vi få en uppfattning om det övergripande institutionella sentimentet genom att plotta förhållandet mellan säljoptioner och köpoptioner. Diagrammet till höger visar det historiska förhållandet mellan sälj- och köpoptioner för detta instrument.
Genom att använda sälj/köp-kvoten som en indikator på aktieägarnas sentiment undviker man en av de största bristerna med att använda det totala institutionella ägandet, nämligen att en betydande del av de förvaltade tillgångarna investeras passivt för att följa index. Passivt förvaltade fonder köper vanligtvis inte optioner, så indikatorn för sälj/köp-kvoten ger en bättre bild av stämningen i aktivt förvaltade fonder.
13F- och NPORT-arkiveringar
Detaljer om 13F-arkiveringar är gratis. Detaljer om NP-arkiveringar kräver ett premiummedlemskap. Gröna rader indikerar nya positioner. Röda rader indikerar stängda positioner. Klicka på länk symbolen för att se hela transaktionshistoriken.
Uppgradera
för att låsa upp premiumdata och exportera till Excel ![]() .
.
| Fil Datum | Källa | Investerare | Typ | Genomsnittligt pris (beräknat) |
Aktier | Δ Aktier (%) |
Rapporterat värde (1000 USD) |
Δ Värde (%) |
Portföljallokering (%) |
|
|---|---|---|---|---|---|---|---|---|---|---|
| 2025-07-23 | 13F | Castle Rock Wealth Management, LLC | 96 186 | 30,40 | 3 013 | 24,36 | ||||
| 2025-07-10 | 13F | Capital Advisory Group Advisory Services, LLC | 40 916 | 2,89 | 1 319 | 1,23 | ||||
| 2025-08-11 | 13F | Principal Securities, Inc. | 63 | 2 | ||||||
| 2025-08-12 | 13F | Virtu Financial LLC | 0 | −100,00 | 0 | |||||
| 2025-08-15 | 13F | Kestra Advisory Services, LLC | 6 464 | −10,61 | 208 | −11,86 | ||||
| 2025-08-14 | 13F | Windsor Advisory Group, LLC | 23 000 | 0,00 | 742 | −1,59 | ||||
| 2025-08-04 | 13F | WNY Asset Management, LLC | 60 799 | −25,93 | 1 960 | −27,14 | ||||
| 2025-07-22 | 13F | Kraematon Investment Advisors, Inc | 46 827 | −0,01 | 1 510 | −1,63 | ||||
| 2025-08-12 | 13F | O'shaughnessy Asset Management, Llc | 2 434 | 0,00 | 78 | −1,27 | ||||
| 2025-07-10 | 13F | Wealth Enhancement Advisory Services, Llc | 76 103 | 6,45 | 2 426 | 3,59 | ||||
| 2025-05-09 | 13F | GeoWealth Management, LLC | 0 | −100,00 | 0 | |||||
| 2025-08-11 | 13F | Private Advisor Group, LLC | 7 943 | 9,59 | 256 | 8,02 | ||||
| 2025-08-14 | 13F | Wells Fargo & Company/mn | 356 698 | −4,34 | 11 500 | −5,88 | ||||
| 2025-08-21 | 13F | Aveo Capital Partners, LLC | 0 | −100,00 | 0 | |||||
| 2025-08-14 | 13F | Atomi Financial Group, Inc. | 19 392 | 6,17 | 625 | 4,52 | ||||
| 2025-08-06 | 13F | AE Wealth Management LLC | 0 | −100,00 | 0 | |||||
| 2025-08-12 | 13F | Steward Partners Investment Advisory, Llc | 1 648 | 185,62 | 53 | 194,44 | ||||
| 2025-08-14 | 13F | Mariner, LLC | 190 442 | −8,72 | 6 140 | −10,21 | ||||
| 2025-08-07 | 13F | Guidance Capital, Inc | 27 745 | 10,81 | 889 | 13,68 | ||||
| 2025-07-14 | 13F | Sowell Financial Services LLC | 12 538 | −3,09 | 404 | −4,49 | ||||
| 2025-07-25 | 13F | Cwm, Llc | 3 809 | 9,30 | 0 | |||||
| 2025-08-15 | 13F | Northeast Financial Consultants Inc | 23 404 | 755 | ||||||
| 2025-07-31 | 13F | Cambridge Investment Research Advisors, Inc. | 39 350 | 25,15 | 1 | 0,00 | ||||
| 2025-09-04 | 13F/A | Advisor Group Holdings, Inc. | 38 866 | 8,68 | 1 253 | 6,91 | ||||
| 2025-07-22 | 13F | Valley National Advisers Inc | 3 130 | 0,00 | 0 | |||||
| 2025-08-14 | 13F | Royal Bank Of Canada | 9 943 | 0,25 | 321 | −1,23 | ||||
| 2025-08-14 | 13F | Ameriprise Financial Inc | 162 798 | 34,55 | 5 249 | 32,83 | ||||
| 2025-08-15 | 13F | CI Private Wealth, LLC | 63 800 | −0,38 | 2 057 | −2,00 | ||||
| 2025-08-19 | 13F | Newbridge Financial Services Group, Inc. | 19 392 | 625 | ||||||
| 2025-08-19 | 13F | Anchor Investment Management, LLC | 3 313 | −50,13 | 107 | −51,15 | ||||
| 2025-07-21 | 13F | Rainey & Randall Investment Management Inc. | 29 004 | 5,05 | 935 | 3,43 | ||||
| 2025-08-04 | 13F | Spire Wealth Management | 496 | 1,22 | 16 | −6,25 | ||||
| 2025-08-12 | 13F | LPL Financial LLC | 323 169 | 15,02 | 10 419 | 13,15 | ||||
| 2025-08-14 | 13F | Bank Of America Corp /de/ | 168 523 | −24,21 | 5 433 | −25,43 | ||||
| 2025-04-18 | 13F | Halbert Hargrove Global Advisors, Llc | 0 | 0 | ||||||
| 2025-08-05 | 13F | Bank of New York Mellon Corp | 6 835 | 220 | ||||||
| 2025-08-12 | 13F | SRS Capital Advisors, Inc. | 632 | 49,41 | 20 | 53,85 | ||||
| 2025-08-12 | 13F | Advisors Asset Management, Inc. | 152 281 | 35,49 | 4 910 | 33,29 | ||||
| 2025-07-30 | 13F | Bogart Wealth, LLC | 105 | 0,96 | 3 | 0,00 | ||||
| 2025-08-05 | 13F | Milestone Asset Management, Llc | 15 785 | −15,35 | 509 | −16,86 | ||||
| 2025-05-06 | 13F | WT Wealth Management | 158 647 | 356,17 | 5 199 | 379,96 | ||||
| 2025-07-17 | 13F | Wolff Wiese Magana Llc | 118 | 0,00 | 4 | 0,00 | ||||
| 2025-07-15 | 13F | Fifth Third Bancorp | 2 000 | 0,00 | 64 | −1,54 | ||||
| 2025-08-04 | 13F | Pensionmark Financial Group, Llc | 0 | −100,00 | 0 | |||||
| 2025-07-24 | 13F | Capital Advisors, Ltd. LLC | 1 030 | 0,00 | 0 | |||||
| 2025-08-14 | 13F | GWM Advisors LLC | 31 340 | −20,21 | 1 010 | −21,52 | ||||
| 2025-08-14 | 13F | Fmr Llc | 1 438 | 0,14 | 46 | −2,13 | ||||
| 2025-08-28 | 13F/A | Lavaca Capital Llc | Call | 27 200 | 1 329 | |||||
| 2025-07-16 | 13F | Moisand Fitzgerald Tamayo, LLC | 500 | 0,00 | 16 | 0,00 | ||||
| 2025-07-24 | 13F | Fischer Investment Strategies, Llc | 89 264 | −43,53 | 2 878 | −44,46 | ||||
| 2025-08-07 | 13F | Allworth Financial LP | 1 177 | 370,80 | 38 | 428,57 | ||||
| 2025-08-12 | 13F | MAI Capital Management | 11 550 | 35,09 | 372 | 32,86 | ||||
| 2025-08-27 | 13F/A | Brinker Capital Investments, LLC | 31 625 | 1 020 | ||||||
| 2025-07-31 | 13F | Fielder Capital Group LLC | 20 416 | −24,68 | 658 | −25,90 | ||||
| 2025-07-31 | 13F | Glass Jacobson Investment Advisors llc | 25 788 | −11,01 | 831 | −7,87 | ||||
| 2025-08-14 | 13F | Comerica Bank | 5 424 | 0,00 | 175 | −1,69 | ||||
| 2025-07-31 | 13F | Buckingham Strategic Partners | 10 555 | −11,28 | 340 | −12,60 | ||||
| 2025-07-14 | 13F | U.S. Capital Wealth Advisors, LLC | 77 909 | −0,01 | 2 512 | −1,65 | ||||
| 2025-07-17 | 13F | XML Financial, LLC | 65 791 | 0,38 | 2 121 | −1,21 | ||||
| 2025-07-17 | 13F | Fifth Third Securities, Inc. | 0 | −100,00 | 0 | |||||
| 2025-07-14 | 13F | S.A. Mason LLC | 0 | −100,00 | 0 | |||||
| 2025-07-29 | 13F | Angeles Wealth Management, Llc | 7 000 | −26,32 | 226 | −27,65 | ||||
| 2025-07-17 | 13F | Northwest Wealth Management, Llc | 10 307 | −11,52 | 332 | −12,86 | ||||
| 2025-08-01 | 13F | Envestnet Asset Management Inc | 84 794 | 11,11 | 2 734 | 9,32 | ||||
| 2025-08-14 | 13F | Jane Street Group, Llc | 51 285 | −55,81 | 1 653 | −56,53 | ||||
| 2025-08-08 | 13F | Gts Securities Llc | 38 438 | −11,58 | 1 239 | −12,99 | ||||
| 2025-07-21 | 13F | Ameritas Advisory Services, LLC | 202 | 7 | ||||||
| 2025-08-11 | 13F | HighTower Advisors, LLC | 8 707 | 8,07 | 281 | 6,06 | ||||
| 2025-08-14 | 13F | 10Elms LLP | 7 800 | 2,63 | 251 | 0,80 | ||||
| 2025-08-05 | 13F | EPG Wealth Management LLC | 1 684 | 0,00 | 54 | −1,82 | ||||
| 2025-08-06 | 13F | Prospera Financial Services Inc | 0 | −100,00 | 0 | −100,00 | ||||
| 2025-08-13 | 13F | Custom Index Systems, Llc | 11 825 | 381 | ||||||
| 2025-07-17 | 13F | Smith Anglin Financial, LLC | 0 | −100,00 | 0 | |||||
| 2025-08-14 | 13F | UBS Group AG | 55 011 | −18,00 | 1 774 | −19,34 | ||||
| 2025-07-24 | 13F | Blair William & Co/il | 475 | 0,00 | 15 | 0,00 | ||||
| 2025-08-12 | 13F | Insigneo Advisory Services, Llc | 11 321 | 0,00 | 365 | −1,62 | ||||
| 2025-05-09 | 13F | Legacy Capital Group California, Inc. | 0 | −100,00 | 0 | |||||
| 2025-07-24 | 13F | IFP Advisors, Inc | 5 215 | 0,38 | 168 | −1,18 | ||||
| 2025-08-05 | 13F | Pointe Capital Management LLC | 8 055 | 0,81 | 260 | −0,77 | ||||
| 2025-08-18 | 13F | Geneos Wealth Management Inc. | 818 | 0,00 | 26 | 0,00 | ||||
| 2025-08-13 | 13F | Per Stirling Capital Management, LLC. | 13 483 | 7,91 | 435 | 6,11 | ||||
| 2025-08-12 | 13F | Global Retirement Partners, LLC | 233 | 8 | ||||||
| 2025-08-14 | 13F | Citadel Advisors Llc | 27 943 | 901 | ||||||
| 2025-08-26 | NP | UMI - USCF Midstream Energy Income Fund | 238 327 | −29,98 | 7 684 | −31,12 | ||||
| 2025-08-07 | 13F | Tfo-tdc, Llc | 51 121 | 0,00 | 1 648 | −1,61 | ||||
| 2025-08-13 | 13F | Jones Financial Companies Lllp | 390 | 13 | ||||||
| 2025-07-23 | 13F | Tcfg Wealth Management, Llc | 9 733 | 45,10 | 314 | 42,92 | ||||
| 2025-07-30 | 13F | Onyx Bridge Wealth Group LLC | 12 179 | −15,00 | 393 | −16,42 | ||||
| 2025-08-12 | 13F | CIBC Private Wealth Group, LLC | 18 524 | 0,00 | 597 | 13,28 | ||||
| 2025-07-09 | 13F | Fermata Advisors, LLC | 11 025 | −0,51 | 355 | −2,20 | ||||
| 2025-05-15 | 13F | Mpwm Advisory Solutions, Llc | 0 | −100,00 | 0 | |||||
| 2025-08-07 | 13F | Pinnacle Holdings, LLC | 0 | −100,00 | 0 | |||||
| 2025-07-30 | 13F | Caliber Wealth Management, LLC / KS | 8 217 | 1,05 | 265 | −0,75 | ||||
| 2025-08-04 | 13F | Bordeaux Wealth Advisors LLC | 0 | −100,00 | 0 | |||||
| 2025-08-08 | 13F | Cetera Investment Advisers | 59 033 | 70,78 | 1 903 | 68,11 | ||||
| 2025-08-08 | 13F | Avantax Advisory Services, Inc. | 101 088 | 38,79 | 3 259 | 36,59 | ||||
| 2025-08-14 | 13F | Stifel Financial Corp | 56 503 | 65,33 | 1 822 | 62,73 | ||||
| 2025-07-25 | 13F | Atria Wealth Solutions, Inc. | 18 000 | −3,49 | 580 | −5,07 | ||||
| 2025-08-13 | 13F | Rsm Us Wealth Management Llc | 24 477 | 8,58 | 789 | 6,91 | ||||
| 2025-08-25 | 13F | Fulcrum Equity Management | 33 442 | −10,49 | 1 078 | −11,93 | ||||
| 2025-07-31 | 13F | Wealthfront Advisers Llc | 40 302 | 92,33 | 1 299 | 89,36 | ||||
| 2025-08-15 | 13F | Morgan Stanley | 338 529 | −5,28 | 10 914 | −6,81 | ||||
| 2025-07-11 | 13F | Miller Howard Investments Inc /ny | 238 327 | −23,12 | 7 684 | −24,37 | ||||
| 2025-07-10 | 13F | Oliver Lagore Vanvalin Investment Group | 125 | 56,25 | 4 | 100,00 | ||||
| 2025-08-12 | 13F | Proequities, Inc. | 0 | 0 | ||||||
| 2025-08-14 | 13F | Sunbelt Securities, Inc. | 0 | −100,00 | 0 | |||||
| 2025-04-22 | 13F | WealthCare Investment Partners, LLC | 0 | −100,00 | 0 | |||||
| 2025-07-22 | 13F | Keudell/Morrison Wealth Management | 8 850 | −14,16 | 285 | −15,43 | ||||
| 2025-08-06 | 13F | First Horizon Advisors, Inc. | 1 000 | 0,00 | 32 | 0,00 | ||||
| 2025-07-09 | 13F | Dynamic Advisor Solutions LLC | 21 023 | 106,57 | 678 | 103,30 | ||||
| 2025-08-06 | 13F | Commonwealth Equity Services, Llc | 22 021 | 0,92 | 1 | |||||
| 2025-07-21 | 13F | Ameriflex Group, Inc. | 7 038 | 68,33 | 226 | 64,96 | ||||
| 2025-08-14 | 13F/A | Rockefeller Capital Management L.P. | 25 181 | −1,25 | 812 | −2,87 | ||||
| 2025-08-14 | 13F | Raymond James Financial Inc | 423 503 | 11,53 | 13 654 | 9,72 | ||||
| 2025-08-14 | 13F | Brasada Capital Management, Lp | 23 850 | 760 | ||||||
| 2025-08-14 | 13F | BTG Pactual Asset Management US LLC | 1 009 | 0,00 | 33 | −3,03 |