Grundläggande statistik
| Institutionella ägare | 185 total, 177 long only, 1 short only, 7 long/short - change of 1,65% MRQ |
| Genomsnittlig portföljallokering | 0.1191 % - change of −66,91% MRQ |
| Institutionella aktier (lång) | 33 596 238 (ex 13D/G) - change of −3,60MM shares −9,67% MRQ |
| Institutionellt värde (lång) | $ 184 288 USD ($1000) |
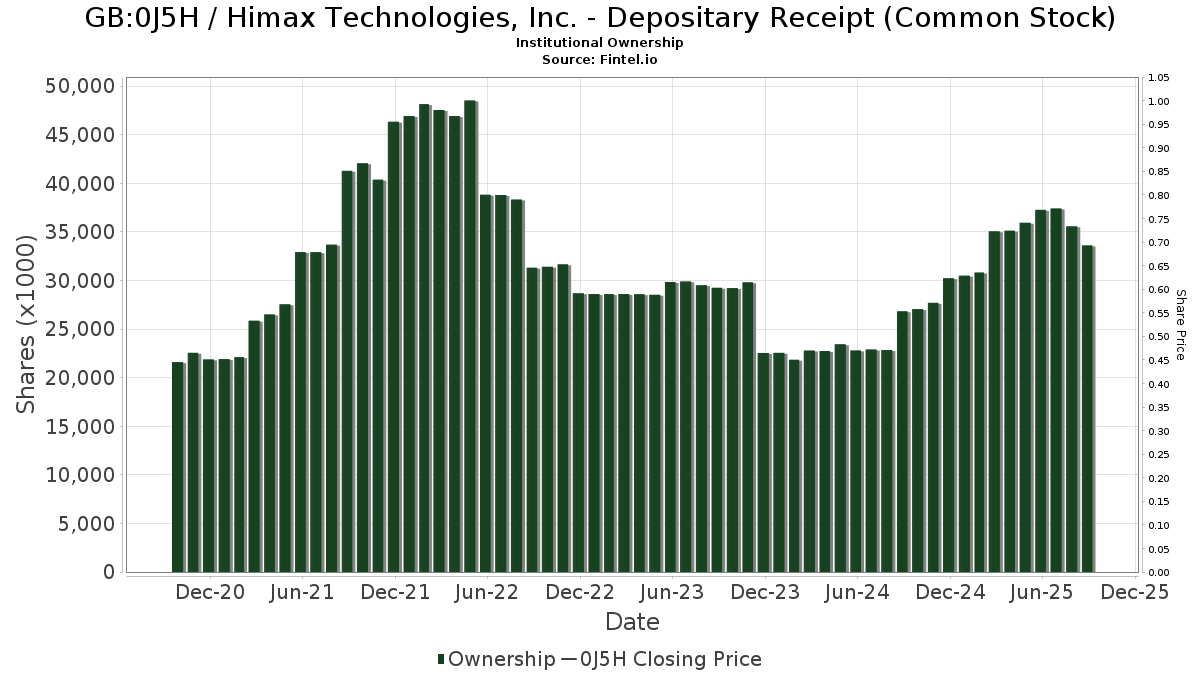
Institutionellt ägande och aktieägare
Himax Technologies, Inc. - Depositary Receipt (Common Stock) (GB:0J5H) har 185 Institutionella ägare och aktieägare som har lämnat in 13D/G- eller 13F-formulär till Securities Exchange Commission (SEC). Dessa institut innehar totalt 33,599,618 aktier. Största aktieägare inkluderar Acadian Asset Management Llc, Lazard Asset Management Llc, Robeco Institutional Asset Management B.V., State Street Corp, Allianz Asset Management GmbH, KOMP - SPDR S&P Kensho New Economies Composite ETF, Group One Trading, L.p., Morgan Stanley, Polunin Capital Partners Ltd, and DVYE - iShares Emerging Markets Dividend ETF .
Himax Technologies, Inc. - Depositary Receipt (Common Stock) (LSE:0J5H) Institutionell ägarstruktur visar institutioners och fonders nuvarande positioner i företaget, samt de senaste förändringarna i positionernas storlek. Större aktieägare kan vara enskilda investerare, fonder, hedgefonder eller institutioner. Bilaga 13D visar att investeraren äger (eller ägde) mer än 5% av företaget och avser (eller avsåg) att aktivt eftersträva en förändring av affärsstrategin. Schedule 13G indikerar en passiv investering på över 5%.
Fondsentimentets poäng
Fondsentimentet poängen(fka Ägarackumulation-poäng) visar vilka aktier som är mest köpta av fonder. Det är resultatet av en sofistikerad kvantitativ flerfaktormodell som identifierar företag med de högsta nivåerna av institutionell ackumulering. Poängsättningsmodellen använder en kombination av den totala ökningen av redovisade ägare, förändringarna i portföljallokeringarna för dessa ägare och andra mått. Siffran sträcker sig från 0 till 100, där högre siffror indikerar en högre nivå av ackumulering i förhållande till sina konkurrenter, och 50 är genomsnittet.
Uppdateringsfrekvens: Dagligen
Se Ownership Explorer, som innehåller en lista över de högst rankade företagen.
13F- och NPORT-arkiveringar
Detaljer om 13F-arkiveringar är gratis. Detaljer om NP-arkiveringar kräver ett premiummedlemskap. Gröna rader indikerar nya positioner. Röda rader indikerar stängda positioner. Klicka på länk symbolen för att se hela transaktionshistoriken.
Uppgradera
för att låsa upp premiumdata och exportera till Excel ![]() .
.
| Fil Datum | Källa | Investerare | Typ | Genomsnittligt pris (beräknat) |
Aktier | Δ Aktier (%) |
Rapporterat värde (1000 USD) |
Δ Värde (%) |
Portföljallokering (%) |
|
|---|---|---|---|---|---|---|---|---|---|---|
| 2025-08-08 | 13F | SG Americas Securities, LLC | 23 500 | −46,39 | 0 | |||||
| 2025-07-29 | NP | WEUSX - Siit World Equity Ex-us Fund - Class A | 255 186 | −31,66 | 2 080 | −44,77 | ||||
| 2025-08-14 | 13F | Goldman Sachs Group Inc | 615 057 | 155,84 | 5 492 | 210,81 | ||||
| 2025-07-22 | 13F | IMC-Chicago, LLC | Call | 27 500 | −75,98 | 246 | −70,87 | |||
| 2025-08-13 | 13F | First Trust Advisors Lp | 0 | −100,00 | 0 | |||||
| 2025-07-24 | 13F | Ronald Blue Trust, Inc. | 7 271 | −6,89 | 65 | 12,28 | ||||
| 2025-07-22 | 13F | IMC-Chicago, LLC | 0 | −100,00 | 0 | −100,00 | ||||
| 2025-07-22 | 13F | IMC-Chicago, LLC | Put | 0 | −100,00 | 0 | −100,00 | |||
| 2025-07-18 | 13F | USA Financial Portformulas Corp | 3 573 | 32 | ||||||
| 2025-08-12 | 13F | Proequities, Inc. | Put | 0 | 0 | |||||
| 2025-08-12 | 13F | Proequities, Inc. | Call | 0 | 0 | |||||
| 2025-08-12 | 13F | Proequities, Inc. | 0 | 0 | ||||||
| 2025-08-12 | 13F | Steward Partners Investment Advisory, Llc | 950 | 0,00 | 8 | 33,33 | ||||
| 2025-08-12 | 13F | CIBC Private Wealth Group, LLC | 288 | 11,63 | 3 | 100,00 | ||||
| 2025-08-28 | NP | SBQAX - AmericaFirst Large Cap Share Buyback Fund Class A | 6 360 | 37,81 | 57 | 69,70 | ||||
| 2025-08-14 | 13F | Lazard Asset Management Llc | 5 256 923 | 7,66 | 47 | 31,43 | ||||
| 2025-08-06 | 13F | Commonwealth Equity Services, Llc | 11 603 | 0 | ||||||
| 2025-08-14 | 13F | Point72 Asia (Singapore) Pte. Ltd. | 0 | −100,00 | 0 | |||||
| 2025-08-15 | 13F | Tower Research Capital LLC (TRC) | 3 624 | −66,66 | 32 | −58,97 | ||||
| 2025-08-27 | NP | BFOCX - Berkshire Focus Fund | 10 | 0,00 | 0 | |||||
| 2025-08-27 | 13F/A | Brinker Capital Investments, LLC | 36 577 | 100,52 | 327 | 143,28 | ||||
| 2025-08-07 | 13F | Acadian Asset Management Llc | 6 716 022 | −0,44 | 60 | 20,41 | ||||
| 2025-08-14 | 13F | Bnp Paribas Arbitrage, Sa | 79 163 | −81,88 | 707 | −78,01 | ||||
| 2025-08-15 | 13F | WealthCollab, LLC | 1 410 | 29,83 | 13 | 71,43 | ||||
| 2025-07-28 | 13F | Allianz Asset Management GmbH | 1 296 538 | 10,99 | 11 578 | 34,86 | ||||
| 2025-08-14 | 13F | Verition Fund Management LLC | 0 | −100,00 | 0 | |||||
| 2025-08-14 | 13F | Bank Of America Corp /de/ | 261 223 | −65,00 | 2 333 | −57,48 | ||||
| 2025-04-02 | 13F | Global Wealth Strategies & Associates | 0 | −100,00 | 0 | −100,00 | ||||
| 2025-08-13 | 13F | Kilter Group LLC | 183 | 2 | ||||||
| 2025-08-07 | 13F | ProShare Advisors LLC | 23 420 | −20,18 | 209 | −2,79 | ||||
| 2025-07-29 | NP | FSAKX - Strategic Advisers U.S. Total Stock Fund | 0 | −100,00 | 0 | −100,00 | ||||
| 2025-05-13 | 13F | E Fund Management Co., Ltd. | 0 | −100,00 | 0 | −100,00 | ||||
| 2025-08-14 | 13F/A | Skopos Labs, Inc. | 432 | 4 | ||||||
| 2025-08-15 | 13F | CI Private Wealth, LLC | 22 205 | 34,54 | 198 | 63,64 | ||||
| 2025-08-13 | 13F | Jump Financial, LLC | 357 722 | 3 194 | ||||||
| 2025-07-08 | 13F | Quintet Private Bank (Europe) S.A. | 0 | −100,00 | 0 | −100,00 | ||||
| 2025-07-03 | 13F | Garde Capital, Inc. | 265 | 0,00 | 2 | 100,00 | ||||
| 2025-08-08 | 13F | Commonwealth Of Pennsylvania Public School Empls Retrmt Sys | 62 383 | 0,00 | 557 | 21,62 | ||||
| 2025-08-14 | 13F | Wiley Bros.-aintree Capital, Llc | 17 555 | 8,17 | 157 | 27,87 | ||||
| 2025-07-14 | 13F | GAMMA Investing LLC | 9 497 | −23,68 | 85 | −7,69 | ||||
| 2025-07-21 | 13F | Ameriflex Group, Inc. | 1 800 | 0,00 | 17 | 23,08 | ||||
| 2025-07-30 | NP | FSAMX - Strategic Advisers Emerging Markets Fund This fund is a listed as child fund of Fmr Llc and if that institution has disclosed ownership in this security, then these positions will not be double counted when calculating total shares and total value | 5 217 | −90,50 | 43 | −92,41 | ||||
| 2025-08-01 | 13F | Envestnet Asset Management Inc | 275 829 | 11,36 | 2 463 | 35,33 | ||||
| 2025-08-14 | 13F | Vident Advisory, LLC | 165 058 | 29,53 | 1 474 | 57,37 | ||||
| 2025-07-25 | 13F | Cwm, Llc | 1 375 | 7,00 | 0 | |||||
| 2025-08-12 | 13F | Legal & General Group Plc | 2 214 | 0,00 | 20 | 18,75 | ||||
| 2025-08-13 | 13F | Jones Financial Companies Lllp | 250 | −81,32 | 2 | −80,00 | ||||
| 2025-05-27 | NP | FTHI - First Trust BuyWrite Income ETF This fund is a listed as child fund of First Trust Advisors Lp and if that institution has disclosed ownership in this security, then these positions will not be double counted when calculating total shares and total value | 133 436 | 981 | ||||||
| 2025-08-14 | 13F | Aspen Grove Capital, LLC | 20 746 | 11,82 | 193 | 41,18 | ||||
| 2025-07-14 | 13F | Clear Harbor Asset Management, LLC | 178 945 | −0,82 | 1 598 | 20,44 | ||||
| 2025-07-25 | 13F | JustInvest LLC | 17 149 | 39,57 | 153 | 70,00 | ||||
| 2025-04-24 | NP | TINT - ProShares Smart Materials ETF ProShares Smart Materials | 4 248 | 0,54 | 43 | 90,91 | ||||
| 2025-07-14 | 13F | Clear Harbor Asset Management, LLC | Call | 40 000 | 357 | |||||
| 2025-07-17 | 13F | Sound Income Strategies, LLC | 220 | 0,00 | 2 | 0,00 | ||||
| 2025-07-24 | 13F | JNBA Financial Advisors | 0 | −100,00 | 0 | |||||
| 2025-08-12 | 13F | Clear Street Markets Llc | 21 900 | 196 | ||||||
| 2025-08-12 | 13F | BlackRock, Inc. | 347 626 | −13,57 | 3 104 | 5,01 | ||||
| 2025-07-22 | 13F | Herald Investment Management Ltd | 230 000 | 0,00 | 2 054 | 21,48 | ||||
| 2025-08-13 | 13F | EverSource Wealth Advisors, LLC | 6 056 | 109,77 | 54 | 157,14 | ||||
| 2025-08-14 | 13F | Warren Averett Asset Management, LLC | 11 512 | 11,59 | 103 | 36,00 | ||||
| 2025-08-14 | 13F | GWM Advisors LLC | 12 883 | 826,83 | 115 | 1 050,00 | ||||
| 2025-08-05 | 13F | Bank of New York Mellon Corp | 20 412 | 21,22 | 182 | 47,97 | ||||
| 2025-08-05 | 13F | Redwood Wealth Management Group, LLC | 72 960 | −8,41 | 652 | 11,28 | ||||
| 2025-08-14 | 13F | UBS Group AG | 554 483 | −14,15 | 4 952 | 4,30 | ||||
| 2025-08-14 | 13F | Citadel Advisors Llc | 49 720 | −58,08 | 444 | −49,02 | ||||
| 2025-08-14 | 13F | Peak6 Llc | Call | 204 000 | 1 822 | |||||
| 2025-08-14 | 13F | Citadel Advisors Llc | Put | 466 400 | −43,40 | 4 165 | −31,25 | |||
| 2025-08-14 | 13F | Citadel Advisors Llc | Call | 249 300 | −33,91 | 2 226 | −19,70 | |||
| 2025-08-13 | 13F | Renaissance Technologies Llc | 519 161 | 237,42 | 4 636 | 310,27 | ||||
| 2025-08-28 | NP | EWX - SPDR(R) S&P(R) EMERGING MARKETS SMALL CAP ETF | 75 473 | 0,00 | 674 | 21,48 | ||||
| 2025-07-23 | 13F | BankPlus Trust Department | 2 500 | 0,00 | 22 | 22,22 | ||||
| 2025-08-12 | 13F | LPL Financial LLC | 68 960 | −50,46 | 616 | −39,88 | ||||
| 2025-08-05 | 13F | Simplex Trading, Llc | Put | 69 400 | −16,18 | 1 | ||||
| 2025-08-27 | NP | TIFF INVESTMENT PROGRAM - TIFF Multi-Asset Fund | Short | −3 380 | 63,76 | −30 | 87,50 | |||
| 2025-08-05 | 13F | Simplex Trading, Llc | Call | 193 100 | −39,62 | 2 | −50,00 | |||
| 2025-08-04 | 13F | Assetmark, Inc | 4 360 | 7,39 | 39 | 31,03 | ||||
| 2025-08-14 | 13F | DZ BANK AG Deutsche Zentral Genossenschafts Bank, Frankfurt am Main | 0 | −100,00 | 0 | |||||
| 2025-08-14 | 13F | Graham Capital Management, L.P. | 65 103 | 581 | ||||||
| 2025-08-06 | 13F | Wedbush Securities Inc | 0 | −100,00 | 0 | |||||
| 2025-06-26 | NP | CRNSX - CATHOLIC RESPONSIBLE INVESTMENTS INTERNATIONAL SMALL-CAP FUND Institutional Shares | 3 664 | 26 | ||||||
| 2025-07-28 | NP | VERS - ProShares Metaverse Theme ETF | 25 826 | −14,61 | 210 | −30,92 | ||||
| 2025-08-25 | 13F/A | Neuberger Berman Group LLC | 266 996 | −18,77 | 2 384 | −1,28 | ||||
| 2025-08-06 | 13F | Savant Capital, LLC | 11 763 | 105 | ||||||
| 2025-08-14 | 13F | Murphy & Mullick Capital Management Corp | 100 | 0,00 | 1 | |||||
| 2025-08-14 | 13F | Wellington Management Group Llp | 151 682 | −66,80 | 1 355 | −59,67 | ||||
| 2025-08-28 | NP | AFPAX - AmericaFirst Income Fund Class A | 42 496 | 37,57 | 379 | 66,96 | ||||
| 2025-08-07 | 13F | Allworth Financial LP | 2 500 | 38,81 | 22 | 83,33 | ||||
| 2025-08-14 | 13F | D. E. Shaw & Co., Inc. | 48 560 | −65,03 | 434 | −57,55 | ||||
| 2025-05-05 | 13F | Eagle Bay Advisors LLC | 0 | −100,00 | 0 | |||||
| 2025-08-18 | 13F/A | Nomura Holdings Inc | 30 000 | 0,00 | 268 | 21,36 | ||||
| 2025-07-14 | 13F | Foster Group, Inc. | 13 402 | 1,18 | 120 | 22,68 | ||||
| 2025-08-08 | 13F | Cetera Investment Advisers | 10 053 | 90 | ||||||
| 2025-08-13 | 13F | Walleye Trading LLC | Call | 177 400 | 526,86 | 1 584 | 661,54 | |||
| 2025-05-15 | 13F | Marshall Wace, Llp | 0 | −100,00 | 0 | |||||
| 2025-08-13 | 13F | Quadrant Capital Group Llc | 29 653 | −32,73 | 265 | −18,27 | ||||
| 2025-08-11 | 13F | Bell Investment Advisors, Inc | 0 | −100,00 | 0 | |||||
| 2025-08-13 | 13F | Walleye Trading LLC | Put | 69 400 | 1 209,43 | 620 | 1 528,95 | |||
| 2025-07-31 | 13F | Caitong International Asset Management Co., Ltd | 0 | −100,00 | 0 | |||||
| 2025-08-14 | 13F | Susquehanna Portfolio Strategies, LLC | 126 290 | 1 128 | ||||||
| 2025-07-11 | 13F | Pinnacle Bancorp, Inc. | 199 | 0,00 | 2 | 0,00 | ||||
| 2025-07-28 | 13F | Harbour Investments, Inc. | 100 | 0,00 | 1 | |||||
| 2025-08-12 | 13F | Handelsbanken Fonder AB | 103 189 | 1 | ||||||
| 2025-08-13 | 13F | Hel Ved Capital Management Ltd | 140 900 | 1 258 | ||||||
| 2025-08-13 | 13F | Kennedy Capital Management, Inc. | 0 | −100,00 | 0 | |||||
| 2025-08-14 | 13F | Bluefin Capital Management, Llc | 13 500 | 121 | ||||||
| 2025-07-08 | 13F | Parallel Advisors, LLC | 11 606 | −7,42 | 104 | 11,96 | ||||
| 2025-07-16 | 13F | Signaturefd, Llc | 13 028 | 2,61 | 116 | 24,73 | ||||
| 2025-07-23 | 13F | Gagnon Securities Llc | 54 580 | 0,00 | 487 | 21,45 | ||||
| 2025-07-31 | 13F | Glass Jacobson Investment Advisors llc | 0 | −100,00 | 0 | |||||
| 2025-08-08 | 13F | Geode Capital Management, Llc | 130 607 | 6,04 | 1 166 | 28,84 | ||||
| 2025-08-13 | 13F | Bare Financial Services, Inc | 117 | 1 | ||||||
| 2025-07-28 | NP | QQQS - Invesco NASDAQ Future Gen 200 ETF | 4 180 | −51,08 | 34 | −60,47 | ||||
| 2025-07-24 | 13F | CWM Advisors, LLC | 92 574 | 827 | ||||||
| 2025-08-14 | 13F | Fmr Llc | 1 677 | 0,00 | 15 | 16,67 | ||||
| 2025-08-12 | 13F | Global Retirement Partners, LLC | 74 | −16,85 | 1 | |||||
| 2025-08-13 | 13F | Employees Retirement System of Texas | 12 942 | −41,20 | 0 | |||||
| 2025-08-14 | 13F | Susquehanna Fundamental Investments, Llc | 0 | −100,00 | 0 | |||||
| 2025-04-29 | 13F | Hm Payson & Co | 540 | 0,00 | 4 | −25,00 | ||||
| 2025-08-14 | 13F | Parallax Volatility Advisers, L.P. | 46 773 | 4,06 | 418 | 26,36 | ||||
| 2025-08-15 | 13F | Morgan Stanley | 1 008 665 | −4,44 | 9 007 | 16,10 | ||||
| 2025-08-14 | 13F | Millennium Management Llc | 32 106 | −46,67 | 287 | −35,29 | ||||
| 2025-05-12 | 13F | Simplex Trading, Llc | 0 | −100,00 | 0 | |||||
| 2025-07-29 | 13F | JTC Employer Solutions Trusteee Ltd | 10 000 | 0,00 | 0 | |||||
| 2025-08-04 | 13F | Spire Wealth Management | 95 | 0,00 | 1 | |||||
| 2025-08-20 | NP | NATIONWIDE VARIABLE INSURANCE TRUST - NVIT GS Emerging Markets Equity Insights Fund Class Y | 33 900 | −34,68 | 303 | −63,57 | ||||
| 2025-08-12 | 13F | DnB Asset Management AS | 140 397 | 1 254 | ||||||
| 2025-08-12 | 13F | Deutsche Bank Ag\ | 20 000 | 179 | ||||||
| 2025-07-24 | 13F | IFP Advisors, Inc | 131 | 0,00 | 1 | |||||
| 2025-07-24 | 13F | Us Bancorp \de\ | 17 011 | −38,16 | 152 | −25,25 | ||||
| 2025-08-14 | 13F | Jane Street Group, Llc | 289 908 | −36,77 | 2 589 | −23,20 | ||||
| 2025-08-14 | 13F | Jane Street Group, Llc | Put | 41 500 | 47,69 | 371 | 79,61 | |||
| 2025-08-13 | 13F | Northwestern Mutual Wealth Management Co | 1 665 | 9 694,12 | 15 | |||||
| 2025-08-14 | 13F | Jane Street Group, Llc | Call | 58 400 | −30,23 | 522 | −15,28 | |||
| 2025-05-14 | 13F | Walleye Trading LLC | 0 | −100,00 | 0 | −100,00 | ||||
| 2025-08-12 | 13F | Jpmorgan Chase & Co | 12 429 | −14,44 | 111 | 3,77 | ||||
| 2025-08-22 | NP | FMET - Fidelity Metaverse ETF | 29 751 | 28,93 | 266 | 56,80 | ||||
| 2025-07-29 | NP | SSEAX - SIIT Screened World Equity Ex-US Fund - Class A | 3 786 | −55,86 | 31 | −65,12 | ||||
| 2025-08-28 | NP | XCNY - SPDR S&P Emerging Markets ex-China ETF | 200 | 0,00 | 2 | 0,00 | ||||
| 2025-08-13 | 13F | FORA Capital, LLC | 15 707 | 140 | ||||||
| 2025-03-27 | NP | DVYE - iShares Emerging Markets Dividend ETF | 694 809 | −1,95 | 7 031 | 73,18 | ||||
| 2025-05-14 | 13F | Van Hulzen Asset Management, LLC | 0 | −100,00 | 0 | −100,00 | ||||
| 2025-07-18 | 13F | Robeco Institutional Asset Management B.V. | 3 459 823 | 55,09 | 30 896 | 88,44 | ||||
| 2025-07-30 | 13F | Whittier Trust Co | 838 | 7 | ||||||
| 2025-08-14 | 13F | Soviero Asset Management, LP | Call | 300 000 | 500,00 | 2 679 | 629,97 | |||
| 2025-08-06 | 13F | First Horizon Advisors, Inc. | 149 | 161,40 | 1 | |||||
| 2025-08-13 | 13F | Northern Trust Corp | 17 597 | 14,18 | 157 | 38,94 | ||||
| 2025-08-27 | 13F/A | Squarepoint Ops LLC | Put | 0 | −100,00 | 0 | −100,00 | |||
| 2025-08-15 | 13F | Sender Co & Partners, Inc. | 25 989 | 232 | ||||||
| 2025-07-11 | 13F | UMA Financial Services, Inc. | 0 | −100,00 | 0 | |||||
| 2025-08-07 | 13F | Mitsubishi UFJ Kokusai Asset Management Co., Ltd. | 662 190 | 19,90 | 5 913 | 45,68 | ||||
| 2025-05-14 | 13F | Barometer Capital Management Inc. | 0 | −100,00 | 0 | |||||
| 2025-08-12 | 13F | Coldstream Capital Management Inc | 0 | −100,00 | 0 | |||||
| 2025-08-14 | 13F | Stifel Financial Corp | 469 271 | 0,76 | 4 191 | 22,41 | ||||
| 2025-08-12 | 13F | MAI Capital Management | 1 089 | 10 | ||||||
| 2025-07-30 | 13F | FNY Investment Advisers, LLC | 6 211 | 0 | ||||||
| 2025-07-17 | 13F | Park Place Capital Corp | 1 537 | 0,00 | 14 | 18,18 | ||||
| 2025-08-05 | 13F | Huntington National Bank | 1 641 | 3,73 | 15 | 27,27 | ||||
| 2025-08-14 | 13F | Cubist Systematic Strategies, LLC | Call | 41 700 | −28,47 | 372 | −13,08 | |||
| 2025-08-14 | 13F | Berkshire Capital Holdings Inc | 10 | 0,00 | 0 | |||||
| 2025-08-05 | 13F | Bank Of Montreal /can/ | 80 400 | 11,13 | 718 | 35,03 | ||||
| 2025-08-29 | NP | MFEM - PIMCO RAFI Dynamic Multi-Factor Emerging Markets Equity ETF | 1 155 | 0,00 | 10 | 25,00 | ||||
| 2025-07-22 | 13F | Kraematon Investment Advisors, Inc | 13 900 | 0,00 | 124 | 21,57 | ||||
| 2025-08-14 | 13F | Point72 Asset Management, L.P. | 378 262 | −60,65 | 3 378 | −52,20 | ||||
| 2025-08-14 | 13F | Two Sigma Investments, Lp | 691 537 | −34,48 | 6 175 | −20,39 | ||||
| 2025-07-30 | 13F | Cullen/frost Bankers, Inc. | 0 | −100,00 | 0 | |||||
| 2025-05-15 | 13F | Point72 Hong Kong Ltd | 0 | −100,00 | 0 | |||||
| 2025-07-11 | 13F | Farther Finance Advisors, LLC | 3 423 | 10,42 | 31 | 30,43 | ||||
| 2025-08-14 | 13F | Ameriprise Financial Inc | 64 240 | −0,16 | 576 | 21,82 | ||||
| 2025-08-13 | 13F | Formula Growth Ltd | 149 093 | −1,91 | 1 331 | 19,16 | ||||
| 2025-05-05 | 13F | Lindbrook Capital, Llc | 4 102 | 3,82 | 30 | −3,23 | ||||
| 2025-05-15 | 13F | Mariner, LLC | 0 | −100,00 | 0 | |||||
| 2025-08-13 | 13F | Russell Investments Group, Ltd. | 285 139 | −7,59 | 2 692 | 15,69 | ||||
| 2025-07-15 | 13F | Ballentine Partners, LLC | 37 533 | 5,95 | 335 | 28,85 | ||||
| 2025-08-13 | 13F | New York State Common Retirement Fund | 33 123 | 0,00 | 0 | |||||
| 2025-05-05 | 13F | Creekmur Asset Management LLC | 0 | −100,00 | 0 | |||||
| 2025-08-28 | NP | SPEM - SPDR(R) Portfolio Emerging Markets ETF | 173 856 | 13,91 | 1 553 | 38,45 | ||||
| 2025-06-25 | NP | NTKLX - Voya Multi-Manager International Small Cap Fund Class A | 28 343 | 0,00 | 201 | −30,07 | ||||
| 2025-08-14 | 13F | Soviero Asset Management, LP | 431 766 | 28,89 | 3 856 | 56,58 | ||||
| 2025-08-07 | 13F | 1620 Investment Advisors, Inc. | 7 | 0,00 | 0 | |||||
| 2025-08-14 | 13F | Banque Transatlantique SA | 0 | −100,00 | 0 | |||||
| 2025-05-15 | 13F | Bayesian Capital Management, LP | 0 | −100,00 | 0 | −100,00 | ||||
| 2025-08-13 | 13F | Natixis Advisors, L.p. | 25 700 | 0 | ||||||
| 2025-08-28 | NP | KOMP - SPDR S&P Kensho New Economies Composite ETF This fund is a listed as child fund of State Street Corp and if that institution has disclosed ownership in this security, then these positions will not be double counted when calculating total shares and total value | 1 198 848 | 10 706 | ||||||
| 2025-08-14 | 13F | State Street Corp | 1 468 807 | 493,50 | 13 661 | 651,38 | ||||
| 2025-05-15 | 13F | Parvin Asset Management, LLC | 0 | −100,00 | 0 | |||||
| 2025-08-14 | 13F | Wells Fargo & Company/mn | 344 857 | 30,09 | 3 080 | 58,06 | ||||
| 2025-04-23 | 13F | E Fund Management (Hong Kong) Co., Ltd. | 0 | −100,00 | 0 | |||||
| 2025-08-14 | 13F | Cubist Systematic Strategies, LLC | 0 | −100,00 | 0 | −100,00 | ||||
| 2025-06-17 | NP | GSEQX - Goldman Sachs Multi-Manager Global Equity Fund Class R6 Shares | 22 219 | 0,00 | 157 | −29,91 | ||||
| 2025-08-13 | 13F | Pinpoint Asset Management (Singapore) Pte. Ltd. | 1 | 0 | ||||||
| 2025-07-15 | 13F | Td Private Client Wealth Llc | 1 750 | 21,11 | 16 | 50,00 | ||||
| 2025-08-28 | NP | WLCTX - Wilshire International Equity Fund Investment Class | 3 270 | −1,80 | 29 | 20,83 | ||||
| 2025-08-14 | 13F | Peak6 Llc | 0 | −100,00 | 0 | −100,00 | ||||
| 2025-08-14 | 13F | Peak6 Llc | Put | 0 | −100,00 | 0 | −100,00 | |||
| 2025-07-24 | NP | FNCMX - Fidelity Nasdaq Composite Index Fund This fund is a listed as child fund of Fmr Llc and if that institution has disclosed ownership in this security, then these positions will not be double counted when calculating total shares and total value | 62 575 | 0,00 | 510 | −19,21 | ||||
| 2025-08-11 | 13F | Citigroup Inc | 36 863 | 17,97 | 329 | 43,67 | ||||
| 2025-07-30 | NP | APIE - ActivePassive International Equity ETF | 33 788 | −30,68 | 275 | −43,99 | ||||
| 2025-05-14 | 13F/A | Group One Trading, L.p. | 0 | −100,00 | 0 | −100,00 | ||||
| 2025-08-12 | 13F | Franklin Resources Inc | 15 053 | 134 | ||||||
| 2025-08-13 | 13F | Mirabella Financial Services Llp | 0 | −100,00 | 0 | |||||
| 2025-07-21 | 13F | Qrg Capital Management, Inc. | 20 495 | −10,13 | 183 | 9,58 | ||||
| 2025-08-14 | 13F | Group One Trading, L.p. | Call | 1 161 000 | −33,57 | 10 368 | −19,29 | |||
| 2025-07-24 | 13F | Stonebridge Financial Group, LLC | 0 | −100,00 | 0 | |||||
| 2025-08-14 | 13F | Group One Trading, L.p. | Put | 327 700 | 169,71 | 2 926 | 227,66 | |||
| 2025-08-14 | 13F | Aquatic Capital Management LLC | 99 822 | −47,40 | 891 | −36,08 | ||||
| 2025-05-15 | 13F/A | Orion Portfolio Solutions, LLC | 18 241 | 36,88 | 134 | 25,23 | ||||
| 2025-08-27 | 13F/A | Squarepoint Ops LLC | 11 805 | −86,65 | 105 | −83,82 | ||||
| 2025-07-24 | NP | ONEQ - Fidelity Nasdaq Composite Index Tracking Stock This fund is a listed as child fund of Fmr Llc and if that institution has disclosed ownership in this security, then these positions will not be double counted when calculating total shares and total value | 37 955 | 113,34 | 309 | 672,50 | ||||
| 2025-08-12 | 13F | O'shaughnessy Asset Management, Llc | 29 341 | −26,32 | 262 | −10,27 | ||||
| 2025-08-14 | 13F | Hrt Financial Lp | 0 | −100,00 | 0 | |||||
| 2025-08-28 | NP | GMF - SPDR(R) S&P(R) EMERGING ASIA PACIFIC ETF | 12 416 | −6,51 | 111 | 13,40 | ||||
| 2025-07-15 | 13F | Public Employees Retirement System Of Ohio | 295 789 | −14,80 | 2 641 | 3,53 | ||||
| 2025-08-14 | 13F | Raymond James Financial Inc | 13 738 | −24,70 | 123 | −8,96 | ||||
| 2025-08-11 | 13F | Principal Securities, Inc. | 255 | −45,74 | 2 | −33,33 | ||||
| 2025-08-14 | 13F | Federation des caisses Desjardins du Quebec | 46 473 | −8,53 | 416 | 11,26 | ||||
| 2025-08-14 | 13F | Sei Investments Co | 277 632 | 0,00 | 2 479 | 21,52 | ||||
| 2025-06-26 | NP | HERIX - Hartford Emerging Markets Equity Fund Class I | 72 419 | 0,00 | 512 | −30,05 | ||||
| 2025-05-12 | 13F | Pinpoint Asset Management Ltd | 1 | 0 | ||||||
| 2025-08-13 | 13F | Walleye Capital LLC | Put | 0 | −100,00 | 0 | −100,00 | |||
| 2025-08-08 | 13F | Creative Planning | 55 099 | 18,00 | 492 | 43,44 | ||||
| 2025-07-08 | 13F | Northwest & Ethical Investments L.P. | 0 | −100,00 | 0 | −100,00 | ||||
| 2025-05-14 | 13F | Arrowstreet Capital, Limited Partnership | 0 | −100,00 | 0 | |||||
| 2025-07-10 | 13F | Polunin Capital Partners Ltd | 758 268 | 0,00 | 7 | 50,00 | ||||
| 2025-08-14 | 13F | Voloridge Investment Management, Llc | 206 336 | −59,95 | 1 843 | −51,35 | ||||
| 2025-07-15 | 13F | Compagnie Lombard Odier SCmA | 334 | 3 | ||||||
| 2025-08-14 | 13F | Aprio Wealth Management, LLC | 12 797 | −35,58 | 114 | −21,92 | ||||
| 2025-08-14 | 13F | Mairs & Power Inc | 10 550 | 0,00 | 94 | 22,08 | ||||
| 2025-08-12 | 13F | Rhumbline Advisers | 22 121 | −15,39 | 198 | 2,60 | ||||
| 2025-05-15 | 13F | Barclays Plc | 0 | −100,00 | 0 | |||||
| 2025-08-14 | 13F | Susquehanna International Group, Llp | 428 865 | 3,72 | 3 830 | 26,00 | ||||
| 2025-08-14 | 13F | Balyasny Asset Management Llc | 11 483 | 103 | ||||||
| 2025-08-14 | 13F | Engineers Gate Manager LP | 0 | −100,00 | 0 | |||||
| 2025-08-14 | 13F | Susquehanna International Group, Llp | Call | 225 600 | −19,11 | 2 015 | −1,71 | |||
| 2025-08-14 | 13F | Two Sigma Advisers, Lp | 506 000 | −44,35 | 4 519 | −32,40 | ||||
| 2025-08-14 | 13F | Susquehanna International Group, Llp | Put | 178 900 | −47,98 | 1 598 | −36,80 | |||
| 2025-09-04 | 13F/A | Advisor Group Holdings, Inc. | 19 816 | −26,37 | 177 | −10,66 | ||||
| 2025-08-08 | 13F | Larson Financial Group LLC | 545 | 5 | ||||||
| 2025-08-08 | 13F | SBI Securities Co., Ltd. | 3 469 | 0,93 | 31 | 20,00 | ||||
| 2025-08-12 | 13F | Headwater Capital Co Ltd | 0 | −100,00 | 0 | −100,00 | ||||
| 2025-08-13 | 13F | Walleye Capital LLC | Call | 31 900 | −16,05 | 285 | 1,79 | |||
| 2025-08-08 | 13F | Pnc Financial Services Group, Inc. | 200 | 2 | ||||||
| 2025-08-13 | 13F | Wealthquest Corp | 0 | −100,00 | 0 | −100,00 | ||||
| 2025-08-13 | 13F | Walleye Capital LLC | 44 047 | 982,77 | 393 | 1 255,17 | ||||
| 2025-08-14 | 13F | Royal Bank Of Canada | 118 049 | 10,84 | 1 054 | 34,78 | ||||
| 2025-08-07 | 13F | Campbell & CO Investment Adviser LLC | 0 | −100,00 | 0 | |||||
| 2025-08-18 | 13F | Wolverine Trading, Llc | 44 170 | 68,77 | 417 | 111,17 | ||||
| 2025-08-18 | 13F | Wolverine Trading, Llc | Call | 44 200 | −40,83 | 417 | −25,93 | |||
| 2025-05-09 | 13F | Belvedere Trading LLC | Call | 0 | −100,00 | 0 | −100,00 | |||
| 2025-07-22 | 13F | Gsa Capital Partners Llp | 90 020 | −11,76 | 1 | |||||
| 2025-05-15 | 13F | RBF Capital, LLC | 0 | −100,00 | 0 | −100,00 | ||||
| 2025-08-12 | 13F | Virtu Financial LLC | 0 | −100,00 | 0 | |||||
| 2025-08-18 | 13F | Wolverine Trading, Llc | Put | 37 400 | −15,77 | 353 | 5,69 | |||
| 2025-06-27 | NP | HAOSX - Harbor Overseas Fund Institutional Class | 72 841 | −6,64 | 515 | −34,73 | ||||
| 2025-05-09 | 13F | Belvedere Trading LLC | Put | 0 | −100,00 | 0 | −100,00 | |||
| 2025-05-14 | 13F | Credit Agricole S A | 80 000 | 588 |