Grundläggande statistik
| Institutionella aktier (lång) | 3 707 470 - 47,01% (ex 13D/G) - change of −1,10MM shares −22,80% MRQ |
| Institutionellt värde (lång) | $ 38 633 USD ($1000) |
Institutionellt ägande och aktieägare
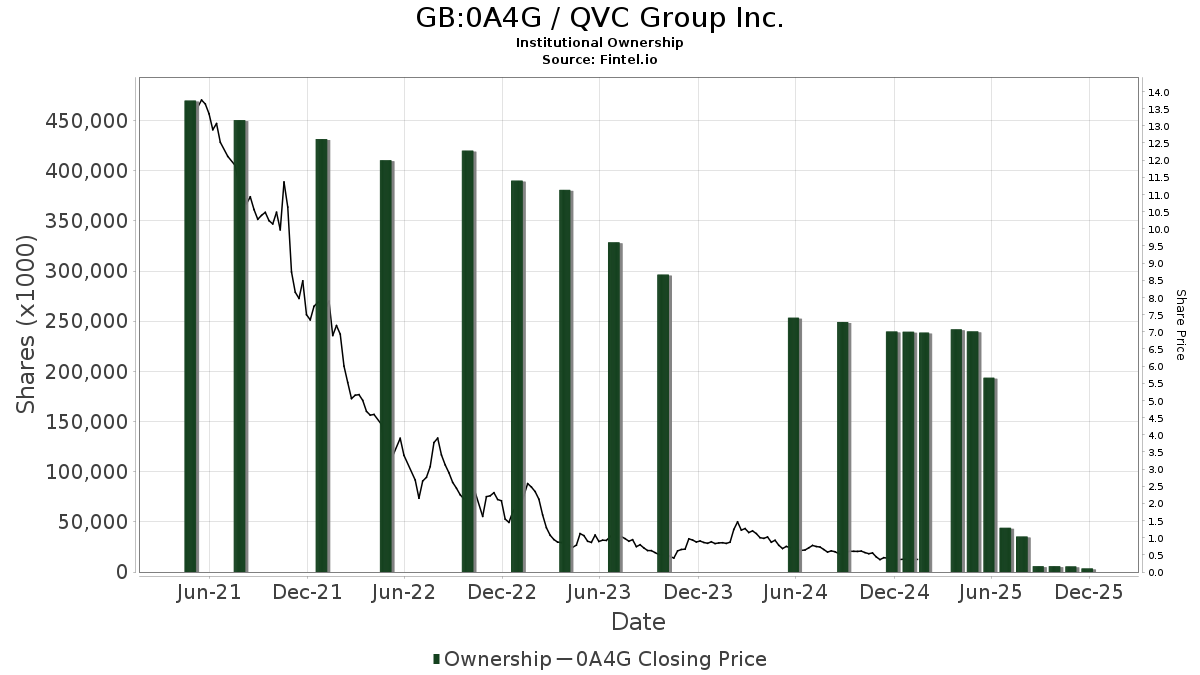
QVC Group Inc. (GB:0A4G) har 68 Institutionella ägare och aktieägare som har lämnat in 13D/G- eller 13F-formulär till Securities Exchange Commission (SEC). Dessa institut innehar totalt 3,707,470 aktier. Största aktieägare inkluderar Charles Schwab Investment Management Inc, Contrarius Group Holdings Ltd, Vanguard Group Inc, Permit Capital, LLC, Dakota Wealth Management, SFLNX - Schwab Fundamental US Large Company Index Fund Institutional Shares, BlackRock, Inc., Wittenberg Investment Management, Inc., Geode Capital Management, Llc, and UBS Group AG .
QVC Group Inc. (LSE:0A4G) Institutionell ägarstruktur visar institutioners och fonders nuvarande positioner i företaget, samt de senaste förändringarna i positionernas storlek. Större aktieägare kan vara enskilda investerare, fonder, hedgefonder eller institutioner. Bilaga 13D visar att investeraren äger (eller ägde) mer än 5% av företaget och avser (eller avsåg) att aktivt eftersträva en förändring av affärsstrategin. Schedule 13G indikerar en passiv investering på över 5%.
Fondsentimentets poäng
Fondsentimentet poängen(fka Ägarackumulation-poäng) visar vilka aktier som är mest köpta av fonder. Det är resultatet av en sofistikerad kvantitativ flerfaktormodell som identifierar företag med de högsta nivåerna av institutionell ackumulering. Poängsättningsmodellen använder en kombination av den totala ökningen av redovisade ägare, förändringarna i portföljallokeringarna för dessa ägare och andra mått. Siffran sträcker sig från 0 till 100, där högre siffror indikerar en högre nivå av ackumulering i förhållande till sina konkurrenter, och 50 är genomsnittet.
Uppdateringsfrekvens: Dagligen
Se Ownership Explorer, som innehåller en lista över de högst rankade företagen.
AI+ Ask Fintel’s AI assistant about QVC Group Inc..
Select a question to share a public post with an AI-crafted answer.
Thinking of good questions…
13F- och NPORT-arkiveringar
Detaljer om 13F-arkiveringar är gratis. Detaljer om NP-arkiveringar kräver ett premiummedlemskap. Gröna rader indikerar nya positioner. Röda rader indikerar stängda positioner. Klicka på länk symbolen för att se hela transaktionshistoriken.
Uppgradera
för att låsa upp premiumdata och exportera till Excel ![]() .
.
| Fil Datum | Källa | Investerare | Typ | Genomsnittligt pris (beräknat) |
Aktier | Δ Aktier (%) |
Rapporterat värde (1000 USD) |
Δ Värde (%) |
Portföljallokering (%) |
|
|---|---|---|---|---|---|---|---|---|---|---|
| 2025-09-29 | NP | KCXIX - Knights of Columbus U.S. All Cap Index Fund I Shares | 32 | −97,83 | 0 | |||||
| 2025-11-14 | 13F | Northwestern Mutual Wealth Management Co | 0 | −100,00 | 0 | |||||
| 2026-01-26 | 13F | Whittier Trust Co Of Nevada Inc | 2 | 0,00 | 0 | |||||
| 2026-02-17 | 13F | Qube Research & Technologies Ltd | 10 354 | −3,29 | 108 | −25,00 | ||||
| 2026-02-17 | 13F | Citadel Advisors Llc | Put | 0 | −100,00 | 0 | −100,00 | |||
| 2026-02-17 | 13F | Bank Of America Corp /de/ | 405 | −98,14 | 4 | −98,63 | ||||
| 2026-02-09 | 13F | Investors Portfolio Services LLC | 8 | 0 | ||||||
| 2026-01-15 | 13F | Fortitude Family Office, LLC | 88 | 1 | ||||||
| 2026-02-13 | 13F | Diametric Capital, LP | 43 659 | 149,67 | 457 | 94,04 | ||||
| 2026-02-13 | 13F | Wells Fargo & Company/mn | 79 | −1,25 | 1 | −100,00 | ||||
| 2026-02-13 | 13F | MAI Capital Management | 27 | 0,00 | 0 | |||||
| 2026-02-17 | 13F | Fmr Llc | 39 | −22,00 | 0 | |||||
| 2026-01-21 | 13F | Newbridge Financial Services Group, Inc. | 18 | 0,00 | 0 | |||||
| 2026-02-11 | 13F | Group One Trading, L.p. | 15 794 | 102,51 | 165 | 57,14 | ||||
| 2026-02-12 | 13F | BlackRock, Inc. | 137 984 | 2,26 | 1 443 | −20,71 | ||||
| 2026-01-30 | 13F | Us Bancorp \de\ | 0 | −100,00 | 0 | |||||
| 2026-01-21 | 13F | Future Financial Wealth Managment LLC | 0 | −100,00 | 0 | |||||
| 2026-02-06 | 13F | Covestor Ltd | 0 | 0 | ||||||
| 2026-02-11 | 13F | Townsquare Capital Llc | 0 | −100,00 | 0 | −100,00 | ||||
| 2026-02-11 | 13F | TCTC Holdings, LLC | 21 | 0,00 | 0 | |||||
| 2026-02-12 | 13F | Jane Street Group, Llc | Call | 18 800 | −31,89 | 197 | −47,31 | |||
| 2026-02-12 | 13F | Jane Street Group, Llc | Put | 26 500 | −37,20 | 277 | −51,32 | |||
| 2026-02-18 | 13F/A | Empowered Funds, LLC | 11 084 | 0,03 | 116 | −22,82 | ||||
| 2026-02-18 | 13F | GWM Advisors LLC | 5 | 0,00 | 0 | |||||
| 2025-11-14 | 13F | Saba Capital Management, L.P. | 0 | −100,00 | 0 | |||||
| 2025-10-21 | 13F | Optimum Investment Advisors | 7 | 0,00 | 0 | |||||
| 2026-02-09 | 13F | Simplify Asset Management Inc. | 16 696 | 39,13 | 175 | 8,07 | ||||
| 2026-02-13 | 13F | State Street Corp | 34 451 | 0,00 | 360 | −22,41 | ||||
| 2026-02-03 | 13F | SBI Securities Co., Ltd. | 5 | 0,00 | 0 | |||||
| 2026-01-29 | 13F | Vanguard Group Inc | 612 843 | −0,34 | 6 410 | −22,72 | ||||
| 2026-01-08 | 13F | Versant Capital Management, Inc | 3 | 0,00 | 0 | |||||
| 2026-01-23 | 13F | Avion Wealth | 0 | −100,00 | 0 | |||||
| 2026-02-11 | 13F | Permit Capital, LLC | 388 062 | 7,26 | 4 059 | −16,82 | ||||
| 2025-09-29 | NP | PRFZ - Invesco FTSE RAFI US 1500 Small-Mid ETF This fund is a listed as child fund of Invesco Ltd. and if that institution has disclosed ownership in this security, then these positions will not be double counted when calculating total shares and total value | 14 805 | −98,68 | 57 | −66,07 | ||||
| 2026-02-17 | 13F | CastleKnight Management LP | 0 | −100,00 | 0 | |||||
| 2026-02-10 | 13F | Rothschild Investment Llc | 0 | −100,00 | 0 | |||||
| 2026-02-17 | 13F | Jones Financial Companies Lllp | 26 | 0,00 | 0 | |||||
| 2026-02-11 | 13F | Contrarius Group Holdings Ltd | 702 768 | 0,00 | 7 351 | −22,47 | ||||
| 2025-09-24 | NP | SFLNX - Schwab Fundamental US Large Company Index Fund Institutional Shares | 147 903 | −92,95 | 574 | 82,48 | ||||
| 2025-09-26 | NP | PRF - Invesco FTSE RAFI US 1000 ETF This fund is a listed as child fund of Invesco Ltd. and if that institution has disclosed ownership in this security, then these positions will not be double counted when calculating total shares and total value | 1 915 | −94,77 | 7 | 40,00 | ||||
| 2026-02-17 | 13F | Voleon Capital Management Lp | 0 | −100,00 | 0 | −100,00 | ||||
| 2026-02-05 | 13F | Allworth Financial LP | 1 | −75,00 | 0 | |||||
| 2025-11-14 | 13F | D. E. Shaw & Co., Inc. | 0 | −100,00 | 0 | |||||
| 2026-02-17 | 13F | Jump Financial, LLC | 13 200 | 138 | ||||||
| 2026-02-13 | 13F | Brooklands Fund Management Ltd | Call | 0 | −100,00 | 0 | ||||
| 2026-02-24 | 13F | DGS Capital Management, LLC | 0 | −100,00 | 0 | |||||
| 2026-02-17 | 13F | Two Sigma Investments, Lp | 25 318 | −6,23 | 265 | −27,47 | ||||
| 2026-02-03 | 13F | Investment Management Associates Inc /adv | 21 369 | −56,03 | 224 | −65,95 | ||||
| 2026-02-19 | 13F | Invesco Ltd. | 0 | −100,00 | 0 | |||||
| 2025-11-06 | 13F | Fairscale Capital, LLC | 0 | −100,00 | 0 | |||||
| 2026-02-10 | 13F | Bnp Paribas Arbitrage, Sa | 27 | −15,62 | 0 | |||||
| 2026-02-02 | 13F | Danske Bank A/s | 1 | 0,00 | 0 | |||||
| 2025-11-13 | 13F | Parallel Advisors, LLC | 0 | −100,00 | 0 | |||||
| 2026-02-11 | 13F | Hall Kathryn A. | 0 | −100,00 | 0 | |||||
| 2025-11-12 | 13F | Huntington National Bank | 0 | −100,00 | 0 | |||||
| 2026-01-29 | 13F | Comerica Bank | 116 | 0,00 | 1 | 0,00 | ||||
| 2025-11-14 | 13F | Goldman Sachs Group Inc | 0 | −100,00 | 0 | |||||
| 2026-02-09 | 13F | Geode Capital Management, Llc | 90 206 | 2,20 | 944 | −20,82 | ||||
| 2026-02-13 | 13F | Wittenberg Investment Management, Inc. | 114 193 | 41,05 | 1 194 | 9,34 | ||||
| 2026-02-17 | 13F | Susquehanna International Group, Llp | 19 048 | −65,27 | 199 | −73,07 | ||||
| 2026-02-17 | 13F | Advisor Group Holdings, Inc. | 753 | 0,53 | 8 | 16,67 | ||||
| 2026-01-20 | 13F | Signaturefd, Llc | 28 | 0,00 | 0 | |||||
| 2026-02-17 | 13F | Susquehanna International Group, Llp | Put | 31 200 | −59,48 | 326 | −68,59 | |||
| 2026-02-17 | 13F | Susquehanna International Group, Llp | Call | 28 400 | −29,88 | 297 | −45,60 | |||
| 2026-02-13 | 13F | Brooklands Fund Management Ltd | 35 457 | 381 | ||||||
| 2026-02-12 | 13F | McMillan Office, Inc. | 8 | 0 | ||||||
| 2026-02-13 | 13F | Morgan Stanley | 19 135 | −3,45 | 200 | −25,09 | ||||
| 2025-11-04 | 13F | Guerra Advisors Inc | 16 | 0 | ||||||
| 2026-02-11 | 13F | Hilton Head Capital Partners, LLC | 76 | 1 | ||||||
| 2026-02-03 | 13F | Costello Asset Management, INC | 20 | 0,00 | 0 | |||||
| 2026-02-12 | 13F | Renaissance Technologies Llc | 54 831 | 8,94 | 574 | −15,49 | ||||
| 2026-02-12 | 13F | Wealthspire Advisors, LLC | 0 | −100,00 | 0 | |||||
| 2026-02-13 | 13F | Charles Schwab Investment Management Inc | 995 190 | 39,40 | 10 410 | 8,09 | ||||
| 2026-02-10 | 13F | Hazlett, Burt & Watson, Inc. | 1 | 0,00 | 0 | |||||
| 2026-02-12 | 13F | BRYN MAWR TRUST Co | 0 | −100,00 | 0 | −100,00 | ||||
| 2026-02-12 | 13F | CIBC Private Wealth Group, LLC | 8 | −75,76 | 0 | |||||
| 2026-02-10 | 13F | JTC Employer Solutions Trusteee Ltd | 492 | 0,00 | 0 | |||||
| 2026-02-10 | 13F | KERR FINANCIAL PLANNING Corp | 0 | −100,00 | 0 | |||||
| 2025-11-14 | 13F | Wolverine Trading, Llc | Call | 39 600 | 555 | |||||
| 2026-02-06 | 13F | Global Retirement Partners, LLC | 9 | 0,00 | 0 | |||||
| 2025-11-14 | 13F | Wolverine Trading, Llc | Put | 13 200 | 185 | |||||
| 2026-02-17 | 13F | Northern Trust Corp | 16 668 | 14,71 | 174 | −11,22 | ||||
| 2026-02-17 | 13F | Prelude Capital Management, Llc | 10 863 | 114 | ||||||
| 2026-02-17 | 13F | Russell Investments Group, Ltd. | 4 129 | 43 | ||||||
| 2026-02-17 | 13F | Bridgeway Capital Management Inc | 11 081 | 0,00 | 116 | −22,82 | ||||
| 2025-11-19 | 13F | Sunbelt Securities, Inc. | 0 | −100,00 | 0 | |||||
| 2026-02-17 | 13F | Citadel Advisors Llc | Call | 38 100 | −0,52 | 399 | −22,87 | |||
| 2026-01-13 | 13F | Dakota Wealth Management | 154 411 | −6,14 | 1 615 | −27,22 | ||||
| 2026-01-29 | 13F | UBS Group AG | 74 398 | 5,18 | 778 | −18,45 | ||||
| 2026-02-17 | 13F | Brevan Howard Capital Management LP | 0 | −100,00 | 0 | −100,00 | ||||
| 2026-02-11 | 13F | Deseret Mutual Benefit Administrators | 82 | 0,00 | 1 | −100,00 | ||||
| 2026-02-17 | 13F | Man Group plc | 59 212 | −15,49 | 619 | −34,50 | ||||
| 2025-11-14 | 13F | Two Sigma Advisers, Lp | 0 | −100,00 | 0 | −100,00 | ||||
| 2025-11-14 | 13F | Raymond James Financial Inc | 0 | −100,00 | 0 | |||||
| 2025-11-12 | 13F | Simplex Trading, Llc | 0 | −100,00 | 0 | |||||
| 2026-01-13 | 13F | Mather Group, Llc. | 0 | −100,00 | 0 | |||||
| 2026-02-14 | 13F | Rockefeller Capital Management L.P. | 6 | 0 | ||||||
| 2026-01-23 | 13F | Farther Finance Advisors, LLC | 1 | 0 | ||||||
| 2026-02-06 | 13F | Tortoise Investment Management, LLC | 0 | −100,00 | 0 | |||||
| 2026-02-17 | 13F | Aristeia Capital Llc | 0 | −100,00 | 0 | |||||
| 2026-02-17 | 13F | Price T Rowe Associates Inc /md/ | 12 629 | 0 | ||||||
| 2026-02-17 | 13F | Royal Bank Of Canada | 16 | −99,94 | 0 | −100,00 | ||||
| 2026-01-26 | 13F | Cwm, Llc | 11 | 0,00 | 0 | |||||
| 2025-11-14 | 13F | XTX Topco Ltd | 0 | −100,00 | 0 | −100,00 |