Grundläggande statistik
| Institutionella aktier (lång) | 29 527 561 - 31,90% (ex 13D/G) - change of 0,38MM shares 1,30% MRQ |
| Institutionellt värde (lång) | $ 142 012 USD ($1000) |
Institutionellt ägande och aktieägare
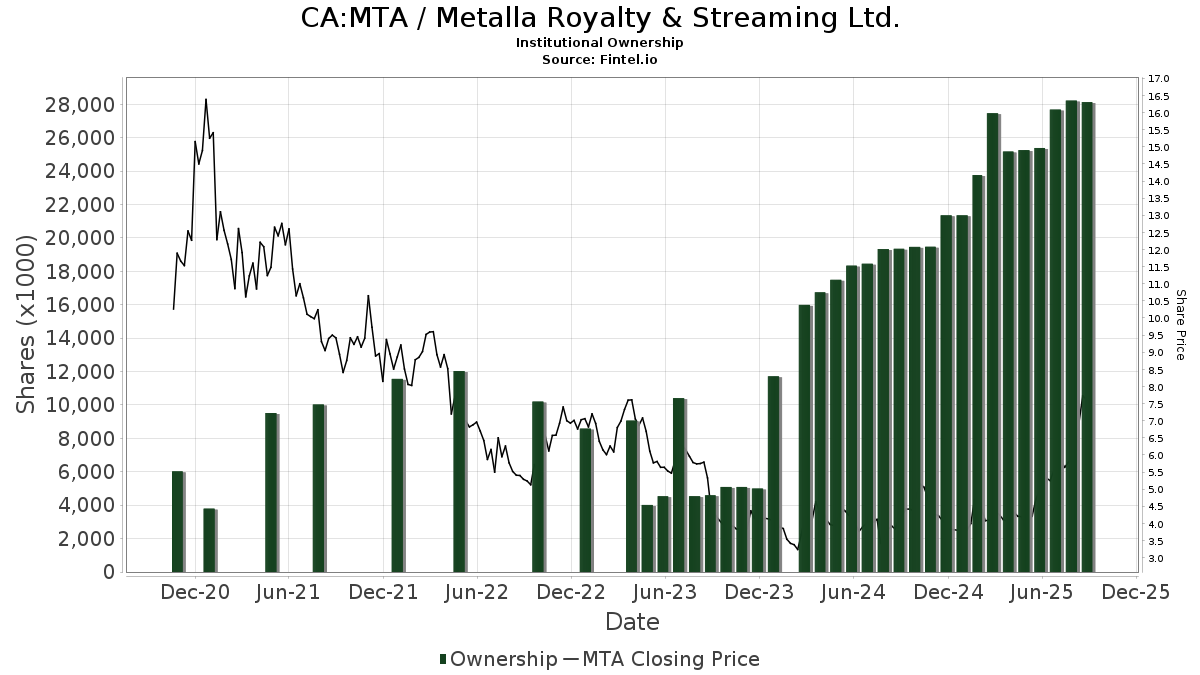
Metalla Royalty & Streaming Ltd. (CA:MTA) har 91 Institutionella ägare och aktieägare som har lämnat in 13D/G- eller 13F-formulär till Securities Exchange Commission (SEC). Dessa institut innehar totalt 29,527,561 aktier. Största aktieägare inkluderar Euro Pacific Asset Management, LLC, Merk Investments LLC, ASA Gold & Precious Metals Ltd, Van Eck Associates Corp, Fmr Llc, Global Strategic Management Inc, U S Global Investors Inc, Sprott Inc., Mackenzie Financial Corp, and Morgan Stanley .
Metalla Royalty & Streaming Ltd. (TSXV:MTA) Institutionell ägarstruktur visar institutioners och fonders nuvarande positioner i företaget, samt de senaste förändringarna i positionernas storlek. Större aktieägare kan vara enskilda investerare, fonder, hedgefonder eller institutioner. Bilaga 13D visar att investeraren äger (eller ägde) mer än 5% av företaget och avser (eller avsåg) att aktivt eftersträva en förändring av affärsstrategin. Schedule 13G indikerar en passiv investering på över 5%.
The share price as of March 27, 2026 is 8,57 / share. Previously, on March 31, 2025, the share price was 4,16 / share. This represents an increase of 106,01% over that period.
Fondsentimentets poäng
Fondsentimentet poängen(fka Ägarackumulation-poäng) visar vilka aktier som är mest köpta av fonder. Det är resultatet av en sofistikerad kvantitativ flerfaktormodell som identifierar företag med de högsta nivåerna av institutionell ackumulering. Poängsättningsmodellen använder en kombination av den totala ökningen av redovisade ägare, förändringarna i portföljallokeringarna för dessa ägare och andra mått. Siffran sträcker sig från 0 till 100, där högre siffror indikerar en högre nivå av ackumulering i förhållande till sina konkurrenter, och 50 är genomsnittet.
Uppdateringsfrekvens: Dagligen
Se Ownership Explorer, som innehåller en lista över de högst rankade företagen.
AI+ Ask Fintel’s AI assistant about Metalla Royalty & Streaming Ltd..
Select a question to share a public post with an AI-crafted answer.
Thinking of good questions…
13F- och NPORT-arkiveringar
Detaljer om 13F-arkiveringar är gratis. Detaljer om NP-arkiveringar kräver ett premiummedlemskap. Gröna rader indikerar nya positioner. Röda rader indikerar stängda positioner. Klicka på länk symbolen för att se hela transaktionshistoriken.
Uppgradera
för att låsa upp premiumdata och exportera till Excel ![]() .
.
| Fil Datum | Källa | Investerare | Typ | Genomsnittligt pris (beräknat) |
Aktier | Δ Aktier (%) |
Rapporterat värde (1000 USD) |
Δ Värde (%) |
Portföljallokering (%) |
|
|---|---|---|---|---|---|---|---|---|---|---|
| 2025-10-22 | 13F | CoreCap Advisors, LLC | 0 | −100,00 | 0 | |||||
| 2026-02-23 | 13F | Virtu Financial LLC | 21 540 | 16,55 | 0 | |||||
| 2026-02-12 | 13F | Insigneo Advisory Services, Llc | 343 024 | −3,92 | 2 669 | 17,69 | ||||
| 2026-02-17 | 13F | Millennium Management Llc | 17 759 | −23,48 | 138 | −6,12 | ||||
| 2025-11-05 | 13F | Sentry Investment Management Llc | 0 | −100,00 | 0 | |||||
| 2026-02-13 | 13F | Global Strategic Management Inc | 2 082 799 | 157,03 | 16 | −99,84 | ||||
| 2026-02-13 | 13F | Toroso Investments, LLC | 23 132 | −3,64 | 180 | 17,76 | ||||
| 2025-11-12 | 13F | Creekmur Asset Management LLC | 179 | 17 800,00 | 1 | |||||
| 2026-02-12 | 13F | SWAN Capital LLC | 0 | −100,00 | 0 | |||||
| 2026-02-11 | 13F | Gwn Securities Inc. | 42 877 | 334 | ||||||
| 2026-02-06 | 13F | Global Retirement Partners, LLC | 4 360 | 34 | ||||||
| 2026-02-13 | 13F | Arrowstreet Capital, Limited Partnership | 169 103 | 409,09 | 1 301 | 516,59 | ||||
| 2026-02-17 | 13F | Man Group plc | 24 945 | −44,69 | 194 | −32,17 | ||||
| 2025-11-14 | 13F | Cubist Systematic Strategies, LLC | 63 266 | 73,41 | 402 | 186,43 | ||||
| 2026-02-13 | 13F | Merk Investments LLC | 3 000 000 | 0,00 | 23 340 | 22,52 | ||||
| 2026-01-07 | 13F | Northside Capital Management, LLC | 111 578 | 0,00 | 868 | 22,60 | ||||
| 2026-02-10 | 13F | Hillsdale Investment Management Inc. | 285 900 | −9,61 | 2 204 | 9,33 | ||||
| 2026-02-12 | 13F | Bank Of Montreal /can/ | 0 | −100,00 | 0 | |||||
| 2026-02-12 | 13F | Sprott Inc. | 1 415 520 | 91,75 | 11 013 | 134,95 | ||||
| 2026-02-11 | 13F | Horizon Kinetics Asset Management Llc | 404 397 | 0,00 | 3 146 | 22,56 | ||||
| 2026-02-17 | 13F | Advisor Group Holdings, Inc. | 84 534 | 495,98 | 658 | 742,31 | ||||
| 2026-02-13 | 13F | SRS Capital Advisors, Inc. | 2 200 | 0,00 | 17 | 30,77 | ||||
| 2026-02-17 | 13F | Cetera Investment Advisers | 29 681 | 231 | ||||||
| 2026-02-17 | 13F | Susquehanna International Group, Llp | Put | 17 100 | −68,85 | 133 | −61,78 | |||
| 2026-02-17 | 13F | Susquehanna International Group, Llp | Call | 11 000 | −74,42 | 86 | −68,86 | |||
| 2026-02-06 | 13F | HighTower Advisors, LLC | 127 844 | −3,29 | 995 | 18,47 | ||||
| 2026-02-12 | 13F | Jane Street Group, Llc | Call | 0 | −100,00 | 0 | −100,00 | |||
| 2026-02-13 | 13F | OMERS ADMINISTRATION Corp | 0 | −100,00 | 0 | |||||
| 2026-02-17 | 13F | Susquehanna International Group, Llp | 77 353 | 12,53 | 602 | 37,84 | ||||
| 2025-11-14 | 13F | Balyasny Asset Management Llc | 0 | −100,00 | 0 | −100,00 | ||||
| 2025-11-14 | 13F | Northern Trust Corp | 0 | −100,00 | 0 | |||||
| 2026-02-12 | 13F | Wealthspire Advisors, LLC | 34 475 | 268 | ||||||
| 2026-02-12 | 13F | Alps Advisors Inc | 284 691 | 2 215 | ||||||
| 2025-10-06 | 13F | NWF Advisory Services Inc. | 0 | −100,00 | 0 | −100,00 | ||||
| 2026-02-06 | 13F | Banque Cantonale Vaudoise | 4 080 | 31 | ||||||
| 2026-02-17 | 13F | Royal Bank Of Canada | 7 084 | −1,12 | 55 | 22,22 | ||||
| 2026-01-07 | 13F | Massmutual Trust Co Fsb/adv | 4 680 | 0,00 | 36 | 24,14 | ||||
| 2025-09-30 | NP | ASA Gold & Precious Metals Ltd | 3 000 000 | 0,00 | 16 410 | 69,88 | ||||
| 2026-01-13 | 13F | Stonehage Fleming Financial Services Holdings Ltd | 20 490 | 0,00 | 159 | 22,31 | ||||
| 2026-02-12 | 13F | Campbell & CO Investment Adviser LLC | 62 290 | 442,83 | 485 | 572,22 | ||||
| 2026-02-17 | 13F | Raymond James Financial Inc | 291 485 | −3,79 | 2 268 | 17,89 | ||||
| 2026-01-16 | 13F | Ronald Blue Trust, Inc. | 1 500 | 0,00 | 12 | 22,22 | ||||
| 2025-11-13 | 13F | Marshall Wace, Llp | 0 | −100,00 | 0 | |||||
| 2026-02-10 | 13F | Quantbot Technologies LP | 40 689 | 12,51 | 317 | 37,99 | ||||
| 2026-02-13 | 13F | Morgan Stanley | 729 656 | 46,97 | 5 677 | 80,08 | ||||
| 2026-02-17 | 13F | Point72 Asset Management, L.P. | 13 287 | 103 | ||||||
| 2026-01-26 | 13F | PFG Investments, LLC | 11 910 | 11,86 | 93 | 37,31 | ||||
| 2026-03-04 | 13F | Leonteq Securities AG | 0 | −100,00 | 0 | |||||
| 2026-02-13 | 13F | MAI Capital Management | 2 419 | 0,00 | 19 | 20,00 | ||||
| 2026-02-13 | 13F | Walleye Capital LLC | 35 439 | −88,27 | 276 | −85,67 | ||||
| 2026-02-17 | 13F | XTX Topco Ltd | 38 862 | 33,37 | 302 | 63,24 | ||||
| 2026-02-12 | 13F | Jane Street Group, Llc | 358 962 | 147,15 | 2 793 | 202,82 | ||||
| 2026-02-17 | 13F | Boreal Capital Management LLC | 41 630 | 0,00 | 324 | 22,35 | ||||
| 2026-02-10 | 13F | Bnp Paribas Arbitrage, Sa | 10 194 | 79 | ||||||
| 2026-02-12 | 13F | Commonwealth Equity Services, Llc | 14 319 | 111 | ||||||
| 2026-02-17 | 13F | Brevan Howard Capital Management LP | 67 095 | 281,22 | 522 | 369,37 | ||||
| 2026-02-13 | 13F | Wexford Capital Lp | 10 174 | 55,80 | 79 | 92,68 | ||||
| 2026-02-05 | 13F | Cambridge Investment Research Advisors, Inc. | 58 173 | −41,62 | 0 | |||||
| 2026-01-23 | 13F | Halbert Hargrove Global Advisors, Llc | 1 200 | 9 | ||||||
| 2026-02-17 | 13F | Graham Capital Management, L.P. | 34 621 | −18,31 | 269 | 0,00 | ||||
| 2026-02-17 | 13F | Tudor Investment Corp Et Al | 387 567 | 2 105,97 | 3 015 | 2 616,22 | ||||
| 2026-02-11 | 13F | Simplex Trading, Llc | 19 555 | −56,48 | 152 | |||||
| 2026-01-07 | 13F | Hilltop National Bank | 869 | 0,00 | 7 | 20,00 | ||||
| 2026-01-29 | 13F | UBS Group AG | 5 576 | −85,47 | 43 | −82,30 | ||||
| 2026-02-06 | 13F | Pnc Financial Services Group, Inc. | 1 000 | 0,00 | 8 | 16,67 | ||||
| 2026-02-17 | 13F | Quadrature Capital Ltd | 30 503 | 141,17 | 237 | 196,25 | ||||
| 2026-02-17 | 13F | Jain Global LLC | 0 | −100,00 | 0 | |||||
| 2026-02-17 | 13F | Perritt Capital Management Inc | 0 | −100,00 | 0 | |||||
| 2026-02-17 | 13F | Two Sigma Investments, Lp | 669 055 | 43,05 | 5 205 | 75,25 | ||||
| 2025-11-14 | 13F | Hrt Financial Lp | 0 | −100,00 | 0 | |||||
| 2026-01-26 | 13F | Cwm, Llc | 3 955 | −0,53 | 0 | |||||
| 2026-02-17 | 13F | Aquatic Capital Management LLC | 15 784 | 123 | ||||||
| 2026-02-17 | 13F | Jones Financial Companies Lllp | 496 | 4 | ||||||
| 2026-02-18 | 13F | Mackenzie Financial Corp | 731 231 | 1 657,77 | 5 557 | 1 996,98 | ||||
| 2026-02-12 | 13F | Renaissance Technologies Llc | 145 700 | 40,42 | 1 134 | 72,19 | ||||
| 2026-02-11 | 13F | Jpmorgan Chase & Co | 150 282 | 1 120,71 | 1 169 | 1 398,72 | ||||
| 2026-02-17 | 13F | LB Partners LLC | 36 000 | 0,00 | 280 | 22,81 | ||||
| 2025-11-14 | 13F | Point72 (DIFC) Ltd | 1 200 | −61,24 | 8 | −36,36 | ||||
| 2026-02-02 | 13F | Mutual Advisors, LLC | 21 670 | 169 | ||||||
| 2026-02-13 | 13F | Citigroup Inc | 0 | −100,00 | 0 | |||||
| 2026-02-17 | 13F | D. E. Shaw & Co., Inc. | 184 463 | −41,17 | 1 435 | −27,93 | ||||
| 2025-11-14 | 13F | Wolverine Trading, Llc | 18 694 | 85,25 | 117 | 207,89 | ||||
| 2026-02-13 | 13F | K2 Principal Fund, L.p. | 69 760 | 543 | ||||||
| 2026-03-25 | 13F | McAlvany Wealth Management LLC | 137 627 | 1 071 | ||||||
| 2025-11-14 | 13F | Goldman Sachs Group Inc | 0 | −100,00 | 0 | |||||
| 2026-01-27 | 13F | Wealth Enhancement Trust Services, Inc. | 12 312 | 96 | ||||||
| 2026-01-28 | 13F | U S Global Investors Inc | 1 432 510 | 75,86 | 11 145 | 115,47 | ||||
| 2026-02-03 | 13F | Sequoia Financial Advisors, LLC | 13 805 | 0,00 | 107 | 22,99 | ||||
| 2025-11-14 | 13F | Oxford Asset Management Llp | 47 008 | 42,73 | 299 | 136,51 | ||||
| 2026-02-17 | 13F | Old Mission Capital Llc | 0 | −100,00 | 0 | |||||
| 2026-02-17 | 13F | Two Sigma Advisers, Lp | 415 400 | 26,18 | 3 232 | 54,59 | ||||
| 2026-02-12 | 13F | Arbiter Partners Capital Management LLC | 34 000 | 265 | ||||||
| 2026-02-09 | 13F | Fisher Asset Management, LLC | 0 | −100,00 | 0 | |||||
| 2025-11-12 | 13F | Legacy Wealth Managment, LLC/ID | 0 | −100,00 | 0 | |||||
| 2026-02-19 | 13F | Mcguire Capital Advisors Inc | 500 | 4 | ||||||
| 2026-02-13 | 13F | Extract Advisors LLC | 456 339 | 3 550 | ||||||
| 2026-02-12 | 13F | Federation des caisses Desjardins du Quebec | 12 783 | −12,70 | 94 | 9,30 | ||||
| 2026-01-14 | 13F | AA Financial Advisors, LLC | 10 000 | 78 | ||||||
| 2026-02-13 | 13F | National Bank Of Canada /fi/ | 3 066 | −4,31 | 23 | 15,79 | ||||
| 2026-01-21 | 13F/A | Euro Pacific Asset Management, LLC | 5 742 309 | 0,86 | 43 | 22,86 | ||||
| 2026-02-13 | 13F | Barclays Plc | 0 | −100,00 | 0 | |||||
| 2026-01-29 | 13F | IMC-Chicago, LLC | 0 | −100,00 | 0 | |||||
| 2026-02-17 | 13F | Fmr Llc | 2 363 655 | 50,96 | 18 389 | 84,96 | ||||
| 2026-02-13 | 13F | Kestra Advisory Services, LLC | 5 000 | 39 | ||||||
| 2026-02-17 | 13F | Bank Of America Corp /de/ | 146 507 | −8,39 | 1 140 | 12,22 | ||||
| 2026-02-17 | 13F | Citadel Advisors Llc | Call | 96 100 | 707,56 | 748 | 896,00 | |||
| 2026-02-17 | 13F | Citadel Advisors Llc | 80 620 | −82,08 | 627 | −78,05 | ||||
| 2026-02-17 | 13F | Citadel Advisors Llc | Put | 22 400 | 12,00 | 174 | 37,01 | |||
| 2026-02-11 | 13F | Tradition Wealth Management, LLC | 10 329 | 0,00 | 80 | 23,08 | ||||
| 2026-02-17 | 13F | Qube Research & Technologies Ltd | 16 703 | 4,95 | 130 | 27,72 | ||||
| 2025-10-27 | 13F | Kiker Wealth Management, LLC | 0 | −100,00 | 0 | |||||
| 2026-02-18 | 13F | Papamarkou Wellner Asset Management inc. | 29 618 | −2,16 | 230 | 19,79 | ||||
| 2026-02-13 | 13F | Wells Fargo & Company/mn | 12 681 | 0,00 | 99 | 22,50 | ||||
| 2026-02-13 | 13F | Van Eck Associates Corp | 2 432 344 | −8,67 | 19 | 12,50 | ||||
| 2026-01-28 | 13F | Eagle Global Advisors Llc | 50 300 | −19,90 | 391 | −1,76 | ||||
| 2026-02-11 | 13F | Group One Trading, L.p. | 40 689 | 96,33 | 317 | 141,22 | ||||
| 2026-02-20 | 13F | Sunbelt Securities, Inc. | 16 700 | 0,00 | 130 | 21,70 |