Grundläggande statistik
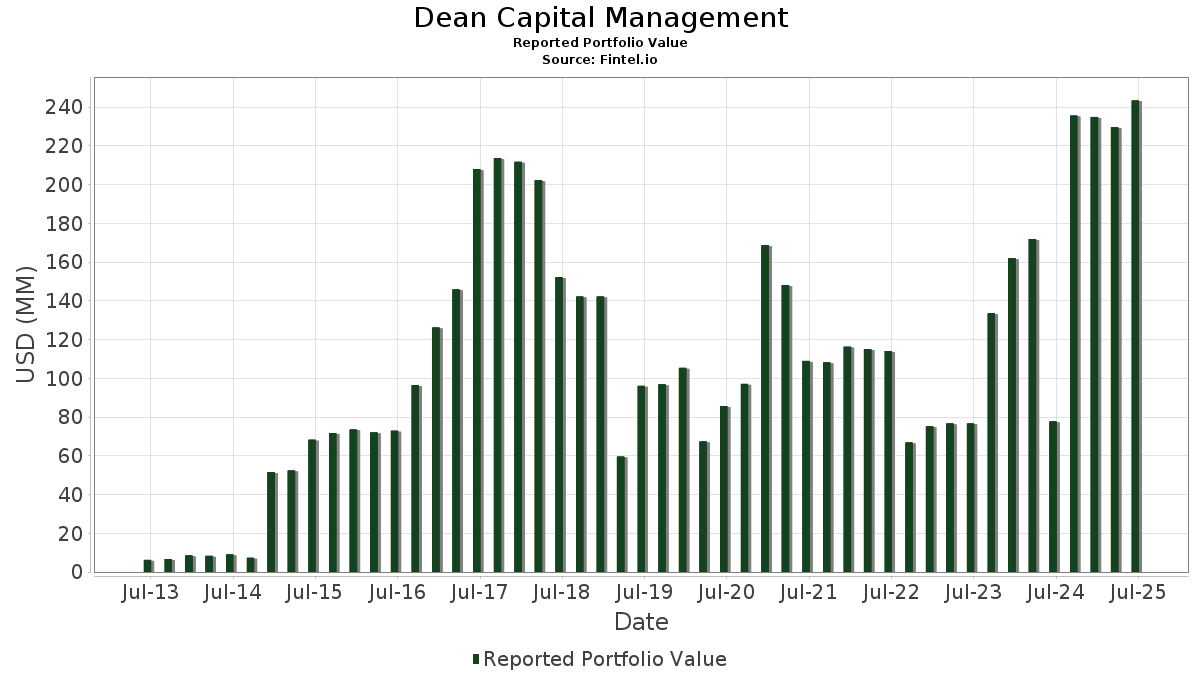
| Portföljvärde | $ 243 325 361 |
| Aktuella positioner | 124 |
Senaste innehav, resultat, förvaltat kapital (från 13F, 13D)
Dean Capital Management har redovisat 124 totala innehav i sina senaste SEC-arkiveringar. Det senaste portföljvärdet beräknas vara $ 243 325 361 USD. Faktiskt förvaltade tillgångar (AUM) är detta värde plus likvida medel (som inte redovisas). Dean Capital Managements största innehav är Littelfuse, Inc. (US:LFUS) , Bel Fuse Inc. (US:BELFB) , Alamo Group Inc. (US:ALG) , Advanced Energy Industries, Inc. (US:AEIS) , and ESCO Technologies Inc. (US:ESE) . Dean Capital Managements nya positioner inkluderar YETI Holdings, Inc. (US:YETI) , Atkore Inc. (US:ATKR) , Quaker Chemical Corporation (US:KWR) , MKS Inc. (US:MKSI) , and .
Största ökningarna detta kvartal
Vi använder förändringen i portföljallokeringen eftersom det är det mest meningsfulla måttet. Förändringar kan bero på transaktioner eller förändringar i aktiekurser.
| Värdepapper | Aktier (MM) |
Värde (MM$) |
Portfölj % av | ΔPortfölj % av |
|---|---|---|---|---|
| LFUS / Littelfuse, Inc. | 0,02 | 5,05 | 2,0745 | 1,4045 |
| WHD / Cactus, Inc. | 0,07 | 3,13 | 1,2718 | 1,2718 |
| SHOO / Steven Madden, Ltd. | 0,12 | 2,91 | 1,1965 | 1,1965 |
| YETI / YETI Holdings, Inc. | 0,08 | 2,42 | 0,9941 | 0,9941 |
| ATKR / Atkore Inc. | 0,02 | 1,71 | 0,7032 | 0,7032 |
| EMN / Eastman Chemical Company | 0,02 | 1,61 | 0,6614 | 0,6614 |
| WCC / WESCO International, Inc. | 0,01 | 1,56 | 0,6403 | 0,6403 |
| VRRM / Verra Mobility Corporation | 0,08 | 2,10 | 0,8519 | 0,5730 |
| BELFB / Bel Fuse Inc. | 0,04 | 4,10 | 1,6846 | 0,5606 |
| KWR / Quaker Chemical Corporation | 0,01 | 1,33 | 0,5476 | 0,5476 |
Största minskningarna detta kvartal
Vi använder förändringen i portföljallokeringen eftersom det är det mest meningsfulla måttet. Förändringar kan bero på transaktioner eller förändringar i aktiepriser.
| Värdepapper | Aktier (MM) |
Värde (MM$) |
Portfölj % av | ΔPortfölj % av |
|---|---|---|---|---|
| MMS / Maximus, Inc. | 0,02 | 1,70 | 0,6994 | −0,8744 |
| SLGN / Silgan Holdings Inc. | 0,02 | 1,30 | 0,5275 | −0,7997 |
| EIG / Employers Holdings, Inc. | 0,02 | 1,02 | 0,4165 | −0,6293 |
| CSGS / CSG Systems International, Inc. | 0,04 | 2,38 | 0,9673 | −0,5299 |
| SFNC / Simmons First National Corporation | 0,02 | 0,37 | 0,1491 | −0,5024 |
| JBSS / John B. Sanfilippo & Son, Inc. | 0,01 | 0,86 | 0,3480 | −0,4789 |
| BNL / Broadstone Net Lease, Inc. | 0,13 | 2,12 | 0,8629 | −0,3771 |
| HCKT / The Hackett Group, Inc. | 0,07 | 1,68 | 0,6838 | −0,3469 |
| CNMD / CONMED Corporation | 0,02 | 1,17 | 0,4807 | −0,2903 |
| SPB / Spectrum Brands Holdings, Inc. | 0,01 | 0,40 | 0,1635 | −0,2869 |
13F- och fond arkiveringar
Denna blankett lämnades in den 2025-08-14 för rapporteringsperioden 2025-06-30. Klicka på länksymbolen för att se hela transaktionshistoriken.
Uppgradera för att låsa upp premiumdata och exportera till Excel![]() .
.
| Värdepapper | Typ | Genomsnittligt aktiepris | Aktier (MM) |
ΔAktier (%) |
ΔAktier (%) |
Värde ($MM) |
Portfölj (%) |
ΔPortfölj (%) |
|
|---|---|---|---|---|---|---|---|---|---|
| LFUS / Littelfuse, Inc. | 0,02 | 184,84 | 5,05 | 228,37 | 2,0745 | 1,4045 | |||
| BELFB / Bel Fuse Inc. | 0,04 | 21,76 | 4,10 | 58,94 | 1,6846 | 0,5606 | |||
| ALG / Alamo Group Inc. | 0,02 | −4,16 | 4,06 | 17,44 | 1,6691 | 0,1624 | |||
| AEIS / Advanced Energy Industries, Inc. | 0,03 | −12,95 | 4,06 | 21,04 | 1,6507 | 0,1886 | |||
| ESE / ESCO Technologies Inc. | 0,02 | 15,81 | 3,88 | 39,66 | 1,5935 | 0,3838 | |||
| VSH / Vishay Intertechnology, Inc. | 0,22 | 68,34 | 3,44 | 68,15 | 1,3974 | 0,5065 | |||
| WHD / Cactus, Inc. | 0,07 | 3,13 | 1,2718 | 1,2718 | |||||
| BK / The Bank of New York Mellon Corporation | 0,03 | 5,66 | 3,11 | 14,79 | 1,2653 | 0,0836 | |||
| SHOO / Steven Madden, Ltd. | 0,12 | 2,91 | 1,1965 | 1,1965 | |||||
| WERN / Werner Enterprises, Inc. | 0,11 | 28,58 | 2,90 | 20,07 | 1,1797 | 0,1265 | |||
| INDB / Independent Bank Corp. | 0,05 | 7,59 | 2,87 | 8,01 | 1,1671 | 0,0087 | |||
| HP / Helmerich & Payne, Inc. | 0,19 | 61,67 | 2,83 | −6,17 | 1,1625 | −0,1509 | |||
| INVX / Innovex International, Inc. | 0,18 | 17,97 | 2,81 | 2,59 | 1,1440 | −0,0511 | |||
| PZZA / Papa John's International, Inc. | 0,06 | −10,27 | 2,73 | 6,89 | 1,1217 | 0,0093 | |||
| ASTE / Astec Industries, Inc. | 0,07 | 51,18 | 2,72 | 82,99 | 1,1186 | 0,4704 | |||
| SRCE / 1st Source Corporation | 0,04 | −2,44 | 2,62 | 1,24 | 1,0661 | −0,0626 | |||
| THFF / First Financial Corporation | 0,05 | 11,00 | 2,59 | 22,83 | 1,0520 | 0,1338 | |||
| DG / Dollar General Corporation | 0,02 | 5,66 | 2,55 | 37,45 | 1,0371 | 0,2283 | |||
| LHX / L3Harris Technologies, Inc. | 0,01 | 5,65 | 2,54 | 26,64 | 1,0451 | 0,1700 | |||
| RUSHA / Rush Enterprises, Inc. | 0,05 | 17,89 | 2,51 | 13,67 | 1,0214 | 0,0585 | |||
| WKC / World Kinect Corporation | 0,09 | −6,25 | 2,46 | −6,29 | 1,0107 | −0,1326 | |||
| MCHP / Microchip Technology Incorporated | 0,03 | 23,32 | 2,44 | 79,25 | 1,0013 | 0,4091 | |||
| YETI / YETI Holdings, Inc. | 0,08 | 2,42 | 0,9941 | 0,9941 | |||||
| AEE / Ameren Corporation | 0,03 | 5,65 | 2,40 | 1,05 | 0,9875 | −0,0483 | |||
| CSGS / CSG Systems International, Inc. | 0,04 | −35,88 | 2,38 | −30,76 | 0,9673 | −0,5299 | |||
| CRI / Carter's, Inc. | 0,08 | 44,08 | 2,37 | 6,14 | 0,9742 | 0,0011 | |||
| WRB / W. R. Berkley Corporation | 0,03 | 5,65 | 2,36 | 9,10 | 0,9710 | 0,0273 | |||
| CATY / Cathay General Bancorp | 0,05 | 24,80 | 2,36 | 32,04 | 0,9583 | 0,1804 | |||
| EHC / Encompass Health Corporation | 0,02 | −15,56 | 2,35 | 2,22 | 0,9652 | −0,0356 | |||
| SMP / Standard Motor Products, Inc. | 0,08 | 13,02 | 2,34 | 39,28 | 0,9531 | 0,2195 | |||
| JOUT / Johnson Outdoors Inc. | 0,08 | 21,44 | 2,33 | 48,03 | 0,9483 | 0,2614 | |||
| PLOW / Douglas Dynamics, Inc. | 0,08 | 14,48 | 2,32 | 45,23 | 0,9410 | 0,2465 | |||
| SSNC / SS&C Technologies Holdings, Inc. | 0,03 | 5,65 | 2,31 | 4,75 | 0,9407 | −0,0221 | |||
| PRG / PROG Holdings, Inc. | 0,08 | 83,54 | 2,24 | 102,53 | 0,9225 | 0,4396 | |||
| PB / Prosperity Bancshares, Inc. | 0,03 | 5,66 | 2,21 | 3,95 | 0,8982 | −0,0277 | |||
| ARW / Arrow Electronics, Inc. | 0,02 | 5,65 | 2,20 | 29,70 | 0,9048 | 0,1650 | |||
| HIG / The Hartford Insurance Group, Inc. | 0,02 | 5,64 | 2,19 | 8,35 | 0,9017 | 0,0192 | |||
| JAZZ / Jazz Pharmaceuticals plc | 0,02 | 24,33 | 2,18 | 6,25 | 0,8942 | 0,0022 | |||
| DGX / Quest Diagnostics Incorporated | 0,01 | 5,66 | 2,17 | 12,13 | 0,8832 | 0,0392 | |||
| AIZ / Assurant, Inc. | 0,01 | 5,66 | 2,15 | −0,51 | 0,8835 | −0,0580 | |||
| PRGO / Perrigo Company plc | 0,08 | 52,57 | 2,15 | 45,39 | 0,8726 | 0,2293 | |||
| RGA / Reinsurance Group of America, Incorporated | 0,01 | 17,94 | 2,15 | 18,84 | 0,8816 | 0,0950 | |||
| BNL / Broadstone Net Lease, Inc. | 0,13 | −20,80 | 2,12 | −25,44 | 0,8629 | −0,3771 | |||
| QCRH / QCR Holdings, Inc. | 0,03 | −2,97 | 2,11 | −7,61 | 0,8678 | −0,1281 | |||
| VRRM / Verra Mobility Corporation | 0,08 | 190,31 | 2,10 | 227,34 | 0,8519 | 0,5730 | |||
| KMT / Kennametal Inc. | 0,09 | 136,76 | 2,09 | 155,37 | 0,8606 | 0,5031 | |||
| DOV / Dover Corporation | 0,01 | 5,66 | 2,08 | 10,19 | 0,8539 | 0,0324 | |||
| ATO / Atmos Energy Corporation | 0,01 | 5,65 | 2,07 | 5,34 | 0,8418 | −0,0149 | |||
| GTES / Gates Industrial Corporation plc | 0,09 | 25,54 | 2,06 | 57,10 | 0,8367 | 0,2656 | |||
| TTWO / Take-Two Interactive Software, Inc. | 0,01 | 5,65 | 2,02 | 23,81 | 0,8227 | 0,1104 | |||
| BWA / BorgWarner Inc. | 0,06 | 5,66 | 2,01 | 23,45 | 0,8246 | 0,1166 | |||
| AVY / Avery Dennison Corporation | 0,01 | 22,65 | 1,99 | 20,97 | 0,8178 | 0,1008 | |||
| SCL / Stepan Company | 0,04 | 147,16 | 1,99 | 145,25 | 0,8087 | 0,4550 | |||
| HTLD / Heartland Express, Inc. | 0,23 | 22,94 | 1,97 | 15,20 | 0,8098 | 0,0646 | |||
| OGE / OGE Energy Corp. | 0,04 | 5,66 | 1,97 | 2,02 | 0,8007 | −0,0406 | |||
| AMP / Ameriprise Financial, Inc. | 0,00 | 5,65 | 1,97 | 16,46 | 0,8085 | 0,0726 | |||
| USFD / US Foods Holding Corp. | 0,03 | 5,65 | 1,96 | 24,29 | 0,8058 | 0,1185 | |||
| COLM / Columbia Sportswear Company | 0,03 | 28,13 | 1,95 | 3,44 | 0,8027 | −0,0203 | |||
| AZO / AutoZone, Inc. | 0,00 | −6,57 | 1,95 | −9,04 | 0,8025 | −0,1328 | |||
| RRX / Regal Rexnord Corporation | 0,01 | 35,99 | 1,95 | 73,16 | 0,8009 | 0,3105 | |||
| REG / Regency Centers Corporation | 0,03 | 15,54 | 1,94 | 11,61 | 0,7981 | 0,0398 | |||
| CNP / CenterPoint Energy, Inc. | 0,05 | −20,39 | 1,90 | −19,25 | 0,7825 | −0,2450 | |||
| GSBC / Great Southern Bancorp, Inc. | 0,03 | 9,68 | 1,86 | 16,45 | 0,7652 | 0,0685 | |||
| IFF / International Flavors & Fragrances Inc. | 0,03 | 5,65 | 1,86 | 0,11 | 0,7648 | −0,0450 | |||
| RF / Regions Financial Corporation | 0,08 | 5,65 | 1,86 | 14,40 | 0,7641 | 0,0557 | |||
| AVB / AvalonBay Communities, Inc. | 0,01 | 17,43 | 1,85 | 11,32 | 0,7601 | 0,0364 | |||
| PR / Permian Resources Corporation | 0,14 | 17,87 | 1,85 | 15,94 | 0,7593 | 0,0648 | |||
| ITT / ITT Inc. | 0,01 | 5,66 | 1,85 | 28,26 | 0,7509 | 0,1235 | |||
| RJF / Raymond James Financial, Inc. | 0,01 | 5,65 | 1,83 | 16,62 | 0,7527 | 0,0686 | |||
| CTRA / Coterra Energy Inc. | 0,07 | 39,28 | 1,82 | 22,33 | 0,7497 | 0,0999 | |||
| BR / Broadridge Financial Solutions, Inc. | 0,01 | 5,66 | 1,79 | 5,93 | 0,7264 | −0,0088 | |||
| LAD / Lithia Motors, Inc. | 0,01 | 21,16 | 1,78 | 39,43 | 0,7299 | 0,1749 | |||
| AGCO / AGCO Corporation | 0,02 | 5,66 | 1,77 | 17,72 | 0,7293 | 0,0727 | |||
| CBRE / CBRE Group, Inc. | 0,01 | 5,65 | 1,77 | 13,20 | 0,7264 | 0,0461 | |||
| XEL / Xcel Energy Inc. | 0,03 | −7,22 | 1,76 | −10,77 | 0,7252 | −0,1362 | |||
| COHU / Cohu, Inc. | 0,09 | 154,53 | 1,73 | 232,88 | 0,7115 | 0,4849 | |||
| KNX / Knight-Swift Transportation Holdings Inc. | 0,04 | 32,14 | 1,72 | 34,48 | 0,7008 | 0,1418 | |||
| CAG / Conagra Brands, Inc. | 0,08 | 5,65 | 1,72 | −18,92 | 0,7005 | −0,2254 | |||
| ATKR / Atkore Inc. | 0,02 | 1,71 | 0,7032 | 0,7032 | |||||
| MMS / Maximus, Inc. | 0,02 | −54,24 | 1,70 | −52,91 | 0,6994 | −0,8744 | |||
| STAG / STAG Industrial, Inc. | 0,05 | 5,65 | 1,70 | 6,11 | 0,6991 | 0,0007 | |||
| RSG / Republic Services, Inc. | 0,01 | −12,53 | 1,69 | −10,94 | 0,6927 | −0,1317 | |||
| BJ / BJ's Wholesale Club Holdings, Inc. | 0,02 | −18,91 | 1,68 | −23,38 | 0,6923 | −0,2655 | |||
| WY / Weyerhaeuser Company | 0,07 | 25,03 | 1,68 | 9,72 | 0,6839 | 0,0156 | |||
| HCKT / The Hackett Group, Inc. | 0,07 | −18,25 | 1,68 | −28,88 | 0,6838 | −0,3469 | |||
| MOH / Molina Healthcare, Inc. | 0,01 | 5,65 | 1,68 | −4,45 | 0,6811 | −0,0829 | |||
| STBA / S&T Bancorp, Inc. | 0,04 | −0,80 | 1,66 | 1,28 | 0,6745 | −0,0395 | |||
| WGO / Winnebago Industries, Inc. | 0,06 | 264,75 | 1,64 | 206,93 | 0,6665 | 0,4337 | |||
| VIAV / Viavi Solutions Inc. | 0,16 | 7,09 | 1,63 | −3,60 | 0,6638 | −0,0745 | |||
| HAS / Hasbro, Inc. | 0,02 | 5,66 | 1,62 | 26,88 | 0,6676 | 0,1096 | |||
| HLIT / Harmonic Inc. | 0,17 | 17,89 | 1,62 | 16,39 | 0,6584 | 0,0522 | |||
| EMN / Eastman Chemical Company | 0,02 | 1,61 | 0,6614 | 0,6614 | |||||
| ZBH / Zimmer Biomet Holdings, Inc. | 0,02 | 5,66 | 1,60 | −14,83 | 0,6585 | −0,1614 | |||
| OMC / Omnicom Group Inc. | 0,02 | 22,84 | 1,58 | 6,55 | 0,6413 | −0,0036 | |||
| WCC / WESCO International, Inc. | 0,01 | 1,56 | 0,6403 | 0,6403 | |||||
| PHM / PulteGroup, Inc. | 0,01 | 21,87 | 1,55 | 25,06 | 0,6310 | 0,0900 | |||
| CAC / Camden National Corporation | 0,04 | −18,04 | 1,55 | −17,85 | 0,6307 | −0,1919 | |||
| HUN / Huntsman Corporation | 0,15 | 296,73 | 1,55 | 161,93 | 0,6295 | 0,3718 | |||
| BKR / Baker Hughes Company | 0,04 | 5,66 | 1,53 | −7,87 | 0,6308 | −0,0948 | |||
| MBUU / Malibu Boats, Inc. | 0,05 | 82,57 | 1,52 | 86,58 | 0,6160 | 0,2620 | |||
| GPN / Global Payments Inc. | 0,02 | 5,66 | 1,43 | −13,65 | 0,5815 | −0,1402 | |||
| CPB / The Campbell's Company | 0,05 | 27,23 | 1,42 | −2,33 | 0,5856 | −0,0499 | |||
| TGNA / TEGNA Inc. | 0,08 | −6,47 | 1,35 | −13,99 | 0,5502 | −0,1353 | |||
| HCSG / Healthcare Services Group, Inc. | 0,09 | 36,92 | 1,35 | 104,24 | 0,5549 | 0,2667 | |||
| KWR / Quaker Chemical Corporation | 0,01 | 1,33 | 0,5476 | 0,5476 | |||||
| SLGN / Silgan Holdings Inc. | 0,02 | −59,80 | 1,30 | −57,42 | 0,5275 | −0,7997 | |||
| SKX / Skechers U.S.A., Inc. | 0,02 | 5,65 | 1,29 | 17,49 | 0,5302 | 0,0515 | |||
| MTX / Minerals Technologies Inc. | 0,02 | −9,76 | 1,20 | −21,88 | 0,4894 | −0,1816 | |||
| OEC / Orion S.A. | 0,11 | 149,78 | 1,20 | 102,71 | 0,4872 | 0,2295 | |||
| FHI / Federated Hermes, Inc. | 0,03 | 5,43 | 1,17 | 14,55 | 0,4824 | 0,0362 | |||
| BRC / Brady Corporation | 0,02 | 31,82 | 1,17 | 26,84 | 0,4766 | 0,0738 | |||
| CNMD / CONMED Corporation | 0,02 | −23,36 | 1,17 | −33,92 | 0,4807 | −0,2903 | |||
| CMCO / Columbus McKinnon Corporation | 0,07 | −13,84 | 1,13 | −22,29 | 0,4629 | −0,1686 | |||
| DHIL / Diamond Hill Investment Group, Inc. | 0,01 | −25,47 | 1,12 | −24,16 | 0,4570 | −0,1891 | |||
| SAFT / Safety Insurance Group, Inc. | 0,01 | −36,26 | 1,05 | −35,86 | 0,4271 | −0,2865 | |||
| EIG / Employers Holdings, Inc. | 0,02 | −54,18 | 1,02 | −57,33 | 0,4165 | −0,6293 | |||
| LEG / Leggett & Platt, Incorporated | 0,10 | −7,93 | 0,94 | 3,89 | 0,3802 | −0,0123 | |||
| JBSS / John B. Sanfilippo & Son, Inc. | 0,01 | −49,45 | 0,86 | −54,90 | 0,3480 | −0,4789 | |||
| MKSI / MKS Inc. | 0,01 | 0,70 | 0,2883 | 0,2883 | |||||
| CUZ / Cousins Properties Incorporated | 0,02 | −43,40 | 0,67 | −42,39 | 0,2754 | −0,2314 | |||
| FULT / Fulton Financial Corporation | 0,04 | −47,92 | 0,66 | −48,12 | 0,2695 | −0,2867 | |||
| SPB / Spectrum Brands Holdings, Inc. | 0,01 | −47,48 | 0,40 | −61,08 | 0,1635 | −0,2869 | |||
| SFNC / Simmons First National Corporation | 0,02 | −73,44 | 0,37 | −75,52 | 0,1491 | −0,5024 | |||
| FC / Franklin Covey Co. | 0,01 | −55,10 | 0,30 | −62,90 | 0,1228 | −0,2321 | |||
| NWE / NorthWestern Energy Group, Inc. | 0,00 | −100,00 | 0,00 | 0,0000 | |||||
| AVA / Avista Corporation | 0,00 | −100,00 | 0,00 | 0,0000 | |||||
| PDCO / Patterson Companies, Inc. | 0,00 | −100,00 | 0,00 | 0,0000 | |||||
| GTY / Getty Realty Corp. | 0,00 | −100,00 | 0,00 | 0,0000 | |||||
| ETR / Entergy Corporation | 0,00 | −100,00 | 0,00 | 0,0000 | |||||
| YUMC / Yum China Holdings, Inc. | 0,00 | −100,00 | 0,00 | 0,0000 | |||||
| POR / Portland General Electric Company | 0,00 | −100,00 | 0,00 | 0,0000 | |||||
| NWN / Northwest Natural Holding Company | 0,00 | −100,00 | 0,00 | 0,0000 | |||||
| AWR / American States Water Company | 0,00 | −100,00 | 0,00 | 0,0000 | |||||
| SPTN / SpartanNash Company | 0,00 | −100,00 | 0,00 | 0,0000 | |||||
| CASY / Casey's General Stores, Inc. | 0,00 | −100,00 | 0,00 | 0,0000 | |||||
| OGS / ONE Gas, Inc. | 0,00 | −100,00 | 0,00 | 0,0000 | |||||
| SAM / The Boston Beer Company, Inc. | 0,00 | −100,00 | 0,00 | 0,0000 | |||||
| ATSG / Air Transport Services Group, Inc. | 0,00 | −100,00 | 0,00 | 0,0000 | |||||
| SR / Spire Inc. | 0,00 | −100,00 | 0,00 | 0,0000 | |||||
| FDP / Fresh Del Monte Produce Inc. | 0,00 | −100,00 | 0,00 | 0,0000 |