Grundläggande statistik
| Institutionella ägare | 150 total, 150 long only, 0 short only, 0 long/short - change of 5,63% MRQ |
| Genomsnittlig portföljallokering | 0.1666 % - change of 40,50% MRQ |
| Institutionella aktier (lång) | 17 482 605 (ex 13D/G) - change of 4,04MM shares 30,03% MRQ |
| Institutionellt värde (lång) | $ 454 798 USD ($1000) |
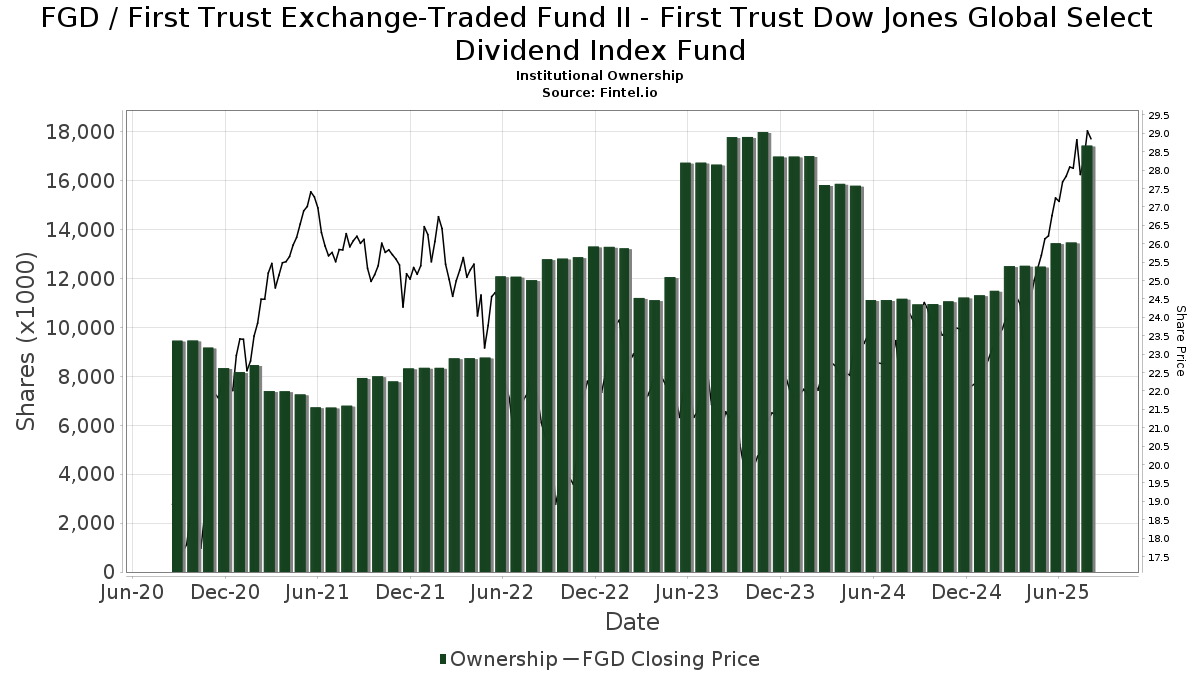
Institutionellt ägande och aktieägare
First Trust Exchange-Traded Fund II - First Trust Dow Jones Global Select Dividend Index Fund (US:FGD) har 150 Institutionella ägare och aktieägare som har lämnat in 13D/G- eller 13F-formulär till Securities Exchange Commission (SEC). Dessa institut innehar totalt 17,482,605 aktier. Största aktieägare inkluderar LPL Financial LLC, Wells Fargo & Company/mn, Ameriprise Financial Inc, Raymond James Financial Inc, FUKOKU MUTUAL LIFE INSURANCE Co, Morgan Stanley, AE Wealth Management LLC, UBS Group AG, Bank Of America Corp /de/, and Park National Corp /oh/ .
First Trust Exchange-Traded Fund II - First Trust Dow Jones Global Select Dividend Index Fund (ARCA:FGD) Institutionell ägarstruktur visar institutioners och fonders nuvarande positioner i företaget, samt de senaste förändringarna i positionernas storlek. Större aktieägare kan vara enskilda investerare, fonder, hedgefonder eller institutioner. Bilaga 13D visar att investeraren äger (eller ägde) mer än 5% av företaget och avser (eller avsåg) att aktivt eftersträva en förändring av affärsstrategin. Schedule 13G indikerar en passiv investering på över 5%.
The share price as of September 11, 2025 is 29,62 / share. Previously, on September 12, 2024, the share price was 23,74 / share. This represents an increase of 24,77% over that period.
Fondsentimentets poäng
Fondsentimentet poängen(fka Ägarackumulation-poäng) visar vilka aktier som är mest köpta av fonder. Det är resultatet av en sofistikerad kvantitativ flerfaktormodell som identifierar företag med de högsta nivåerna av institutionell ackumulering. Poängsättningsmodellen använder en kombination av den totala ökningen av redovisade ägare, förändringarna i portföljallokeringarna för dessa ägare och andra mått. Siffran sträcker sig från 0 till 100, där högre siffror indikerar en högre nivå av ackumulering i förhållande till sina konkurrenter, och 50 är genomsnittet.
Uppdateringsfrekvens: Dagligen
Se Ownership Explorer, som innehåller en lista över de högst rankade företagen.
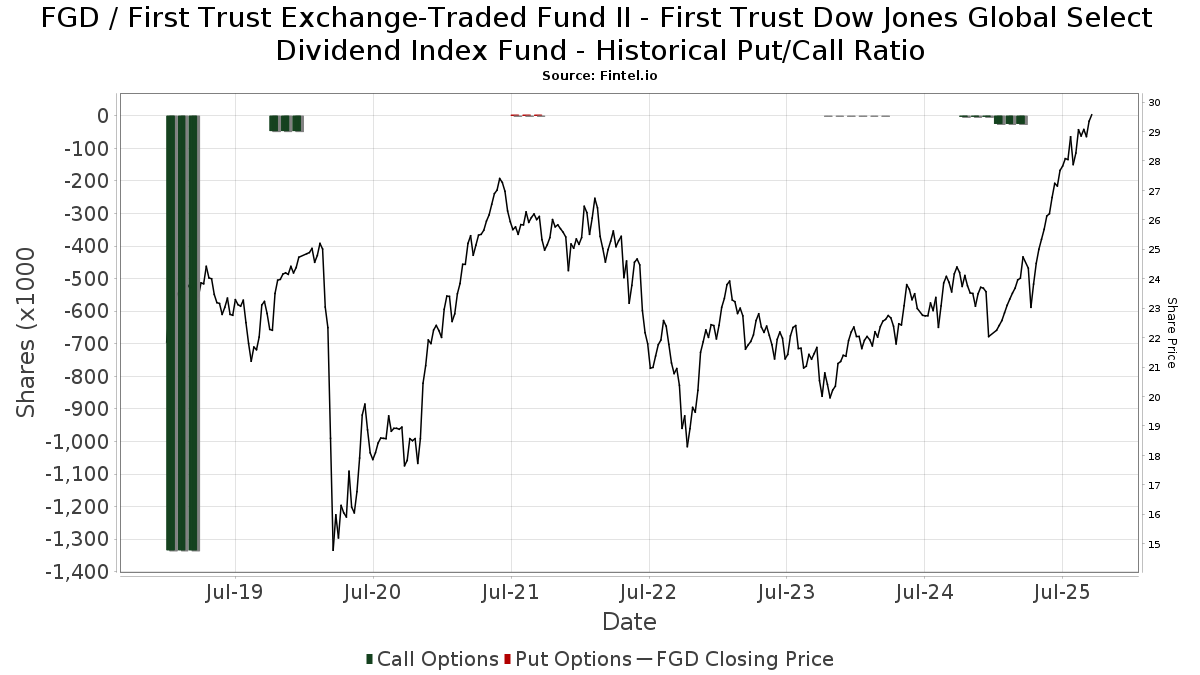
Institutionell sälj/köp-kvot
Förutom att rapportera vanliga eget kapital- och skuldemissioner måste institutioner med mer än 100MM tillgångar under förvaltning också avslöja sina innehav av sälj- och köpoptioner. Eftersom säljoptioner i allmänhet indikerar ett negativt sentiment och köpoptioner indikerar ett positivt sentiment, kan vi få en uppfattning om det övergripande institutionella sentimentet genom att plotta förhållandet mellan säljoptioner och köpoptioner. Diagrammet till höger visar det historiska förhållandet mellan sälj- och köpoptioner för detta instrument.
Genom att använda sälj/köp-kvoten som en indikator på aktieägarnas sentiment undviker man en av de största bristerna med att använda det totala institutionella ägandet, nämligen att en betydande del av de förvaltade tillgångarna investeras passivt för att följa index. Passivt förvaltade fonder köper vanligtvis inte optioner, så indikatorn för sälj/köp-kvoten ger en bättre bild av stämningen i aktivt förvaltade fonder.
13F- och NPORT-arkiveringar
Detaljer om 13F-arkiveringar är gratis. Detaljer om NP-arkiveringar kräver ett premiummedlemskap. Gröna rader indikerar nya positioner. Röda rader indikerar stängda positioner. Klicka på länk symbolen för att se hela transaktionshistoriken.
Uppgradera
för att låsa upp premiumdata och exportera till Excel ![]() .
.
| Fil Datum | Källa | Investerare | Typ | Genomsnittligt pris (beräknat) |
Aktier | Δ Aktier (%) |
Rapporterat värde (1000 USD) |
Δ Värde (%) |
Portföljallokering (%) |
|
|---|---|---|---|---|---|---|---|---|---|---|
| 2025-07-18 | 13F | Lynx Investment Advisory | 150 205 | −8,51 | 4 137 | 4,10 | ||||
| 2025-08-13 | 13F | Transce3nd, LLC | 4 089 | −7,38 | 113 | 5,66 | ||||
| 2025-08-12 | 13F | Park Square Financial Group, LLC | 10 372 | −7,47 | 286 | 5,17 | ||||
| 2025-07-01 | 13F | Park National Corp /oh/ | 468 517 | 8,92 | 12 903 | 23,95 | ||||
| 2025-08-14 | 13F | Sei Investments Co | 31 167 | 858 | ||||||
| 2025-07-21 | 13F | Barrett & Company, Inc. | 0 | −100,00 | 0 | |||||
| 2025-07-30 | 13F | Mid-American Wealth Advisory Group, Inc. | 389 | 11 | ||||||
| 2025-08-08 | 13F | Creative Planning | 14 345 | −49,05 | 395 | −42,00 | ||||
| 2025-07-14 | 13F | AdvisorNet Financial, Inc | 264 | 68,15 | 7 | 133,33 | ||||
| 2025-08-11 | 13F | Aptus Capital Advisors, LLC | 616 | 0,00 | 17 | 14,29 | ||||
| 2025-08-12 | 13F | Wealthbridge Capital Management, Llc | 55 409 | 1,97 | 1 526 | 15,97 | ||||
| 2025-08-08 | 13F | Avantax Advisory Services, Inc. | 0 | −100,00 | 0 | |||||
| 2025-08-14 | 13F/A | Rockefeller Capital Management L.P. | 13 991 | 29,93 | 385 | 48,08 | ||||
| 2025-07-21 | 13F | Crews Bank & Trust | 1 670 | 0,00 | 46 | 12,50 | ||||
| 2025-08-14 | 13F | Royal Bank Of Canada | 236 625 | 13,01 | 6 517 | 28,62 | ||||
| 2025-08-14 | 13F | Harvest Investment Services, LLC | 86 175 | −0,30 | 2 373 | 13,49 | ||||
| 2025-08-13 | 13F | EverSource Wealth Advisors, LLC | 100 | 0,00 | 3 | 0,00 | ||||
| 2025-08-14 | 13F | Federation des caisses Desjardins du Quebec | 2 260 | 0,00 | 62 | 14,81 | ||||
| 2025-07-08 | 13F | Nbc Securities, Inc. | 13 350 | −0,98 | 0 | |||||
| 2025-08-14 | 13F | Wiley Bros.-aintree Capital, Llc | 28 710 | 791 | ||||||
| 2025-05-01 | 13F | Quest 10 Wealth Builders, Inc. | 23 293 | 1,41 | 564 | 10,39 | ||||
| 2025-07-29 | 13F | Creekside Partners | 114 542 | 0,79 | 3 154 | 14,69 | ||||
| 2025-08-13 | 13F | Jones Financial Companies Lllp | 84 008 | 84,50 | 2 301 | 108,24 | ||||
| 2025-08-14 | 13F | Bank Of America Corp /de/ | 473 246 | 13,54 | 13 033 | 29,22 | ||||
| 2025-08-08 | 13F | Advisors Capital Management, LLC | 18 741 | 0,00 | 516 | 13,91 | ||||
| 2025-08-12 | 13F | LPL Financial LLC | 2 554 546 | 35,38 | 70 352 | 54,07 | ||||
| 2025-07-24 | 13F | IFP Advisors, Inc | 8 383 | 0,00 | 231 | 13,86 | ||||
| 2025-08-06 | 13F | Commonwealth Equity Services, Llc | 360 909 | 209,36 | 10 | 350,00 | ||||
| 2025-08-07 | 13F | 1620 Investment Advisors, Inc. | 200 | 0,00 | 6 | 25,00 | ||||
| 2025-05-15 | 13F | Hrt Financial Lp | 0 | −100,00 | 0 | |||||
| 2025-07-25 | 13F | Cwm, Llc | 1 081 | 0,00 | 0 | |||||
| 2025-07-23 | 13F | RiverTree Advisors, LLC | 54 358 | 1 497 | ||||||
| 2025-08-06 | 13F | AE Wealth Management LLC | 858 509 | −6,87 | 23 643 | 5,98 | ||||
| 2025-08-11 | 13F | Citigroup Inc | 700 | 0,00 | 19 | 18,75 | ||||
| 2025-08-08 | 13F/A | Sterling Capital Management LLC | 49 | −15,52 | 1 | 0,00 | ||||
| 2025-08-06 | 13F | Golden State Wealth Management, LLC | 103 | −7,21 | 3 | 0,00 | ||||
| 2025-08-11 | 13F | Wealthspire Advisors, LLC | 7 470 | 206 | ||||||
| 2025-08-08 | 13F | Pnc Financial Services Group, Inc. | 160 740 | −11,54 | 4 427 | 0,66 | ||||
| 2025-08-15 | 13F | Morgan Stanley | 1 059 317 | 4,32 | 29 174 | 18,72 | ||||
| 2025-08-11 | 13F | Principal Securities, Inc. | 2 686 | −8,33 | 74 | 12,31 | ||||
| 2025-08-14 | 13F | GWM Advisors LLC | 8 010 | 1 007,88 | 221 | 1 194,12 | ||||
| 2025-08-14 | 13F | Guardian Wealth Advisors, Llc / Nc | 616 | 0,00 | 17 | 14,29 | ||||
| 2025-05-06 | 13F | Rsm Us Wealth Management Llc | 0 | −100,00 | 0 | |||||
| 2025-07-16 | 13F | ORG Partners LLC | 9 481 | 0,00 | 263 | 14,35 | ||||
| 2025-07-09 | 13F | Triumph Capital Management | 26 245 | −0,38 | 723 | 13,34 | ||||
| 2025-07-17 | 13F | Global Trust Asset Management, LLC | 2 980 | 0,00 | 82 | 13,89 | ||||
| 2025-08-11 | 13F | Rothschild Investment Llc | 1 491 | 0,00 | 41 | 13,89 | ||||
| 2025-08-12 | 13F | Jpmorgan Chase & Co | 0 | −100,00 | 0 | |||||
| 2025-08-12 | 13F | CIBC Private Wealth Group, LLC | 17 394 | 479 | ||||||
| 2025-08-13 | 13F | Rockport Wealth LLC | 17 764 | −17,96 | 489 | −6,68 | ||||
| 2025-08-13 | 13F | Cerity Partners LLC | 9 973 | −4,58 | 275 | 8,73 | ||||
| 2025-08-14 | 13F | Financial Advisory Service, Inc. | 270 | 0,00 | 7 | 16,67 | ||||
| 2025-08-13 | 13F | Northwestern Mutual Wealth Management Co | 81 470 | −9,20 | 2 244 | 3,32 | ||||
| 2025-08-04 | 13F | Assetmark, Inc | 4 | 0,00 | 0 | |||||
| 2025-08-06 | 13F | DDFG, Inc | 23 773 | −1,23 | 655 | 12,37 | ||||
| 2025-07-16 | 13F | Novem Group | 7 500 | 207 | ||||||
| 2025-08-14 | 13F | Susquehanna International Group, Llp | 22 646 | −29,20 | 624 | −19,51 | ||||
| 2025-07-14 | 13F | Matrix Trust Co | 13 830 | 0,66 | 0 | |||||
| 2025-08-13 | 13F | StoneX Group Inc. | 0 | −100,00 | 0 | −100,00 | ||||
| 2025-08-14 | 13F | Comerica Bank | 19 475 | −0,18 | 536 | 13,56 | ||||
| 2025-08-12 | 13F | Archer Investment Corp | 7 711 | 0,00 | 212 | 13,98 | ||||
| 2025-08-14 | 13F | Raymond James Financial Inc | 1 163 034 | 428,34 | 32 030 | 501,26 | ||||
| 2025-07-18 | 13F | Truist Financial Corp | 28 155 | −6,88 | 775 | 6,02 | ||||
| 2025-08-14 | 13F | Mission Creek Capital Partners, Inc. | 59 467 | 0,90 | 1 638 | 14,80 | ||||
| 2025-08-01 | 13F | Envestnet Asset Management Inc | 209 197 | −4,88 | 5 761 | 8,25 | ||||
| 2025-08-06 | 13F | Moors & Cabot, Inc. | 27 411 | 755 | ||||||
| 2025-08-12 | 13F | Gladstone Institutional Advisory LLC | 21 541 | 67,20 | 593 | 90,68 | ||||
| 2025-08-11 | 13F | Slagle Financial, LLC | 9 161 | −10,98 | 252 | 1,20 | ||||
| 2025-07-17 | 13F | Janney Montgomery Scott LLC | 447 827 | 133,82 | 12 | 200,00 | ||||
| 2025-08-13 | 13F | Virtue Capital Management, LLC | 0 | −100,00 | 0 | |||||
| 2025-08-14 | 13F | Wells Fargo & Company/mn | 1 835 188 | −4,31 | 50 541 | 8,90 | ||||
| 2025-08-11 | 13F | Pineridge Advisors LLC | 1 270 | −6,69 | 35 | 6,25 | ||||
| 2025-07-17 | 13F | Vermillion Wealth Management, Inc. | 443 | 0,00 | 12 | 20,00 | ||||
| 2025-07-28 | 13F | Harbour Investments, Inc. | 11 820 | 0,03 | 326 | 14,04 | ||||
| 2025-05-15 | 13F | Talon Private Wealth, LLC | 0 | −100,00 | 0 | −100,00 | ||||
| 2025-07-22 | 13F | Simplicity Wealth,LLC | 26 476 | 60,65 | 729 | 83,17 | ||||
| 2025-07-23 | 13F | Tcfg Wealth Management, Llc | 42 392 | −0,96 | 1 167 | 12,75 | ||||
| 2025-07-25 | 13F | Envestnet Portfolio Solutions, Inc. | 0 | −100,00 | 0 | |||||
| 2025-07-15 | 13F | FLP Wealth Management, LLC | 8 294 | 2,89 | 201 | 11,73 | ||||
| 2025-07-18 | 13F | B.O.S.S. Retirement Advisors, LLC | 93 417 | −13,04 | 2 573 | −1,04 | ||||
| 2025-07-11 | 13F | Farther Finance Advisors, LLC | 17 001 | 6,34 | 468 | 20,62 | ||||
| 2025-07-14 | 13F | U.S. Capital Wealth Advisors, LLC | 9 119 | 0,00 | 251 | 14,09 | ||||
| 2025-08-12 | 13F | FUKOKU MUTUAL LIFE INSURANCE Co | 1 063 000 | 68,20 | 29 275 | 91,41 | ||||
| 2025-08-14 | 13F | Jane Street Group, Llc | 351 755 | 3 856,30 | 9 687 | 4 405,58 | ||||
| 2025-07-25 | 13F | Atria Wealth Solutions, Inc. | 7 709 | 214 | ||||||
| 2025-08-07 | 13F | Kestra Private Wealth Services, Llc | 14 402 | 37,78 | 397 | 57,14 | ||||
| 2025-07-23 | 13F | Trueblood Wealth Management, LLC | 82 346 | 11,31 | 2 268 | 26,65 | ||||
| 2025-08-08 | 13F | Capital Investment Advisory Services, LLC | 22 645 | −7,17 | 624 | 5,59 | ||||
| 2025-07-21 | 13F | Ameritas Advisory Services, LLC | 588 | 16 | ||||||
| 2025-08-08 | 13F | Foundations Investment Advisors, LLC | 12 572 | 1,82 | 346 | 16,11 | ||||
| 2025-07-11 | 13F | Pinnacle Bancorp, Inc. | 2 100 | 0,00 | 58 | 14,00 | ||||
| 2025-07-29 | 13F | Private Trust Co Na | 15 525 | 0,00 | 428 | 13,87 | ||||
| 2025-09-04 | 13F/A | Advisor Group Holdings, Inc. | 93 136 | 7,05 | 2 565 | 21,81 | ||||
| 2025-07-30 | 13F | LifeWealth Investments, LLC | 27 700 | 11,25 | 763 | 26,58 | ||||
| 2025-07-31 | 13F | Brinker Capital Investments, LLC | 0 | −100,00 | 0 | −100,00 | ||||
| 2025-07-30 | 13F | BlueChip Wealth Advisors LLC | 13 634 | 0,00 | 375 | 13,98 | ||||
| 2025-08-14 | 13F | Fmr Llc | 2 543 | 8,77 | 70 | 25,00 | ||||
| 2025-07-29 | 13F | Stephens Inc /ar/ | 10 765 | 0,00 | 296 | 13,85 | ||||
| 2025-07-16 | 13F | PFS Partners, LLC | 130 | 0,00 | 4 | 0,00 | ||||
| 2025-07-16 | 13F | Owen LaRue, LLC | 101 700 | 2 801 | ||||||
| 2025-07-28 | 13F | ForthRight Wealth Management, LLC | 176 385 | 20,62 | 4 858 | 37,28 | ||||
| 2025-08-13 | 13F | Luminist Capital LLC | 297 | 0,00 | 8 | 14,29 | ||||
| 2025-08-14 | 13F | Mariner, LLC | 13 378 | −4,21 | 368 | 9,20 | ||||
| 2025-08-13 | 13F | Baird Financial Group, Inc. | 91 706 | −8,87 | 2 526 | 3,70 | ||||
| 2025-08-05 | 13F | Intellectus Partners, LLC | 29 210 | 2,75 | 804 | 17,03 | ||||
| 2025-08-05 | 13F | Sigma Planning Corp | 48 947 | −1,84 | 1 348 | 11,69 | ||||
| 2025-08-12 | 13F | MAI Capital Management | 371 | 0,00 | 10 | 25,00 | ||||
| 2025-05-12 | 13F | Sandy Spring Bank | 3 735 | 0,46 | 90 | 9,76 | ||||
| 2025-08-11 | 13F | HighTower Advisors, LLC | 23 062 | −10,32 | 635 | 2,09 | ||||
| 2025-08-14 | 13F | Main Street Financial Solutions, LLC | 12 237 | 1,20 | 337 | 15,07 | ||||
| 2025-08-06 | 13F | Stonebridge Financial Planning Group, LLC | 56 983 | 1 569 | ||||||
| 2025-08-12 | 13F | Ameritas Investment Partners, Inc. | 1 910 | −4,98 | 53 | 8,33 | ||||
| 2025-05-13 | 13F | PFG Private Wealth Management, LLC | 0 | −100,00 | 0 | |||||
| 2025-08-05 | 13F | Claro Advisors LLC | 7 383 | 203 | ||||||
| 2025-08-08 | 13F | SBI Securities Co., Ltd. | 1 420 | 26,67 | 39 | 44,44 | ||||
| 2025-08-14 | 13F | Integrated Wealth Concepts LLC | 69 470 | 10,95 | 1 913 | 26,27 | ||||
| 2025-07-31 | 13F | Oppenheimer & Co Inc | 12 030 | 0,00 | 331 | 13,75 | ||||
| 2025-08-14 | 13F | Benjamin Edwards Inc | 21 149 | 10,05 | 582 | 25,16 | ||||
| 2025-08-14 | 13F | Warren Averett Asset Management, LLC | 29 542 | 6,70 | 814 | 21,52 | ||||
| 2025-08-14 | 13F | Transamerica Financial Advisors, Inc. | 23 | −4,17 | 1 | |||||
| 2025-08-14 | 13F | Old Mission Capital Llc | 0 | −100,00 | 0 | |||||
| 2025-08-11 | 13F | Private Advisor Group, LLC | 9 056 | −13,64 | 249 | −1,58 | ||||
| 2025-08-14 | 13F | Ameriprise Financial Inc | 1 807 702 | 48,86 | 49 794 | 69,44 | ||||
| 2025-08-12 | 13F | J.w. Cole Advisors, Inc. | 9 771 | 14,83 | 269 | 31,22 | ||||
| 2025-08-13 | 13F | SMART Wealth LLC | 123 117 | 12,83 | 3 391 | 28,41 | ||||
| 2025-08-12 | 13F | Steward Partners Investment Advisory, Llc | 113 590 | −6,72 | 3 128 | 6,18 | ||||
| 2025-08-14 | 13F | Citadel Advisors Llc | 0 | −100,00 | 0 | |||||
| 2025-07-30 | 13F | IMG Wealth Management, Inc. | 139 946 | 16 660,00 | 3 854 | 19 170,00 | ||||
| 2025-08-12 | 13F | Global Retirement Partners, LLC | 1 458 | 14,89 | 40 | 42,86 | ||||
| 2025-07-16 | 13F | Twelve Points Wealth Management LLC | 110 814 | 2,43 | 3 052 | 16,54 | ||||
| 2025-08-14 | 13F | UBS Group AG | 705 721 | 14,28 | 19 436 | 30,05 | ||||
| 2025-07-29 | 13F | Cottonwood Capital Advisors, Llc | 34 455 | −1,06 | 949 | 12,59 | ||||
| 2025-07-30 | 13F | D.a. Davidson & Co. | 54 107 | 58,32 | 1 490 | 80,17 | ||||
| 2025-07-31 | 13F | Cambridge Investment Research Advisors, Inc. | 92 782 | 13,51 | 3 | 100,00 | ||||
| 2025-04-17 | 13F | Authentikos Wealth Advisory, LLC | 0 | −100,00 | 0 | |||||
| 2025-08-14 | 13F | Snowden Capital Advisors LLC | 9 102 | 0,00 | 251 | 13,64 | ||||
| 2025-07-21 | 13F | TFG Advisers LLC | 8 694 | 1,52 | 239 | 15,46 | ||||
| 2025-08-04 | 13F | L.m. Kohn & Company | 44 086 | −2,42 | 1 214 | 11,07 | ||||
| 2025-08-15 | 13F | Equitable Holdings, Inc. | 67 147 | 6,33 | 1 849 | 21,01 | ||||
| 2025-08-14 | 13F | Mml Investors Services, Llc | 12 879 | 0 | ||||||
| 2025-07-25 | 13F | Concurrent Investment Advisors, LLC | 35 735 | 17,33 | 984 | 33,51 | ||||
| 2025-08-11 | 13F | Tidemark, LLC | 645 | −7,19 | 18 | 6,25 | ||||
| 2025-07-10 | 13F | Wealth Enhancement Advisory Services, Llc | 18 395 | −5,69 | 512 | 8,70 | ||||
| 2025-08-05 | 13F | Holistic Financial Partners | 9 577 | 0,00 | 264 | 13,85 | ||||
| 2025-04-15 | 13F | Collier Financial | 24 221 | 586 | ||||||
| 2025-08-08 | 13F | Gts Securities Llc | 17 725 | 488 | ||||||
| 2025-08-13 | 13F | Proactive Wealth Strategies LLC | 10 951 | 0,04 | 0 | |||||
| 2025-08-08 | 13F | Cetera Investment Advisers | 95 789 | 43,00 | 2 638 | 62,74 | ||||
| 2025-07-30 | 13F | Whittier Trust Co Of Nevada Inc | 2 000 | 0,00 | 55 | 14,58 | ||||
| 2025-08-18 | 13F | Geneos Wealth Management Inc. | 350 | 0,00 | 10 | 12,50 | ||||
| 2025-08-05 | 13F | Bank Of Montreal /can/ | 200 | 0,00 | 6 | 25,00 | ||||
| 2025-08-14 | 13F | Stifel Financial Corp | 106 152 | 48,15 | 2 923 | 68,57 | ||||
| 2025-08-18 | 13F/A | National Bank Of Canada /fi/ | 208 | 0,00 | 6 | 0,00 | ||||
| 2025-08-06 | 13F | New Millennium Group LLC | 70 | 0,00 | 2 | 0,00 | ||||
| 2025-08-12 | 13F | Proequities, Inc. | 0 | 0 | ||||||
| 2025-08-13 | 13F | Flow Traders U.s. Llc | 0 | −100,00 | 0 | |||||
| 2025-08-12 | 13F | Howe & Rusling Inc | 11 236 | 2,95 | 309 | 17,05 | ||||
| 2025-08-12 | 13F | Financial Advocates Investment Management | 10 950 | 302 | ||||||
| 2025-07-29 | 13F | Stratos Wealth Partners, LTD. | 15 986 | 8,56 | 440 | 23,60 | ||||
| 2025-07-15 | 13F | Elevated Capital Advisors, LLC | 52 634 | 0,00 | 1 274 | 0,00 | ||||
| 2025-08-15 | 13F | Kestra Advisory Services, LLC | 54 178 | 0,08 | 1 492 | 13,98 | ||||
| 2025-08-06 | 13F | Atlantic Union Bankshares Corp | 3 802 | 105 | ||||||
| 2025-08-14 | 13F | Citadel Advisors Llc | Call | 0 | −100,00 | 0 | ||||
| 2025-07-15 | 13F | Retirement Guys Formula Llc | 11 778 | −4,65 | 324 | 8,72 | ||||
| 2025-08-05 | 13F | GPS Wealth Strategies Group, LLC | 16 282 | 0,06 | 448 | 13,99 | ||||
| 2025-05-14 | 13F | Triad Wealth Partners, LLC | 0 | −100,00 | 0 | |||||
| 2025-07-17 | 13F | Worth Financial Advisory Group, LLC | 11 071 | 0,00 | 305 | 13,86 | ||||
| 2025-08-11 | 13F | Western Wealth Management, LLC | 23 774 | 40,87 | 655 | 60,29 | ||||
| 2025-05-16 | 13F | Coppell Advisory Solutions LLC | 0 | −100,00 | 0 |
Other Listings
| MX:FGD |