ASMB - Assembly Biosciences, Inc. Aktier - Aktiekurs, institutionellt ägande, aktieägare (NasdaqGS)

Assembly Biosciences, Inc.

Grundläggande statistik
Institutionella ägare 63 total, 63 long only, 0 short only, 0 long/short - change of 1,61% MRQ
Genomsnittlig portföljallokering 0.1192 % - change of 77,53% MRQ
Utestående aktier shares (source: Capital IQ)
Institutionella aktier (lång) 3 194 020 - 20,53% (ex 13D/G) - change of −0,03MM shares −0,81% MRQ
Institutionellt värde (lång) $ 57 070 USD ($1000)
Institutionellt ägande och aktieägare

Assembly Biosciences, Inc. (US:ASMB) har 63 Institutionella ägare och aktieägare som har lämnat in 13D/G- eller 13F-formulär till Securities Exchange Commission (SEC). Dessa institut innehar totalt 3,194,020 aktier. Största aktieägare inkluderar Gilead Sciences Inc, Vanguard Group Inc, B Group, Inc., VTSMX - Vanguard Total Stock Market Index Fund Investor Shares, Renaissance Technologies Llc, VEXMX - Vanguard Extended Market Index Fund Investor Shares, BlackRock, Inc., Geode Capital Management, Llc, Monimus Capital Management, Lp, and Citadel Advisors Llc .

Assembly Biosciences, Inc. (NasdaqGS:ASMB) Institutionell ägarstruktur visar institutioners och fonders nuvarande positioner i företaget, samt de senaste förändringarna i positionernas storlek. Större aktieägare kan vara enskilda investerare, fonder, hedgefonder eller institutioner. Bilaga 13D visar att investeraren äger (eller ägde) mer än 5% av företaget och avser (eller avsåg) att aktivt eftersträva en förändring av affärsstrategin. Schedule 13G indikerar en passiv investering på över 5%.

The share price as of September 10, 2025 is 22,26 / share. Previously, on September 11, 2024, the share price was 17,38 / share. This represents an increase of 28,08% over that period.

ASMB / Assembly Biosciences, Inc. Institutional Ownership
Fondsentimentets poäng

Fondsentimentet poängen(fka Ägarackumulation-poäng) visar vilka aktier som är mest köpta av fonder. Det är resultatet av en sofistikerad kvantitativ flerfaktormodell som identifierar företag med de högsta nivåerna av institutionell ackumulering. Poängsättningsmodellen använder en kombination av den totala ökningen av redovisade ägare, förändringarna i portföljallokeringarna för dessa ägare och andra mått. Siffran sträcker sig från 0 till 100, där högre siffror indikerar en högre nivå av ackumulering i förhållande till sina konkurrenter, och 50 är genomsnittet.

Uppdateringsfrekvens: Dagligen

Se Ownership Explorer, som innehåller en lista över de högst rankade företagen.

Institutionell sälj/köp-kvot

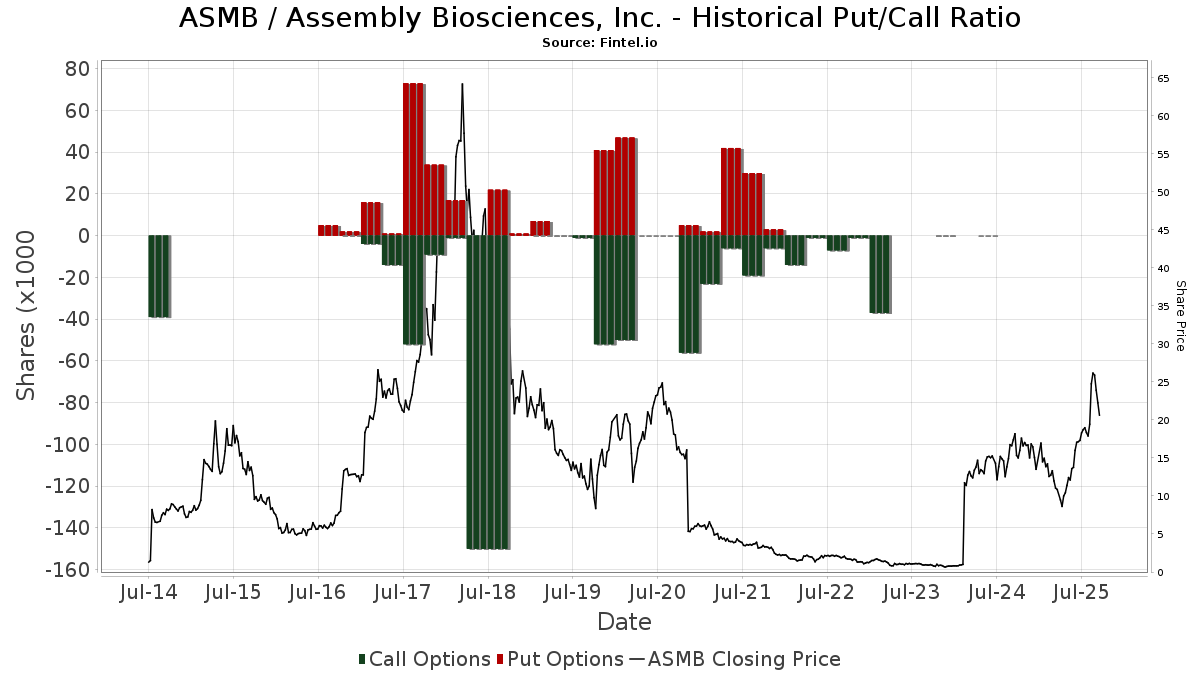
Förutom att rapportera vanliga eget kapital- och skuldemissioner måste institutioner med mer än 100MM tillgångar under förvaltning också avslöja sina innehav av sälj- och köpoptioner. Eftersom säljoptioner i allmänhet indikerar ett negativt sentiment och köpoptioner indikerar ett positivt sentiment, kan vi få en uppfattning om det övergripande institutionella sentimentet genom att plotta förhållandet mellan säljoptioner och köpoptioner. Diagrammet till höger visar det historiska förhållandet mellan sälj- och köpoptioner för detta instrument.

Genom att använda sälj/köp-kvoten som en indikator på aktieägarnas sentiment undviker man en av de största bristerna med att använda det totala institutionella ägandet, nämligen att en betydande del av de förvaltade tillgångarna investeras passivt för att följa index. Passivt förvaltade fonder köper vanligtvis inte optioner, så indikatorn för sälj/köp-kvoten ger en bättre bild av stämningen i aktivt förvaltade fonder.

ASMB / Assembly Biosciences, Inc. Historical Put/Call Ratio
13D/G-Arkiveringar

Vi presenterar 13D/G-arkiveringar separat från 13F-arkiveringar på grund av att de behandlas olika av SEC. 13D/G-arkiveringar kan lämnas in av grupper av investerare (med en ledare), medan 13F-arkiveringar inte kan det. Detta leder till situationer där en investerare kan lämna in en 13D/G-ansökan med ett värde för de totala aktierna (vilket motsvarar alla aktier som ägs av investerargruppen), men sedan lämna in en 13F-ansökan med ett annat värde för de totala aktierna (vilket motsvarar enbart deras eget ägande). Detta innebär att aktieägandet i 13D/G-arkiveringar och 13F-arkiveringar ofta inte är direkt jämförbara, så vi presenterar dem separat.

Notera: Från och med den 16 maj 2021 visar vi inte längre ägare som inte har lämnat in en 13D/G under det senaste året. Tidigare visade vi hela historiken för 13D/G-arkiveringar. I allmänhet måste enheter som är skyldiga att lämna in 13D/G-arkiveringar lämna in minst en gång per år innan de lämnar in en stängningsarkivering. Fonder avslutar dock ibland positioner utan att lämna in en avslutande arkivering (dvs. de avvecklar), så att visa hela historiken resulterade ibland i förvirring om det nuvarande ägandet. För att förhindra förvirring visar vi nu endast "nuvarande" ägare - det vill säga ägare som har lämnat in en ansökan under det senaste året.

Upgrade to unlock premium data.

Fil Datum Formulär Investerare Föregående
aktier
Senaste
aktier
Δ Aktier
(Procent)
Ägande
(Procent)
Δ Ägande
(Procent)
2025-08-18 13G/A Schornstein Alexander 728,113 543,523 -25.35 3.49 -25.43
2025-08-18 13G RA CAPITAL MANAGEMENT, L.P. 628,092 1,530,615 143.69 9.50 179.41
2025-08-15 13G COMMODORE CAPITAL LP 1,615,981 9.90
2025-08-15 13G Farallon Capital Partners, L.P. 1,140,510 7.30
2025-08-14 13G/A ARMISTICE CAPITAL, LLC 316,084 289,876 -8.29 9.99 100.20
13F- och NPORT-arkiveringar

Detaljer om 13F-arkiveringar är gratis. Detaljer om NP-arkiveringar kräver ett premiummedlemskap. Gröna rader indikerar nya positioner. Röda rader indikerar stängda positioner. Klicka på länk symbolen för att se hela transaktionshistoriken.

Uppgradera för att låsa upp premiumdata och exportera till Excel .

Fil Datum Källa Investerare Typ Genomsnittligt pris
(beräknat)
Aktier Δ Aktier
(%)
Rapporterat
värde
(1000 USD)
Δ Värde
(%)
Portföljallokering
(%)
2025-08-14 13F Bank Of America Corp /de/ 52 33,33 1
2025-08-14 13F Gilead Sciences Inc 2 209 471 0,00 40 036 89,54
2025-08-13 13F EverSource Wealth Advisors, LLC 55 0,00 1
2025-08-12 13F BlackRock, Inc. 89 672 13,53 1 625 115,10
2025-07-28 13F Frazier Financial Advisors, LLC 0 −100,00 0
2025-08-14 13F Raymond James Financial Inc 250 5
2025-07-21 13F Ameriflex Group, Inc. 83 0,00 1
2025-08-07 13F Connor, Clark & Lunn Investment Management Ltd. 0 −100,00 0
2025-05-27 NP FESM - Fidelity Enhanced Small Cap ETF 1 646 −87,86 16 −92,96
2025-08-13 13F Marshall Wace, Llp 0 −100,00 0
2025-08-14 13F Fmr Llc 0 −100,00 0
2025-08-11 13F Vanguard Group Inc 253 825 17,52 4 599 122,82
2025-04-30 13F Peapod Lane Capital LLC 0 −100,00 0
2025-03-26 NP DFEOX - U.s. Core Equity 1 Portfolio - Institutional Class This fund is a listed as child fund of Dimensional Fund Advisors Lp and if that institution has disclosed ownership in this security, then these positions will not be double counted when calculating total shares and total value 0 −100,00 0 −100,00
2025-06-26 NP DFSCX - U.s. Micro Cap Portfolio - Institutional Class This fund is a listed as child fund of Dimensional Fund Advisors Lp and if that institution has disclosed ownership in this security, then these positions will not be double counted when calculating total shares and total value 0 −100,00 0 −100,00
2025-08-14 13F UBS Group AG 2 933 282,40 53 657,14
2025-08-15 13F Monimus Capital Management, Lp 42 067 0,00 762 89,55
2025-08-12 13F American Century Companies Inc 0 −100,00 0
2025-07-24 NP FSKAX - Fidelity Total Market Index Fund This fund is a listed as child fund of Fmr Llc and if that institution has disclosed ownership in this security, then these positions will not be double counted when calculating total shares and total value 8 544 0,00 121 9,09
2025-08-27 NP VTSMX - Vanguard Total Stock Market Index Fund Investor Shares This fund is a listed as child fund of Vanguard Group Inc and if that institution has disclosed ownership in this security, then these positions will not be double counted when calculating total shares and total value 130 307 0,00 2 361 89,64
2025-08-27 NP VEXMX - Vanguard Extended Market Index Fund Investor Shares This fund is a listed as child fund of Vanguard Group Inc and if that institution has disclosed ownership in this security, then these positions will not be double counted when calculating total shares and total value 101 202 52,51 1 834 189,12
2025-05-29 NP JAFEX - Total Stock Market Index Trust NAV 122 67,12 1 0,00
2025-08-14 13F Wells Fargo & Company/mn 145 0,00 3 100,00
2025-07-22 13F Gsa Capital Partners Llp 14 840 0
2025-07-28 NP AVSC - Avantis U.S. Small Cap Equity ETF This fund is a listed as child fund of American Century Companies Inc and if that institution has disclosed ownership in this security, then these positions will not be double counted when calculating total shares and total value 736 0,00 10 11,11
2025-03-28 NP DFAC - Dimensional U.S. Core Equity 2 ETF 1 655 0,00 23 −14,81
2025-07-25 13F Avion Wealth 0 −100,00 0
2025-08-13 13F Renaissance Technologies Llc 107 521 −5,11 1 948 79,87
2025-08-14 13F B Group, Inc. 189 350 −5,33 3 431 79,45
2025-08-26 NP BRSIX - Ultra-Small Company Market Fund Class N 13 750 0,00 249 90,08
2025-08-14 13F State Street Corp 14 009 0,00 254 90,23
2025-08-27 NP JNL SERIES TRUST - JNL/DFA U.S. Small Cap Fund (A) 643 0,00 12 83,33
2025-08-14 13F Armistice Capital, Llc 0 −100,00 0 −100,00
2025-03-28 NP DCOR - Dimensional US Core Equity 1 ETF 666 0,00 9 −18,18
2025-07-24 NP FCFMX - Fidelity Series Total Market Index Fund This fund is a listed as child fund of Fmr Llc and if that institution has disclosed ownership in this security, then these positions will not be double counted when calculating total shares and total value 5 302 −3,05 75 7,14
2025-06-26 NP DFSTX - U.s. Small Cap Portfolio - Institutional Class This fund is a listed as child fund of Dimensional Fund Advisors Lp and if that institution has disclosed ownership in this security, then these positions will not be double counted when calculating total shares and total value 1 725 −39,54 20 −51,28
2025-05-15 13F GWM Advisors LLC 0 −100,00 0 −100,00
2025-08-12 13F Jpmorgan Chase & Co 7 0,00 0
2025-08-14 13F Bridgeway Capital Management Inc 15 225 0,00 276 89,66
2025-08-13 13F Federated Hermes, Inc. 25 394 0,00 460 90,08
2025-06-24 NP QASGX - Federated MDT Small Cap Growth Fund Class A Shares This fund is a listed as child fund of Federated Hermes, Inc. and if that institution has disclosed ownership in this security, then these positions will not be double counted when calculating total shares and total value 25 394 0,00 289 −18,59
2025-08-14 13F Lynx1 Capital Management LP 10 366 188
2025-04-09 13F Marquette Asset Management, LLC 0 −100,00 0
2025-08-14 13F Bnp Paribas Arbitrage, Sa 302 0,00 5 150,00
2025-07-15 13F Palumbo Wealth Management LLC 18 667 3,79 338 97,66
2025-08-15 13F Morgan Stanley 2 149 −6,57 39 80,95
2025-07-28 NP AVUV - Avantis U.S. Small Cap Value ETF This fund is a listed as child fund of American Century Companies Inc and if that institution has disclosed ownership in this security, then these positions will not be double counted when calculating total shares and total value 9 871 −10,77 140 −2,11
2025-08-14 13F Royal Bank Of Canada 53 1
2025-08-28 NP IWC - iShares Micro-Cap ETF This fund is a listed as child fund of BlackRock Inc. and if that institution has disclosed ownership in this security, then these positions will not be double counted when calculating total shares and total value 10 524 33,79 191 153,33
2025-05-27 NP VARIABLE INSURANCE PRODUCTS FUND II - Disciplined Small Cap Portfolio Initial Class 4 013 0,00 38 −39,68
2025-08-27 NP VSTCX - Vanguard Strategic Small-Cap Equity Fund Investor Shares This fund is a listed as child fund of Vanguard Group Inc and if that institution has disclosed ownership in this security, then these positions will not be double counted when calculating total shares and total value 17 723 0,00 321 89,94
2025-08-26 NP EQ ADVISORS TRUST - 1290 VT Micro Cap Portfolio Class IB 971 98,57 18 325,00
2025-08-14 13F Man Group plc 13 227 −26,32 240 39,77
2025-08-26 NP NORTHERN FUNDS - NORTHERN SMALL CAP CORE FUND Class K 5 781 −2,89 105 85,71
2025-07-24 NP FSMAX - Fidelity Extended Market Index Fund This fund is a listed as child fund of Fmr Llc and if that institution has disclosed ownership in this security, then these positions will not be double counted when calculating total shares and total value 22 854 0,13 323 10,24
2025-08-13 13F Northwestern Mutual Wealth Management Co 260 0,00 5 100,00
2025-08-07 13F Acadian Asset Management Llc 20 421 −11,32 0
2025-08-13 13F Northern Trust Corp 28 075 −0,88 509 88,15
2025-08-08 13F SBI Securities Co., Ltd. 67 0,00 1
2025-08-15 13F Tower Research Capital LLC (TRC) 250 −30,75 5 33,33
2025-08-12 13F Proequities, Inc. 0 0
2025-07-31 13F Caitong International Asset Management Co., Ltd 34 1
2025-08-14 13F Susquehanna International Group, Llp 0 −100,00 0
2025-06-24 NP SWTSX - Schwab Total Stock Market Index Fund This fund is a listed as child fund of Charles Schwab Investment Management Inc and if that institution has disclosed ownership in this security, then these positions will not be double counted when calculating total shares and total value 2 704 0,00 31 −18,92
2025-08-14 13F/A Barclays Plc 2 779 −19,00 0
2025-03-26 NP DFA INVESTMENT DIMENSIONS GROUP INC - U.S. Social Core Equity 2 Portfolio Shares This fund is a listed as child fund of Dimensional Fund Advisors Lp and if that institution has disclosed ownership in this security, then these positions will not be double counted when calculating total shares and total value 1 154 0,00 16 −15,79
2025-08-27 NP VITNX - Vanguard Institutional Total Stock Market Index Fund Institutional Shares This fund is a listed as child fund of Vanguard Group Inc and if that institution has disclosed ownership in this security, then these positions will not be double counted when calculating total shares and total value 2 996 54
2025-08-12 13F Rhumbline Advisers 190 0,00 3 200,00
2025-08-13 13F Advisor Group Holdings, Inc. 187 3
2025-07-24 NP FNCMX - Fidelity Nasdaq Composite Index Fund This fund is a listed as child fund of Fmr Llc and if that institution has disclosed ownership in this security, then these positions will not be double counted when calculating total shares and total value 3 123 0,00 44 10,00
2025-08-27 13F/A Squarepoint Ops LLC 0 −100,00 0 −100,00
2025-08-14 13F Citadel Advisors Llc 35 725 191,44 647 452,99
2025-08-08 13F Geode Capital Management, Llc 51 015 6,94 925 102,63
Other Listings
DE:V7B
Fintel data has been cited in the following publications:
Daily Mail Fox Business Business Insider Wall Street Journal The Washington Post Bloomberg Financial Times Globe and Mail
NASDAQ.com Reuters The Guardian Associated Press FactCheck.org Snopes Politifact
Federal Register The Intercept Forbes Fortune Magazine TheStreet Time Magazine Canadian Broadcasting Corporation International Business Times
Cambridge University Press Investopedia MarketWatch NY Daily News Entrepreneur Newsweek Barron's El Economista