J9I1 - 5E Advanced Materials, Inc. Aktier - Aktiekurs, institutionellt ägande, aktieägare (DB)

5E Advanced Materials, Inc.
DE ˙ DB
Grundläggande statistik
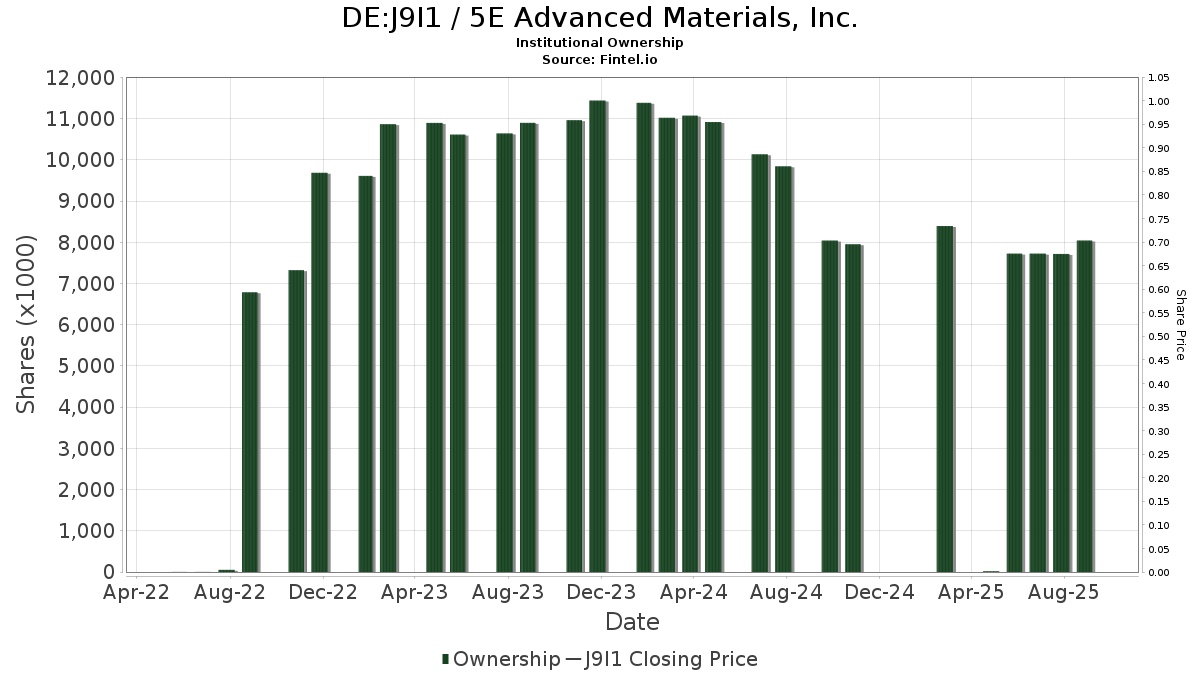
Institutionella ägare 28 total, 28 long only, 0 short only, 0 long/short - change of 3,70% MRQ
Genomsnittlig portföljallokering 0.2504 % - change of 1,55% MRQ
Utestående aktier shares (source: Capital IQ)
Institutionella aktier (lång) 8 044 475 - 35,85% (ex 13D/G) - change of 0,32MM shares 4,11% MRQ
Institutionellt värde (lång) $ 28 964 USD ($1000)
Institutionellt ägande och aktieägare

5E Advanced Materials, Inc. (DE:J9I1) har 28 Institutionella ägare och aktieägare som har lämnat in 13D/G- eller 13F-formulär till Securities Exchange Commission (SEC). Dessa institut innehar totalt 8,044,475 aktier. Största aktieägare inkluderar Bluescape Energy Partners LLC, Marex Group plc, Vanguard Group Inc, Wells Fargo & Company/mn, VTSMX - Vanguard Total Stock Market Index Fund Investor Shares, LeClair Wealth Partners LLC, Andina Capital Management, LLC, VEXMX - Vanguard Extended Market Index Fund Investor Shares, BlackRock, Inc., and Geode Capital Management, Llc .

5E Advanced Materials, Inc. (DB:J9I1) Institutionell ägarstruktur visar institutioners och fonders nuvarande positioner i företaget, samt de senaste förändringarna i positionernas storlek. Större aktieägare kan vara enskilda investerare, fonder, hedgefonder eller institutioner. Bilaga 13D visar att investeraren äger (eller ägde) mer än 5% av företaget och avser (eller avsåg) att aktivt eftersträva en förändring av affärsstrategin. Schedule 13G indikerar en passiv investering på över 5%.

DE:J9I1 / 5E Advanced Materials, Inc. Institutional Ownership
Fondsentimentets poäng

Fondsentimentet poängen(fka Ägarackumulation-poäng) visar vilka aktier som är mest köpta av fonder. Det är resultatet av en sofistikerad kvantitativ flerfaktormodell som identifierar företag med de högsta nivåerna av institutionell ackumulering. Poängsättningsmodellen använder en kombination av den totala ökningen av redovisade ägare, förändringarna i portföljallokeringarna för dessa ägare och andra mått. Siffran sträcker sig från 0 till 100, där högre siffror indikerar en högre nivå av ackumulering i förhållande till sina konkurrenter, och 50 är genomsnittet.

Uppdateringsfrekvens: Dagligen

Se Ownership Explorer, som innehåller en lista över de högst rankade företagen.

13F- och NPORT-arkiveringar

Detaljer om 13F-arkiveringar är gratis. Detaljer om NP-arkiveringar kräver ett premiummedlemskap. Gröna rader indikerar nya positioner. Röda rader indikerar stängda positioner. Klicka på länk symbolen för att se hela transaktionshistoriken.

Uppgradera för att låsa upp premiumdata och exportera till Excel .

Fil Datum Källa Investerare Typ Genomsnittligt pris
(beräknat)
Aktier Δ Aktier
(%)
Rapporterat
värde
(1000 USD)
Δ Värde
(%)
Portföljallokering
(%)
2025-08-19 13F Marex Group plc 188 917 665
2025-08-14 13F UBS Group AG 776 12 833,33 3
2025-08-29 NP GGMMX - Gabelli Global Mini Mites Fund CLASS I 0 −100,00 0
2025-08-28 NP JAFEX - Total Stock Market Index Trust NAV 0 −100,00 0
2025-08-26 NP EQ ADVISORS TRUST - 1290 VT Micro Cap Portfolio Class IB 365 0,00 1 0,00
2025-07-24 NP FNCMX - Fidelity Nasdaq Composite Index Fund This fund is a listed as child fund of Fmr Llc and if that institution has disclosed ownership in this security, then these positions will not be double counted when calculating total shares and total value 765 −54,65 3 −57,14
2025-08-14 13F Wells Fargo & Company/mn 90 869 1 328,31 320 1 229,17
2025-08-14 13F Bank Of America Corp /de/ 43 26,47 0
2025-08-26 NP BRSIX - Ultra-Small Company Market Fund Class N 2 634 0,00 9 −10,00
2025-08-14 13F Royal Bank Of Canada 0 −100,00 0
2025-08-28 NP IWC - iShares Micro-Cap ETF This fund is a listed as child fund of BlackRock Inc. and if that institution has disclosed ownership in this security, then these positions will not be double counted when calculating total shares and total value 5 736 45,95 20 33,33
2025-09-04 13F/A Advisor Group Holdings, Inc. 61 0,00 0
2025-07-24 NP FSMAX - Fidelity Extended Market Index Fund This fund is a listed as child fund of Fmr Llc and if that institution has disclosed ownership in this security, then these positions will not be double counted when calculating total shares and total value 12 581 11,01 55 5,77
2025-08-27 NP VEXMX - Vanguard Extended Market Index Fund Investor Shares This fund is a listed as child fund of Vanguard Group Inc and if that institution has disclosed ownership in this security, then these positions will not be double counted when calculating total shares and total value 26 706 0,00 94 −7,84
2025-08-12 13F BlackRock, Inc. 22 351 6,05 79 −2,50
2025-08-14 13F Bnp Paribas Arbitrage, Sa 198 0,00 1
2025-08-15 13F Tower Research Capital LLC (TRC) 1 387 −21,06 5 −33,33
2025-08-15 13F Morgan Stanley 2 168 0,00 8 −12,50
2025-08-13 13F Sassicaia Capital Advisers Llc 4 653 660
2025-08-11 13F Vanguard Group Inc 92 310 0,00 325 −8,22
2025-08-06 13F LeClair Wealth Partners LLC 37 208 131
2025-08-08 13F SBI Securities Co., Ltd. 91 0,00 0
2025-08-14 13F Millennium Management Llc 16 254 −28,66 57 −34,48
2025-08-08 13F Geode Capital Management, Llc 20 704 0,54 73 −7,69
2025-08-14 13F Macquarie Group Ltd 12 830 −28,34 45 −33,82
2025-08-12 13F Proequities, Inc. 0 0
2025-08-27 NP VTSMX - Vanguard Total Stock Market Index Fund Investor Shares This fund is a listed as child fund of Vanguard Group Inc and if that institution has disclosed ownership in this security, then these positions will not be double counted when calculating total shares and total value 65 150 0,00 229 −8,03
2025-07-24 NP FSKAX - Fidelity Total Market Index Fund This fund is a listed as child fund of Fmr Llc and if that institution has disclosed ownership in this security, then these positions will not be double counted when calculating total shares and total value 2 892 0,00 13 −7,69
2025-07-24 NP FCFMX - Fidelity Series Total Market Index Fund This fund is a listed as child fund of Fmr Llc and if that institution has disclosed ownership in this security, then these positions will not be double counted when calculating total shares and total value 3 122 12,59 14 8,33
2025-08-12 13F Jpmorgan Chase & Co 42 −6,67 0
2025-08-11 13F Bluescape Energy Partners LLC 7 497 349 0,00 26 391 −8,09
2025-07-21 13F Andina Capital Management, LLC 28 169 99
Other Listings
US:FEAM 4,14 US$
Fintel data has been cited in the following publications:
Daily Mail Fox Business Business Insider Wall Street Journal The Washington Post Bloomberg Financial Times Globe and Mail
NASDAQ.com Reuters The Guardian Associated Press FactCheck.org Snopes Politifact
Federal Register The Intercept Forbes Fortune Magazine TheStreet Time Magazine Canadian Broadcasting Corporation International Business Times
Cambridge University Press Investopedia MarketWatch NY Daily News Entrepreneur Newsweek Barron's El Economista