Grundläggande statistik
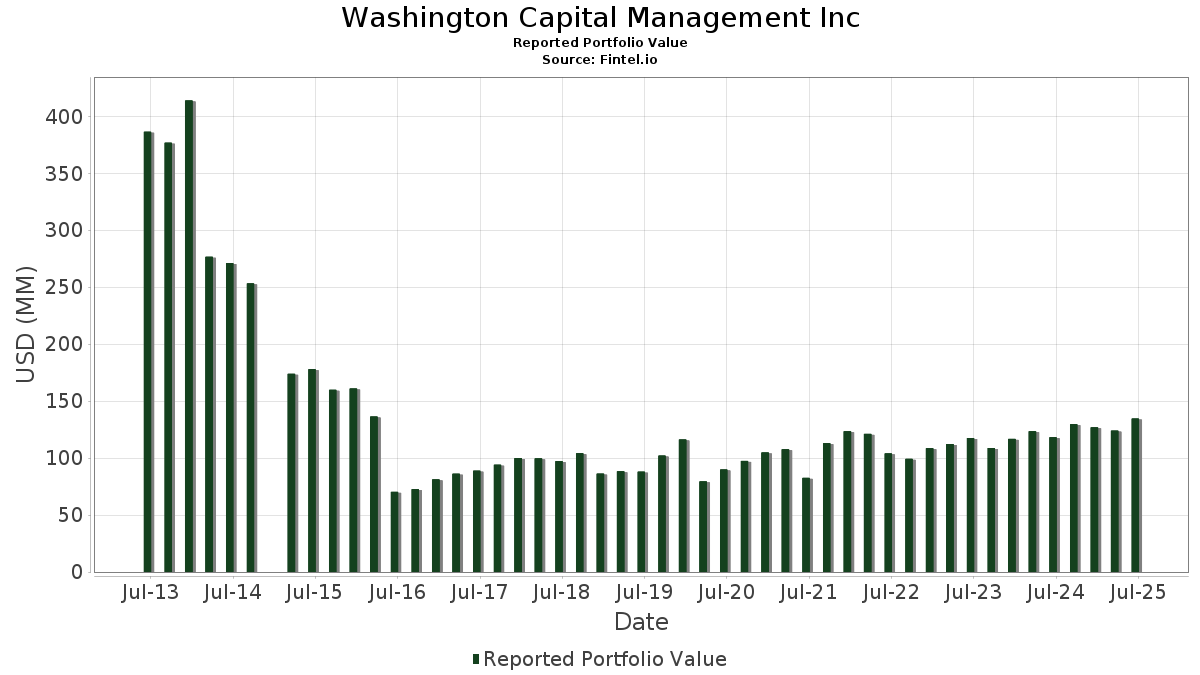
| Portföljvärde | $ 123 220 701 |
| Aktuella positioner | 111 |
Senaste innehav, resultat, förvaltat kapital (från 13F, 13D)
Washington Capital Management Inc har redovisat 111 totala innehav i sina senaste SEC-arkiveringar. Det senaste portföljvärdet beräknas vara $ 123 220 701 USD. Faktiskt förvaltade tillgångar (AUM) är detta värde plus likvida medel (som inte redovisas). Washington Capital Management Incs största innehav är Vanguard Index Funds - Vanguard Total Stock Market ETF (US:VTI) , State Street SPDR Dow Jones Industrial Average ETF Trust (US:DIA) , State Street SPDR S&P 500 ETF Trust (US:SPY) , Agnico Eagle Mines Limited (US:AEM) , and iShares Trust - iShares MSCI ACWI ex U.S. ETF (US:ACWX) . Washington Capital Management Incs nya positioner inkluderar Element Solutions Inc (US:ESI) , Accenture plc (US:ACN) , CAVA Group, Inc. (US:CAVA) , Adobe Inc. (US:ADBE) , and Teledyne Technologies Incorporated (US:TDY) .
Största ökningarna detta kvartal
Vi använder förändringen i portföljallokeringen eftersom det är det mest meningsfulla måttet. Förändringar kan bero på transaktioner eller förändringar i aktiekurser.
| Värdepapper | Aktier (MM) |
Värde (MM$) |
Portfölj % av | ΔPortfölj % av |
|---|---|---|---|---|
| VTI / Vanguard Index Funds - Vanguard Total Stock Market ETF | 0,09 | 29,10 | 23,6162 | 4,2805 |
| DIA / State Street SPDR Dow Jones Industrial Average ETF Trust | 0,02 | 10,33 | 8,3848 | 1,2716 |
| SPY / State Street SPDR S&P 500 ETF Trust | 0,01 | 9,32 | 7,5657 | 1,0680 |
| ESI / Element Solutions Inc | 0,02 | 0,61 | 0,4969 | 0,4969 |
| SFM / Sprouts Farmers Market, Inc. | 0,01 | 0,55 | 0,4461 | 0,4461 |
| MNDY / monday.com Ltd. | 0,00 | 0,55 | 0,4431 | 0,4431 |
| FTV / Fortive Corporation | 0,02 | 0,91 | 0,7411 | 0,4360 |
| KEX / Kirby Corporation | 0,01 | 1,19 | 0,9679 | 0,4127 |
| ACN / Accenture plc | 0,00 | 0,49 | 0,3996 | 0,3996 |
| GMED / Globus Medical, Inc. | 0,01 | 0,87 | 0,7086 | 0,3776 |
Största minskningarna detta kvartal
Vi använder förändringen i portföljallokeringen eftersom det är det mest meningsfulla måttet. Förändringar kan bero på transaktioner eller förändringar i aktiepriser.
| Värdepapper | Aktier (MM) |
Värde (MM$) |
Portfölj % av | ΔPortfölj % av |
|---|---|---|---|---|
| JPM / JPMorgan Chase & Co. | 0,00 | 1,14 | 0,9270 | −1,1085 |
| IWM / iShares Trust - iShares Russell 2000 ETF | 0,00 | 0,72 | 0,5813 | −0,6165 |
| BAH / Booz Allen Hamilton Holding Corporation | 0,00 | 0,00 | −0,4243 | |
| GOOG / Alphabet Inc. | 0,00 | 1,47 | 1,1969 | −0,3843 |
| VGSH / Vanguard Scottsdale Funds - Vanguard Short-Term Treasury ETF | 0,00 | 0,00 | −0,3359 | |
| CPNG / Coupang, Inc. | 0,00 | 0,00 | −0,3193 | |
| CNHI / CNH Industrial N.V. | 0,00 | 0,00 | −0,2856 | |
| PNC / The PNC Financial Services Group, Inc. | 0,01 | 1,15 | 0,9334 | −0,2751 |
| NSC / Norfolk Southern Corporation | 0,00 | 0,67 | 0,5448 | −0,2750 |
| HO1 / Hologic, Inc. | 0,01 | 0,68 | 0,5513 | −0,2624 |
13F- och fond arkiveringar
Denna blankett lämnades in den 2026-01-29 för rapporteringsperioden 2025-12-31. Klicka på länksymbolen för att se hela transaktionshistoriken.
Uppgradera för att låsa upp premiumdata och exportera till Excel![]() .
.
| Värdepapper | Typ | Genomsnittligt aktiepris | Aktier (MM) |
ΔAktier (%) |
Värde ($MM) |
ΔVärde (%) |
Portfölj (%) |
ΔPortfölj (%) |
|
|---|---|---|---|---|---|---|---|---|---|
| VTI / Vanguard Index Funds - Vanguard Total Stock Market ETF | 0,09 | 5,10 | 29,10 | 7,38 | 23,6162 | 4,2805 | |||
| DIA / State Street SPDR Dow Jones Industrial Average ETF Trust | 0,02 | 0,00 | 10,33 | 3,63 | 8,3848 | 1,2716 | |||
| SPY / State Street SPDR S&P 500 ETF Trust | 0,01 | 0,00 | 9,32 | 2,36 | 7,5657 | 1,0680 | |||
| AEM / Agnico Eagle Mines Limited | 0,01 | −22,94 | 2,31 | −22,51 | 1,8787 | −0,2523 | |||
| ACWX / iShares Trust - iShares MSCI ACWI ex U.S. ETF | 0,03 | −9,83 | 2,29 | −6,91 | 1,8599 | 0,1038 | |||
| KEY / KeyCorp | 0,08 | 8,13 | 1,73 | 19,41 | 1,4039 | 0,3703 | |||
| CIEN / Ciena Corporation | 0,01 | −50,62 | 1,58 | −20,71 | 1,2802 | −0,1395 | |||
| GOOG / Alphabet Inc. | 0,00 | −48,35 | 1,47 | −33,48 | 1,1969 | −0,3843 | |||
| CSCO / Cisco Systems, Inc. | 0,02 | −1,18 | 1,36 | 11,25 | 1,1002 | 0,2308 | |||
| EMR / Emerson Electric Co. | 0,01 | 0,00 | 1,35 | 1,20 | 1,0976 | 0,1439 | |||
| MCHP / Microchip Technology Incorporated | 0,02 | 10,84 | 1,35 | 10,02 | 1,0968 | 0,2201 | |||
| BAC / Bank of America Corporation | 0,02 | −0,15 | 1,26 | 6,44 | 1,0204 | 0,1777 | |||
| KEX / Kirby Corporation | 0,01 | 16,09 | 1,19 | 53,21 | 0,9679 | 0,4127 | |||
| LH / Labcorp Holdings Inc. | 0,00 | −0,32 | 1,18 | −12,90 | 0,9600 | −0,0088 | |||
| PNC / The PNC Financial Services Group, Inc. | 0,01 | −34,64 | 1,15 | −32,07 | 0,9334 | −0,2751 | |||
| JPM / JPMorgan Chase & Co. | 0,00 | −60,81 | 1,14 | −59,97 | 0,9270 | −1,1085 | |||
| HAL / Halliburton Company | 0,04 | −21,00 | 1,13 | −9,27 | 0,9135 | 0,0285 | |||
| VEU / Vanguard International Equity Index Funds - Vanguard FTSE All-World ex-US ETF | 0,01 | −25,55 | 1,07 | −23,28 | 0,8698 | −0,1267 | |||
| SLB / SLB N.V. | 0,03 | −32,93 | 1,02 | −25,17 | 0,8285 | −0,1440 | |||
| BDX / Becton, Dickinson and Company | 0,01 | 0,00 | 1,02 | 3,67 | 0,8261 | 0,1257 | |||
| APTV / Aptiv PLC | 0,01 | −8,64 | 1,01 | −19,41 | 0,8163 | −0,0738 | |||
| MOH / Molina Healthcare, Inc. | 0,01 | −0,17 | 1,01 | −9,46 | 0,8161 | 0,0236 | |||
| VOO / Vanguard Index Funds - Vanguard S&P 500 ETF | 0,00 | 1,56 | 0,98 | 4,03 | 0,7970 | 0,1233 | |||
| EA / Electronic Arts Inc. | 0,00 | −30,58 | 0,98 | −29,65 | 0,7955 | −0,1989 | |||
| FTS / Fortis Inc. | 0,02 | −0,40 | 0,97 | 1,99 | 0,7899 | 0,1088 | |||
| GEHC / GE HealthCare Technologies Inc. | 0,01 | 5,69 | 0,94 | 15,40 | 0,7668 | 0,1828 | |||
| FTV / Fortive Corporation | 0,02 | 89,46 | 0,91 | 113,82 | 0,7411 | 0,4360 | |||
| ITT / ITT Inc. | 0,01 | 0,00 | 0,90 | −2,92 | 0,7294 | 0,0688 | |||
| CAH / Cardinal Health, Inc. | 0,00 | 0,00 | 0,89 | 30,94 | 0,7255 | 0,2383 | |||
| MKSI / MKS Inc. | 0,01 | −14,06 | 0,88 | 10,86 | 0,7133 | 0,1481 | |||
| EXPE / Expedia Group, Inc. | 0,00 | 0,00 | 0,88 | 32,63 | 0,7128 | 0,2400 | |||
| GMED / Globus Medical, Inc. | 0,01 | 23,46 | 0,87 | 88,55 | 0,7086 | 0,3776 | |||
| SBAC / SBA Communications Corporation | 0,00 | −20,41 | 0,86 | −20,47 | 0,6946 | −0,0724 | |||
| DG / Dollar General Corporation | 0,01 | 0,00 | 0,85 | 28,44 | 0,6896 | 0,2177 | |||
| CFLT / Confluent, Inc. | 0,03 | 16,67 | 0,85 | 78,11 | 0,6872 | 0,3481 | |||
| JBHT / J.B. Hunt Transport Services, Inc. | 0,00 | 0,00 | 0,82 | 44,94 | 0,6624 | 0,2604 | |||
| MDB / MongoDB, Inc. | 0,00 | −28,85 | 0,78 | −3,72 | 0,6301 | 0,0544 | |||
| CTRA / Coterra Energy Inc. | 0,03 | 0,00 | 0,77 | 11,22 | 0,6280 | 0,1319 | |||
| SOLV / Solventum Corporation | 0,01 | 29,40 | 0,77 | 40,59 | 0,6241 | 0,2335 | |||
| VRT / Vertiv Holdings Co | 0,00 | 23,85 | 0,76 | 33,04 | 0,6180 | 0,2095 | |||
| MRK / Merck & Co., Inc. | 0,01 | −22,14 | 0,74 | −2,37 | 0,6008 | 0,0599 | |||
| TFC / Truist Financial Corporation | 0,01 | −12,94 | 0,73 | −6,31 | 0,5911 | 0,0365 | |||
| WH / Wyndham Hotels & Resorts, Inc. | 0,01 | 74,55 | 0,73 | 65,15 | 0,5887 | 0,2751 | |||
| IWM / iShares Trust - iShares Russell 2000 ETF | 0,00 | −58,06 | 0,72 | −57,33 | 0,5813 | −0,6165 | |||
| ASO / Academy Sports and Outdoors, Inc. | 0,01 | 0,00 | 0,70 | −0,14 | 0,5717 | 0,0685 | |||
| MMS / Maximus, Inc. | 0,01 | 0,00 | 0,69 | −5,48 | 0,5604 | 0,0389 | |||
| HO1 / Hologic, Inc. | 0,01 | −46,04 | 0,68 | −40,44 | 0,5513 | −0,2624 | |||
| WCC / WESCO International, Inc. | 0,00 | 6,38 | 0,68 | 23,13 | 0,5492 | 0,1568 | |||
| NSC / Norfolk Southern Corporation | 0,00 | −39,22 | 0,67 | −41,60 | 0,5448 | −0,2750 | |||
| BILL / BILL Holdings, Inc. | 0,01 | 0,00 | 0,67 | 2,92 | 0,5444 | 0,0796 | |||
| GOOGL / Alphabet Inc. | 0,00 | 0,00 | 0,67 | 28,82 | 0,5411 | 0,1716 | |||
| GTLB / GitLab Inc. | 0,02 | 31,11 | 0,66 | 9,21 | 0,5391 | 0,1049 | |||
| NXPI / NXP Semiconductors N.V. | 0,00 | 1,85 | 0,66 | −2,95 | 0,5346 | 0,0505 | |||
| TKR / The Timken Company | 0,01 | 0,00 | 0,66 | 11,95 | 0,5326 | 0,1142 | |||
| HUM / Humana Inc. | 0,00 | 0,00 | 0,65 | −1,52 | 0,5280 | 0,0565 | |||
| NDSN / Nordson Corporation | 0,00 | 0,00 | 0,65 | 6,05 | 0,5268 | 0,0896 | |||
| BLD / TopBuild Corp. | 0,00 | 0,00 | 0,63 | 6,66 | 0,5079 | 0,0896 | |||
| NBIX / Neurocrine Biosciences, Inc. | 0,00 | −15,38 | 0,62 | −14,40 | 0,5065 | −0,0144 | |||
| ESI / Element Solutions Inc | 0,02 | 0,61 | 0,4969 | 0,4969 | |||||
| FROG / JFrog Ltd. | 0,01 | −19,01 | 0,61 | 6,99 | 0,4968 | 0,0882 | |||
| LEVI / Levi Strauss & Co. | 0,03 | −13,95 | 0,60 | −23,44 | 0,4881 | −0,0721 | |||
| TEAM / Atlassian Corporation | 0,00 | 76,19 | 0,60 | 78,81 | 0,4869 | 0,2476 | |||
| MDT / Medtronic plc | 0,01 | −3,33 | 0,60 | −2,44 | 0,4865 | 0,0478 | |||
| MRVL / Marvell Technology, Inc. | 0,01 | −18,82 | 0,59 | −17,93 | 0,4759 | −0,0340 | |||
| XOM / Exxon Mobil Corporation | 0,00 | −5,81 | 0,58 | 0,52 | 0,4746 | 0,0596 | |||
| LHX / L3Harris Technologies, Inc. | 0,00 | −5,48 | 0,58 | −9,20 | 0,4729 | 0,0153 | |||
| DIOD / Diodes Incorporated | 0,01 | 0,00 | 0,57 | −7,29 | 0,4645 | 0,0241 | |||
| MUSA / Murphy USA Inc. | 0,00 | 0,00 | 0,56 | 3,87 | 0,4585 | 0,0707 | |||
| ZTS / Zoetis Inc. | 0,00 | 58,48 | 0,55 | 36,30 | 0,4483 | 0,1591 | |||
| EME / EMCOR Group, Inc. | 0,00 | 0,00 | 0,55 | −5,82 | 0,4468 | 0,0298 | |||
| SFM / Sprouts Farmers Market, Inc. | 0,01 | 0,55 | 0,4461 | 0,4461 | |||||
| PSTG / Everpure, Inc. | 0,01 | 32,26 | 0,55 | 5,78 | 0,4459 | 0,0752 | |||
| MNDY / monday.com Ltd. | 0,00 | 0,55 | 0,4431 | 0,4431 | |||||
| HUBS / HubSpot, Inc. | 0,00 | 35,00 | 0,54 | 15,85 | 0,4397 | 0,1059 | |||
| DUK / Duke Energy Corporation | 0,00 | 0,00 | 0,54 | −5,28 | 0,4371 | 0,0314 | |||
| HUBB / Hubbell Incorporated | 0,00 | 0,00 | 0,53 | 3,10 | 0,4325 | 0,0641 | |||
| CSX / CSX Corporation | 0,01 | 0,00 | 0,51 | 1,98 | 0,4177 | 0,0580 | |||
| ACN / Accenture plc | 0,00 | 0,49 | 0,3996 | 0,3996 | |||||
| CFR / Cullen/Frost Bankers, Inc. | 0,00 | 0,00 | 0,47 | −0,21 | 0,3802 | 0,0456 | |||
| RGEN / Repligen Corporation | 0,00 | 0,00 | 0,46 | 22,46 | 0,3723 | 0,1053 | |||
| DECK / Deckers Outdoor Corporation | 0,00 | 57,14 | 0,46 | 61,13 | 0,3702 | 0,1677 | |||
| UNH / UnitedHealth Group Incorporated | 0,00 | 3,92 | 0,44 | −0,68 | 0,3550 | 0,0409 | |||
| CXW / CoreCivic, Inc. | 0,02 | 43,04 | 0,43 | 34,27 | 0,3505 | 0,1211 | |||
| CAVA / CAVA Group, Inc. | 0,01 | 0,43 | 0,3477 | 0,3477 | |||||
| STE / STERIS plc | 0,00 | 0,00 | 0,41 | 2,53 | 0,3292 | 0,0467 | |||
| NVCR / NovoCure Limited | 0,03 | 0,00 | 0,40 | 0,00 | 0,3253 | 0,0395 | |||
| IT / Gartner, Inc. | 0,00 | 0,00 | 0,38 | −4,06 | 0,3071 | 0,0258 | |||
| AQNB / Algonquin Power & Utilities Corp. - Corporate Bond/Note | 0,06 | 0,37 | 0,2985 | 0,2985 | |||||
| ARW / Arrow Electronics, Inc. | 0,00 | 66,67 | 0,33 | 52,07 | 0,2683 | 0,1129 | |||
| DGX / Quest Diagnostics Incorporated | 0,00 | −1,39 | 0,31 | −10,20 | 0,2507 | 0,0052 | |||
| WFC / Wells Fargo & Company | 0,00 | 0,00 | 0,31 | 11,23 | 0,2496 | 0,0523 | |||
| ADBE / Adobe Inc. | 0,00 | 0,29 | 0,2372 | 0,2372 | |||||
| AMP / Ameriprise Financial, Inc. | 0,00 | 0,00 | 0,29 | 0,00 | 0,2332 | 0,0278 | |||
| MSCI / MSCI Inc. | 0,00 | 0,00 | 0,29 | 1,06 | 0,2328 | 0,0304 | |||
| LMT / Lockheed Martin Corporation | 0,00 | −56,68 | 0,26 | −58,12 | 0,2100 | −0,2299 | |||
| BMRN / BioMarin Pharmaceutical Inc. | 0,00 | 0,26 | 0,2074 | 0,2074 | |||||
| TDY / Teledyne Technologies Incorporated | 0,00 | 0,26 | 0,2072 | 0,2072 | |||||
| MBLY / Mobileye Global Inc. | 0,02 | 0,25 | 0,2033 | 0,2033 | |||||
| ESTC / Elastic N.V. | 0,00 | 0,24 | 0,1959 | 0,1959 | |||||
| RY / Royal Bank of Canada | 0,00 | 0,00 | 0,24 | 15,53 | 0,1937 | 0,0466 | |||
| CGNX / Cognex Corporation | 0,01 | −26,67 | 0,24 | −41,77 | 0,1927 | −0,0982 | |||
| IEX / IDEX Corporation | 0,00 | 0,23 | 0,1877 | 0,1877 | |||||
| CB / Chubb Limited | 0,00 | 0,00 | 0,23 | 10,73 | 0,1844 | 0,0378 | |||
| INSP / Inspire Medical Systems, Inc. | 0,00 | 0,22 | 0,1796 | 0,1796 | |||||
| ELV / Elevance Health, Inc. | 0,00 | 0,00 | 0,22 | 8,96 | 0,1778 | 0,0337 | |||
| PCTY / Paylocity Holding Corporation | 0,00 | −1,42 | 0,21 | −5,38 | 0,1714 | 0,0118 | |||
| CMCSA / Comcast Corporation | 0,01 | 0,21 | 0,1710 | 0,1710 | |||||
| VST / Vistra Corp. | 0,00 | 0,21 | 0,1702 | 0,1702 | |||||
| US91332UAB70 / CONVERTIBLE ZERO | 0,19 | 1,58 | 0,1566 | 0,0209 | |||||
| US20717MAB90 / CONVERTIBLE ZERO | 0,10 | 3,19 | 0,0788 | 0,0117 | |||||
| US29786AAN63 / CONV. NOTE | 0,09 | 1,14 | 0,0724 | 0,0095 | |||||
| TGT / Target Corporation | 0,00 | −100,00 | 0,00 | 0,0000 | |||||
| TTD / The Trade Desk, Inc. | 0,00 | −100,00 | 0,00 | −100,00 | −0,2378 | ||||
| BAH / Booz Allen Hamilton Holding Corporation | 0,00 | −100,00 | 0,00 | −100,00 | −0,4243 | ||||
| VOYA / Voya Financial, Inc. | 0,00 | −100,00 | 0,00 | 0,0000 | |||||
| VMI / Valmont Industries, Inc. | 0,00 | −100,00 | 0,00 | 0,0000 | |||||
| VGSH / Vanguard Scottsdale Funds - Vanguard Short-Term Treasury ETF | 0,00 | −100,00 | 0,00 | −100,00 | −0,3359 | ||||
| PHM / PulteGroup, Inc. | 0,00 | −100,00 | 0,00 | 0,0000 | |||||
| CNHI / CNH Industrial N.V. | 0,00 | −100,00 | 0,00 | −100,00 | −0,2856 | ||||
| COP / ConocoPhillips | 0,00 | −100,00 | 0,00 | 0,0000 | |||||
| BSV / Vanguard Bond Index Funds - Vanguard Short-Term Bond ETF | 0,00 | −100,00 | 0,00 | 0,0000 | |||||
| VCSH / Vanguard Scottsdale Funds - Vanguard Short-Term Corporate Bond ETF | 0,00 | −100,00 | 0,00 | 0,0000 | |||||
| VUSB / Vanguard Bond Index Funds - Vanguard Ultra-Short Bond ETF | 0,00 | −100,00 | 0,00 | 0,0000 | |||||
| VVV / Valvoline Inc. | 0,00 | −100,00 | 0,00 | 0,0000 | |||||
| C / Citigroup Inc. | 0,00 | −100,00 | 0,00 | 0,0000 | |||||
| VIOG / Vanguard Admiral Funds - Vanguard S&P Small-Cap 600 Growth ETF | 0,00 | −100,00 | 0,00 | 0,0000 | |||||
| ORCL / Oracle Corporation | 0,00 | −100,00 | 0,00 | 0,0000 | |||||
| FITB / Fifth Third Bancorp | 0,00 | −100,00 | 0,00 | 0,0000 | |||||
| FELE / Franklin Electric Co., Inc. | 0,00 | −100,00 | 0,00 | 0,0000 | |||||
| IGSB / iShares Trust - iShares 1-5 Year Investment Grade Corporate Bond ETF | 0,00 | −100,00 | 0,00 | 0,0000 | |||||
| CPNG / Coupang, Inc. | 0,00 | −100,00 | 0,00 | −100,00 | −0,3193 | ||||
| KR / The Kroger Co. | 0,00 | −100,00 | 0,00 | 0,0000 |