Grundläggande statistik
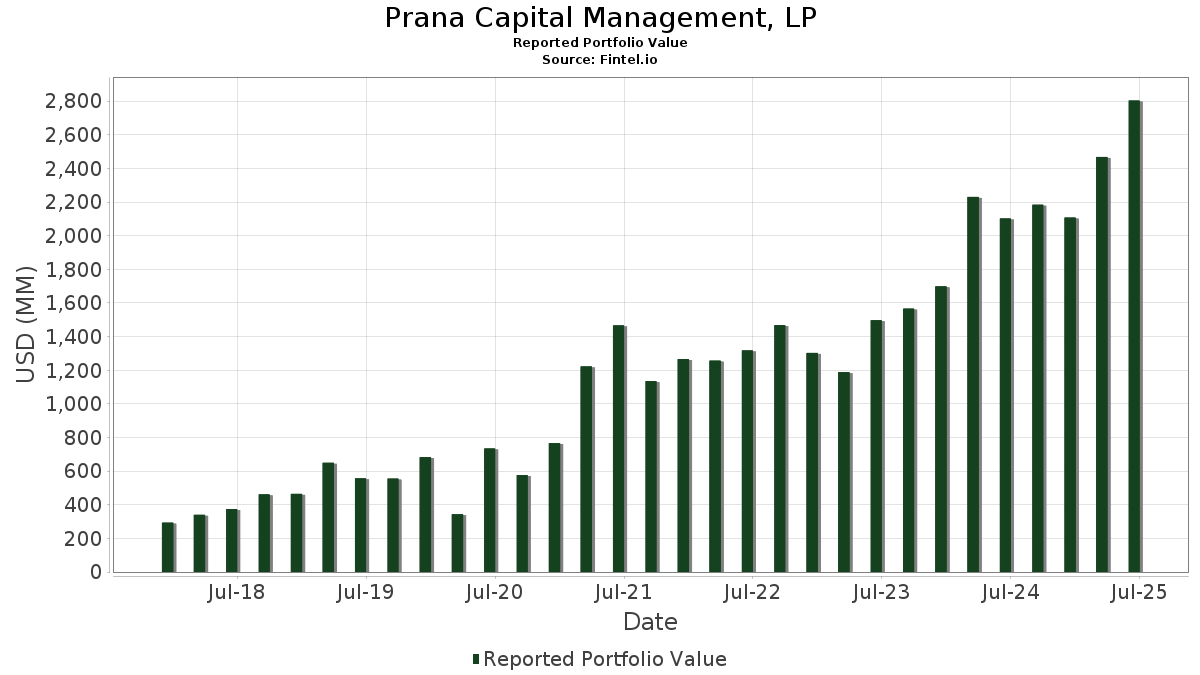
| Portföljvärde | $ 2 757 899 327 |
| Aktuella positioner | 115 |
Senaste innehav, resultat, förvaltat kapital (från 13F, 13D)
Prana Capital Management, LP har redovisat 115 totala innehav i sina senaste SEC-arkiveringar. Det senaste portföljvärdet beräknas vara $ 2 757 899 327 USD. Faktiskt förvaltade tillgångar (AUM) är detta värde plus likvida medel (som inte redovisas). Prana Capital Management, LPs största innehav är BlackRock, Inc. (US:BLK) , Bank of America Corporation (US:BAC) , Citigroup Inc. (US:C) , Truist Financial Corporation (US:TFC) , and Ameriprise Financial, Inc. (US:AMP) . Prana Capital Management, LPs nya positioner inkluderar Hamilton Lane Incorporated (US:HLNE) , Figure Technology Solutions, Inc. (US:FIGR) , BILL Holdings, Inc. (US:BILL) , eToro Group Ltd. (US:ETOR) , and Miami International Holdings, Inc. (US:MIAX) .
Största ökningarna detta kvartal
Vi använder förändringen i portföljallokeringen eftersom det är det mest meningsfulla måttet. Förändringar kan bero på transaktioner eller förändringar i aktiekurser.
| Värdepapper | Aktier (MM) |
Värde (MM$) |
Portfölj % av | ΔPortfölj % av |
|---|---|---|---|---|
| CME / CME Group Inc. | 0,32 | 87,75 | 3,1816 | 3,1816 |
| SCHW / The Charles Schwab Corporation | 0,95 | 95,03 | 3,4458 | 1,9772 |
| MA / Mastercard Incorporated | 0,17 | 94,61 | 3,4307 | 1,9344 |
| SPGI / S&P Global Inc. | 0,08 | 43,77 | 1,5871 | 1,5871 |
| C / Citigroup Inc. | 1,12 | 130,21 | 4,7215 | 1,5661 |
| HBAN / Huntington Bancshares Incorporated | 2,20 | 38,15 | 1,3834 | 1,3834 |
| RJF / Raymond James Financial, Inc. | 0,23 | 37,38 | 1,3553 | 1,3553 |
| BX / Blackstone Inc. | 0,24 | 36,41 | 1,3201 | 1,3201 |
| CI / The Cigna Group | 0,12 | 31,92 | 1,1574 | 1,1574 |
| AJG / Arthur J. Gallagher & Co. | 0,12 | 30,85 | 1,1186 | 1,1186 |
Största minskningarna detta kvartal
Vi använder förändringen i portföljallokeringen eftersom det är det mest meningsfulla måttet. Förändringar kan bero på transaktioner eller förändringar i aktiepriser.
| Värdepapper | Aktier (MM) |
Värde (MM$) |
Portfölj % av | ΔPortfölj % av |
|---|---|---|---|---|
| KKR / KKR & Co. Inc. | 0,08 | 10,24 | 0,3713 | −2,1618 |
| CB / Chubb Limited | 0,24 | 75,34 | 2,7318 | −2,0654 |
| AON / Aon plc | 0,16 | 55,10 | 1,9981 | −2,0489 |
| INTU / Intuit Inc. | 0,00 | 1,84 | 0,0667 | −1,5974 |
| BRO / Brown & Brown, Inc. | 0,60 | 47,53 | 1,7235 | −1,2172 |
| ICE / Intercontinental Exchange, Inc. | 0,34 | 54,57 | 1,9787 | −1,1914 |
| ALL / The Allstate Corporation | 0,20 | 41,77 | 1,5146 | −1,1286 |
| BJ / BJ's Wholesale Club Holdings, Inc. | 0,00 | 0,27 | 0,0097 | −0,9473 |
| RGA / Reinsurance Group of America, Incorporated | 0,14 | 27,78 | 1,0073 | −0,9147 |
| NDAQ / Nasdaq, Inc. | 0,82 | 79,25 | 2,8737 | −0,7745 |
13F- och fond arkiveringar
Denna blankett lämnades in den 2026-02-17 för rapporteringsperioden 2025-12-31. Klicka på länksymbolen för att se hela transaktionshistoriken.
Uppgradera för att låsa upp premiumdata och exportera till Excel![]() .
.
| Värdepapper | Typ | Genomsnittligt aktiepris | Aktier (MM) |
ΔAktier (%) |
Värde ($MM) |
ΔVärde (%) |
Portfölj (%) |
ΔPortfölj (%) |
|
|---|---|---|---|---|---|---|---|---|---|
| BLK / BlackRock, Inc. | 0,23 | 3,56 | 248,41 | −4,92 | 9,0073 | 0,3002 | |||
| BAC / Bank of America Corporation | 2,95 | −1,68 | 162,28 | 4,82 | 5,8840 | 0,7249 | |||
| C / Citigroup Inc. | 1,12 | 19,62 | 130,21 | 37,53 | 4,7215 | 1,5661 | |||
| TFC / Truist Financial Corporation | 2,50 | −5,60 | 123,01 | 1,60 | 4,4602 | 0,4255 | |||
| AMP / Ameriprise Financial, Inc. | 0,21 | 13,37 | 101,50 | 13,16 | 3,6802 | 0,6911 | |||
| USB / U.S. Bancorp | 1,83 | −27,35 | 97,66 | −19,79 | 3,5411 | −0,5164 | |||
| SCHW / The Charles Schwab Corporation | 0,95 | 106,06 | 95,03 | 115,65 | 3,4458 | 1,9772 | |||
| MA / Mastercard Incorporated | 0,17 | 109,96 | 94,61 | 110,73 | 3,4307 | 1,9344 | |||
| CME / CME Group Inc. | 0,32 | 87,75 | 3,1816 | 3,1816 | |||||
| NDAQ / Nasdaq, Inc. | 0,82 | −34,07 | 79,25 | −27,60 | 2,8737 | −0,7745 | |||
| CB / Chubb Limited | 0,24 | −52,67 | 75,34 | −47,66 | 2,7318 | −2,0654 | |||
| KEY / KeyCorp | 3,41 | −17,61 | 70,33 | −9,02 | 2,5501 | −0,0259 | |||
| LOW / Lowe's Companies, Inc. | 0,29 | 0,83 | 69,63 | −3,25 | 2,5249 | 0,1264 | |||
| AIG / American International Group, Inc. | 0,75 | 17,74 | 63,76 | 28,25 | 2,3119 | 0,6551 | |||
| CFG / Citizens Financial Group, Inc. | 0,96 | −26,49 | 56,32 | −19,23 | 2,0421 | −0,2816 | |||
| AON / Aon plc | 0,16 | −54,15 | 55,10 | −54,62 | 1,9981 | −2,0489 | |||
| ICE / Intercontinental Exchange, Inc. | 0,34 | −40,32 | 54,57 | −42,63 | 1,9787 | −1,1914 | |||
| SEIC / SEI Investments Company | 0,65 | −8,46 | 53,41 | −11,51 | 1,9366 | −0,0748 | |||
| BRO / Brown & Brown, Inc. | 0,60 | −36,61 | 47,53 | −46,13 | 1,7235 | −1,2172 | |||
| LEN / Lennar Corporation | 0,43 | 9,95 | 44,42 | −10,32 | 1,6108 | −0,0401 | |||
| SPGI / S&P Global Inc. | 0,08 | 43,77 | 1,5871 | 1,5871 | |||||
| ALL / The Allstate Corporation | 0,20 | −45,69 | 41,77 | −47,33 | 1,5146 | −1,1286 | |||
| HBAN / Huntington Bancshares Incorporated | 2,20 | 38,15 | 1,3834 | 1,3834 | |||||
| RJF / Raymond James Financial, Inc. | 0,23 | 37,38 | 1,3553 | 1,3553 | |||||
| BX / Blackstone Inc. | 0,24 | 36,41 | 1,3201 | 1,3201 | |||||
| SSNC / SS&C Technologies Holdings, Inc. | 0,39 | −12,63 | 34,37 | −13,95 | 1,2461 | −0,0848 | |||
| HD / The Home Depot, Inc. | 0,10 | 553,39 | 34,00 | 454,88 | 1,2329 | 1,0287 | |||
| CI / The Cigna Group | 0,12 | 31,92 | 1,1574 | 1,1574 | |||||
| AJG / Arthur J. Gallagher & Co. | 0,12 | 30,85 | 1,1186 | 1,1186 | |||||
| RGA / Reinsurance Group of America, Incorporated | 0,14 | −54,51 | 27,78 | −51,83 | 1,0073 | −0,9147 | |||
| SF / Stifel Financial Corp. | 0,20 | −39,68 | 25,32 | −33,43 | 0,9182 | −0,3495 | |||
| IBKR / Interactive Brokers Group, Inc. | 0,39 | 27,48 | 25,29 | 19,14 | 0,9172 | 0,2096 | |||
| FIS / Fidelity National Information Services, Inc. | 0,38 | −37,99 | 24,98 | −37,50 | 0,9058 | −0,4263 | |||
| GPN / Global Payments Inc. | 0,32 | −23,52 | 24,75 | −28,75 | 0,8974 | −0,2602 | |||
| TOL / Toll Brothers, Inc. | 0,16 | 5,98 | 22,29 | 3,74 | 0,8082 | 0,0922 | |||
| AFL / Aflac Incorporated | 0,20 | 177,09 | 21,78 | 173,57 | 0,7896 | 0,5243 | |||
| BEN / Franklin Resources, Inc. | 0,90 | 5,14 | 21,62 | 8,59 | 0,7839 | 0,1204 | |||
| CSGP / CoStar Group, Inc. | 0,32 | 90,32 | 21,31 | 51,68 | 0,7725 | 0,3044 | |||
| SPG / Simon Property Group, Inc. | 0,10 | −23,98 | 18,30 | −25,02 | 0,6635 | −0,1498 | |||
| ACN / Accenture plc | 0,07 | 4 857,74 | 18,13 | 5 295,83 | 0,6574 | 0,6462 | |||
| PRI / Primerica, Inc. | 0,07 | 2,83 | 17,78 | −4,30 | 0,6446 | 0,0256 | |||
| CPAY / Corpay, Inc. | 0,06 | −17,78 | 17,58 | −14,11 | 0,6374 | −0,0446 | |||
| WCN / Waste Connections, Inc. | 0,10 | 32,17 | 17,04 | 31,83 | 0,6178 | 0,1871 | |||
| INVH / Invitation Homes Inc. | 0,57 | −10,21 | 15,73 | −14,92 | 0,5704 | −0,0458 | |||
| EQH / Equitable Holdings, Inc. | 0,32 | 54,45 | 15,44 | 44,92 | 0,5598 | 0,2048 | |||
| CBOE / Cboe Global Markets, Inc. | 0,06 | 2 198,62 | 15,06 | 2 253,75 | 0,5462 | 0,5249 | |||
| VOYA / Voya Financial, Inc. | 0,20 | 497,01 | 14,59 | 494,54 | 0,5290 | 0,4473 | |||
| MSCI / MSCI Inc. | 0,03 | 14,50 | 0,5258 | 0,5258 | |||||
| GL / Globe Life Inc. | 0,10 | 14,07 | 0,5102 | 0,5102 | |||||
| EG / Everest Group, Ltd. | 0,04 | 118,72 | 13,68 | 111,92 | 0,4959 | 0,2809 | |||
| FISV / Fiserv, Inc. | 0,16 | 11,04 | 0,4003 | 0,4003 | |||||
| IVZ / Invesco Ltd. | 0,41 | −59,41 | 10,65 | −53,51 | 0,3862 | −0,3774 | |||
| KKR / KKR & Co. Inc. | 0,08 | −86,27 | 10,24 | −86,53 | 0,3713 | −2,1618 | |||
| JLL / Jones Lang LaSalle Incorporated | 0,03 | −41,53 | 9,93 | −34,04 | 0,3599 | −0,1416 | |||
| PLD / Prologis, Inc. | 0,08 | 9,81 | 0,3557 | 0,3557 | |||||
| RF / Regions Financial Corporation | 0,34 | 9,27 | 0,3361 | 0,3361 | |||||
| IT / Gartner, Inc. | 0,03 | 8,38 | 0,3040 | 0,3040 | |||||
| STEP / StepStone Group Inc. | 0,13 | 17,21 | 8,36 | 15,16 | 0,3030 | 0,0612 | |||
| RKT / Rocket Companies, Inc. | 0,41 | 45,20 | 8,01 | 45,05 | 0,2904 | 0,1064 | |||
| FICO / Fair Isaac Corporation | 0,00 | 7,86 | 0,2850 | 0,2850 | |||||
| EVR / Evercore Inc. | 0,02 | −1,64 | 7,50 | −0,78 | 0,2720 | 0,0200 | |||
| MKTX / MarketAxess Holdings Inc. | 0,04 | −34,82 | 7,24 | −32,20 | 0,2627 | −0,0934 | |||
| CBRE / CBRE Group, Inc. | 0,04 | 6,72 | 0,2435 | 0,2435 | |||||
| RNR / RenaissanceRe Holdings Ltd. | 0,02 | −20,35 | 6,71 | −11,81 | 0,2434 | −0,0103 | |||
| HLNE / Hamilton Lane Incorporated | 0,05 | 6,25 | 0,2266 | 0,2266 | |||||
| JEF / Jefferies Financial Group Inc. | 0,09 | 1,06 | 5,77 | −4,28 | 0,2094 | 0,0084 | |||
| CTAS / Cintas Corporation | 0,03 | −58,54 | 5,44 | −62,02 | 0,1971 | −0,2798 | |||
| CRM / Salesforce, Inc. | 0,02 | 288,30 | 4,62 | 333,99 | 0,1676 | 0,1321 | |||
| ELV / Elevance Health, Inc. | 0,01 | −75,38 | 4,46 | −73,30 | 0,1616 | −0,3944 | |||
| AMG / Affiliated Managers Group, Inc. | 0,01 | 4,29 | 0,1556 | 0,1556 | |||||
| HCA / HCA Healthcare, Inc. | 0,01 | 249,19 | 3,92 | 282,44 | 0,1422 | 0,1080 | |||
| WRB / W. R. Berkley Corporation | 0,05 | 3,74 | 0,1355 | 0,1355 | |||||
| VIRT / Virtu Financial, Inc. | 0,11 | 38,05 | 3,72 | 29,58 | 0,1351 | 0,0393 | |||
| ADBE / Adobe Inc. | 0,01 | 310,73 | 3,61 | 307,81 | 0,1307 | 0,1012 | |||
| NSP / Insperity, Inc. | 0,09 | −2,81 | 3,51 | −23,52 | 0,1273 | −0,0257 | |||
| TPG / TPG Inc. | 0,05 | −51,90 | 3,02 | −46,56 | 0,1096 | −0,0788 | |||
| FIGR / Figure Technology Solutions, Inc. | 0,06 | 2,62 | 0,0949 | 0,0949 | |||||
| IRM / Iron Mountain Incorporated | 0,03 | 200,12 | 2,58 | 144,22 | 0,0935 | 0,0583 | |||
| COIN / Coinbase Global, Inc. | 0,01 | 2,51 | 0,0912 | 0,0912 | |||||
| XYZ / Block, Inc. | 0,04 | 113,16 | 2,31 | 92,03 | 0,0839 | 0,0437 | |||
| ARMK / Aramark | 0,05 | 20,79 | 2,02 | 15,94 | 0,0731 | 0,0152 | |||
| UWMC / UWM Holdings Corporation | 0,44 | 3 363,89 | 1,94 | 2 416,88 | 0,0703 | 0,0677 | |||
| INTU / Intuit Inc. | 0,00 | −96,20 | 1,84 | −96,32 | 0,0667 | −1,5974 | |||
| BILL / BILL Holdings, Inc. | Call | 0,03 | 1,64 | 0,0593 | 0,0593 | ||||
| GFL / GFL Environmental Inc. | 0,03 | −32,03 | 1,50 | −38,38 | 0,0545 | −0,0268 | |||
| EPAM / EPAM Systems, Inc. | 0,01 | 1,47 | 0,0533 | 0,0533 | |||||
| CPRT / Copart, Inc. | 0,03 | −42,41 | 1,31 | −49,89 | 0,0475 | −0,0396 | |||
| FDS / FactSet Research Systems Inc. | 0,00 | 53,34 | 1,28 | 55,35 | 0,0463 | 0,0189 | |||
| TRI / Thomson Reuters Corporation | 0,01 | 1,03 | 0,0372 | 0,0372 | |||||
| ETOR / eToro Group Ltd. | Call | 0,03 | 0,95 | 0,0344 | 0,0344 | ||||
| CTSH / Cognizant Technology Solutions Corporation | 0,01 | −91,44 | 0,89 | −89,41 | 0,0323 | −0,2478 | |||
| ALLY / Ally Financial Inc. | 0,02 | −89,33 | 0,86 | −87,68 | 0,0313 | −0,2022 | |||
| WEX / WEX Inc. | 0,01 | 0,81 | 0,0293 | 0,0293 | |||||
| WBS / Webster Financial Corporation | 0,01 | 0,79 | 0,0286 | 0,0286 | |||||
| MIAX / Miami International Holdings, Inc. | 0,02 | 0,76 | 0,0277 | 0,0277 | |||||
| FAF / First American Financial Corporation | 0,01 | 0,66 | 0,0241 | 0,0241 | |||||
| FOUR / Shift4 Payments, Inc. | 0,01 | 0,66 | 0,0240 | 0,0240 | |||||
| KLAR / Klarna Group plc | 0,02 | 0,63 | 0,0228 | 0,0228 | |||||
| ZION / Zions Bancorporation, National Association | 0,01 | −25,92 | 0,62 | −23,33 | 0,0225 | −0,0045 | |||
| AFG / American Financial Group, Inc. | 0,00 | −77,64 | 0,61 | −79,05 | 0,0221 | −0,0748 | |||
| BGC / BGC Group, Inc. | 0,07 | −50,27 | 0,59 | −53,12 | 0,0212 | −0,0203 | |||
| AAP / Advance Auto Parts, Inc. | 0,01 | 0,51 | 0,0185 | 0,0185 | |||||
| BURL / Burlington Stores, Inc. | 0,00 | 19,54 | 0,46 | 35,67 | 0,0169 | 0,0054 | |||
| DG / Dollar General Corporation | 0,00 | −57,08 | 0,46 | −44,82 | 0,0168 | −0,0112 | |||
| SHOP / Shopify Inc. | 0,00 | 0,45 | 0,0164 | 0,0164 | |||||
| BILL / BILL Holdings, Inc. | 0,01 | −26,67 | 0,44 | −24,49 | 0,0160 | −0,0035 | |||
| TGT / Target Corporation | 0,00 | 11,77 | 0,43 | 21,94 | 0,0155 | 0,0038 | |||
| CHYM / Chime Financial, Inc. | 0,02 | 0,40 | 0,0144 | 0,0144 | |||||
| ETOR / eToro Group Ltd. | 0,01 | −33,05 | 0,37 | −43,07 | 0,0136 | −0,0083 | |||
| ORLY / O'Reilly Automotive, Inc. | 0,00 | −31,78 | 0,30 | −42,23 | 0,0109 | −0,0065 | |||
| PAYX / Paychex, Inc. | 0,00 | −98,24 | 0,30 | −98,44 | 0,0108 | −0,6286 | |||
| DLTR / Dollar Tree, Inc. | 0,00 | 0,30 | 0,0108 | 0,0108 | |||||
| BJ / BJ's Wholesale Club Holdings, Inc. | 0,00 | −99,04 | 0,27 | −99,07 | 0,0097 | −0,9473 | |||
| FIVE / Five Below, Inc. | 0,00 | 0,26 | 0,0095 | 0,0095 | |||||
| MET / MetLife, Inc. | 0,00 | 0,22 | 0,0079 | 0,0079 | |||||
| ORCL / Oracle Corporation | 0,00 | −100,00 | 0,00 | 0,0000 | |||||
| CG / The Carlyle Group Inc. | 0,00 | −100,00 | 0,00 | 0,0000 | |||||
| GPC / Genuine Parts Company | 0,00 | −100,00 | 0,00 | 0,0000 | |||||
| MOH / Molina Healthcare, Inc. | 0,00 | −100,00 | 0,00 | 0,0000 | |||||
| HLI / Houlihan Lokey, Inc. | 0,00 | −100,00 | 0,00 | 0,0000 | |||||
| BFH / Bread Financial Holdings, Inc. | 0,00 | −100,00 | 0,00 | 0,0000 | |||||
| TROW / T. Rowe Price Group, Inc. | 0,00 | −100,00 | 0,00 | 0,0000 | |||||
| OWL / Blue Owl Capital Inc. | 0,00 | −100,00 | 0,00 | 0,0000 | |||||
| FHI / Federated Hermes, Inc. | Call | 0,00 | −100,00 | 0,00 | 0,0000 | ||||
| FTDR / Frontdoor, Inc. | 0,00 | −100,00 | 0,00 | 0,0000 | |||||
| CRBG / Corebridge Financial, Inc. | 0,00 | −100,00 | 0,00 | 0,0000 | |||||
| COF / Capital One Financial Corporation | 0,00 | −100,00 | 0,00 | 0,0000 | |||||
| BRK.B / Berkshire Hathaway Inc. | 0,00 | −100,00 | 0,00 | 0,0000 | |||||
| MCO / Moody's Corporation | 0,00 | −100,00 | 0,00 | 0,0000 | |||||
| FNF / Fidelity National Financial, Inc. | 0,00 | −100,00 | 0,00 | 0,0000 | |||||
| MKL / Markel Group Inc. | 0,00 | −100,00 | 0,00 | 0,0000 | |||||
| JHG / Janus Henderson Group plc | 0,00 | −100,00 | 0,00 | 0,0000 | |||||
| RDN / Radian Group Inc. | 0,00 | −100,00 | 0,00 | 0,0000 | |||||
| TW / Tradeweb Markets Inc. | 0,00 | −100,00 | 0,00 | 0,0000 | |||||
| MQ / Marqeta, Inc. | 0,00 | −100,00 | 0,00 | 0,0000 | |||||
| PFG / Principal Financial Group, Inc. | 0,00 | −100,00 | 0,00 | 0,0000 | |||||
| FHN / First Horizon Corporation | 0,00 | −100,00 | 0,00 | 0,0000 | |||||
| PRU / Prudential Financial, Inc. | 0,00 | −100,00 | 0,00 | 0,0000 | |||||
| LPLA / LPL Financial Holdings Inc. | 0,00 | −100,00 | 0,00 | 0,0000 | |||||
| AIZ / Assurant, Inc. | 0,00 | −100,00 | 0,00 | 0,0000 | |||||
| NTRS / Northern Trust Corporation | 0,00 | −100,00 | 0,00 | 0,0000 | |||||
| TJX / The TJX Companies, Inc. | 0,00 | −100,00 | 0,00 | 0,0000 | |||||
| AVB / AvalonBay Communities, Inc. | 0,00 | −100,00 | 0,00 | 0,0000 | |||||
| GSCE / GS Connect S&P GSCI Enhanced Commodity Total Return ETN | 0,00 | −100,00 | 0,00 | 0,0000 | |||||
| V / Visa Inc. | 0,00 | −100,00 | 0,00 | 0,0000 | |||||
| RJF / Raymond James Financial, Inc. | Call | 0,00 | −100,00 | 0,00 | 0,0000 |