Grundläggande statistik
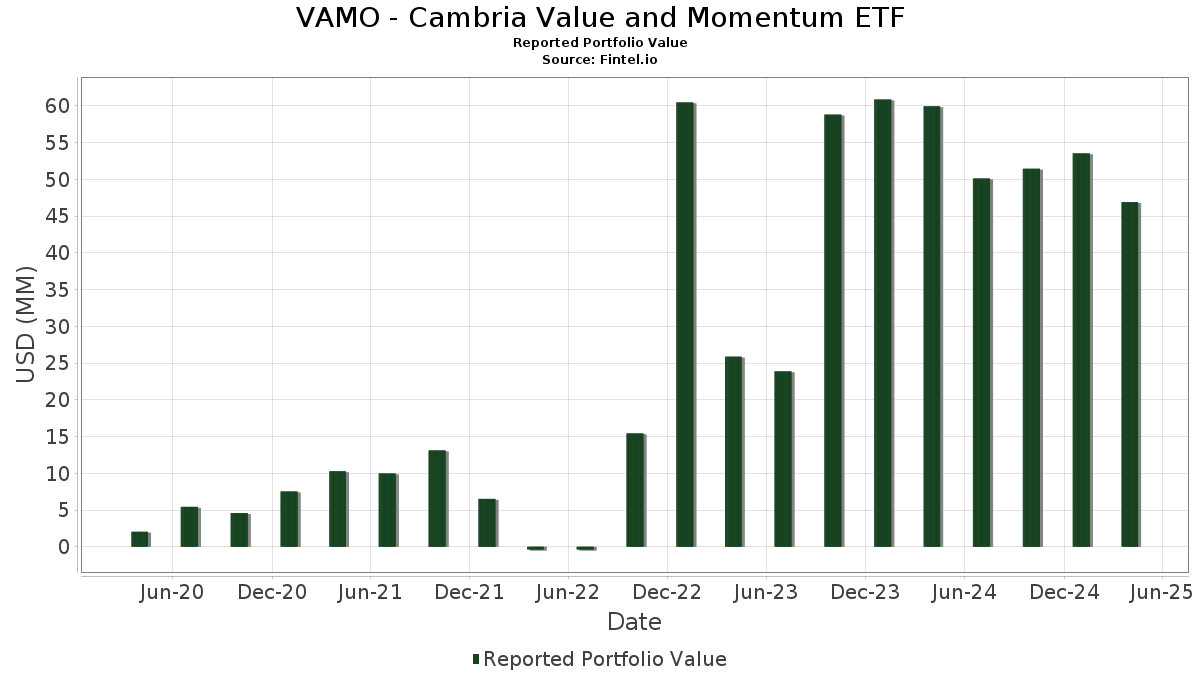
| Portföljvärde | $ 46 903 812 |
| Aktuella positioner | 103 |
Senaste innehav, resultat, förvaltat kapital (från 13F, 13D)
VAMO - Cambria Value and Momentum ETF har redovisat 103 totala innehav i sina senaste SEC-arkiveringar. Det senaste portföljvärdet beräknas vara $ 46 903 812 USD. Faktiskt förvaltade tillgångar (AUM) är detta värde plus likvida medel (som inte redovisas). VAMO - Cambria Value and Momentum ETFs största innehav är First American Funds Inc - First American Treasury Obligations Fund Class X (US:FXFXX) , Argan, Inc. (US:AGX) , Stride, Inc. (US:LRN) , CoreCivic, Inc. (US:CXW) , and Perimeter Solutions, Inc. (US:PRM) . VAMO - Cambria Value and Momentum ETFs nya positioner inkluderar Discover Financial Services (US:DFS) , Exelixis, Inc. (US:EXEL) , UGI Corporation (US:UGI) , Laureate Education, Inc. (US:LAUR) , and NETGEAR, Inc. (US:NTGR) .
Största ökningarna detta kvartal
Vi använder förändringen i portföljallokeringen eftersom det är det mest meningsfulla måttet. Förändringar kan bero på transaktioner eller förändringar i aktiekurser.
| Värdepapper | Aktier (MM) |
Värde (MM$) |
Portfölj % av | ΔPortfölj % av |
|---|---|---|---|---|
| 0,95 | 1,8214 | 1,8214 | ||
| DFS / Discover Financial Services | 0,00 | 0,48 | 0,9300 | 0,9300 |
| EXEL / Exelixis, Inc. | 0,01 | 0,47 | 0,9012 | 0,9012 |
| UGI / UGI Corporation | 0,01 | 0,45 | 0,8675 | 0,8675 |
| LAUR / Laureate Education, Inc. | 0,02 | 0,45 | 0,8632 | 0,8632 |
| NTGR / NETGEAR, Inc. | 0,02 | 0,44 | 0,8458 | 0,8458 |
| TAP / Molson Coors Beverage Company | 0,01 | 0,44 | 0,8447 | 0,8447 |
| BHF / Brighthouse Financial, Inc. | 0,01 | 0,44 | 0,8396 | 0,8396 |
| CPRX / Catalyst Pharmaceuticals, Inc. | 0,02 | 0,42 | 0,8107 | 0,8107 |
| EFSC / Enterprise Financial Services Corp | 0,01 | 0,42 | 0,7994 | 0,7994 |
Största minskningarna detta kvartal
Vi använder förändringen i portföljallokeringen eftersom det är det mest meningsfulla måttet. Förändringar kan bero på transaktioner eller förändringar i aktiepriser.
| Värdepapper | Aktier (MM) |
Värde (MM$) |
Portfölj % av | ΔPortfölj % av |
|---|---|---|---|---|
| FXFXX / First American Funds Inc - First American Treasury Obligations Fund Class X | 3,63 | 3,63 | 6,9792 | −4,3532 |
| LPX / Louisiana-Pacific Corporation | 0,00 | 0,00 | −0,8612 | |
| CEIX / CONSOL Energy Inc. | 0,00 | 0,00 | −0,7776 | |
| EVGO / EVgo, Inc. | 0,00 | 0,00 | −0,6041 | |
| UNM / Unum Group | 0,01 | 0,42 | 0,8001 | −0,5799 |
| CLOV / Clover Health Investments, Corp. | 0,12 | 0,39 | 0,7542 | −0,3617 |
| ADS / Bread Financial Holdings Inc | 0,01 | 0,41 | 0,7883 | −0,3358 |
| L / Loews Corporation | 0,01 | 0,44 | 0,8411 | −0,3335 |
| VST / Vistra Corp. | 0,00 | 0,44 | 0,8534 | −0,3097 |
| ENVA / Enova International, Inc. | 0,00 | 0,40 | 0,7724 | −0,3092 |
13F- och fond arkiveringar
Denna blankett lämnades in den 2025-06-27 för rapporteringsperioden 2025-04-30. Klicka på länksymbolen för att se hela transaktionshistoriken.
Uppgradera för att låsa upp premiumdata och exportera till Excel![]() .
.
| Värdepapper | Typ | Genomsnittligt aktiepris | Aktier (MM) |
ΔAktier (%) |
Värde ($MM) |
ΔAktier (%) |
Portfölj (%) |
ΔPortfölj (%) |
|
|---|---|---|---|---|---|---|---|---|---|
| FXFXX / First American Funds Inc - First American Treasury Obligations Fund Class X | 3,63 | −43,05 | 3,63 | −43,05 | 6,9792 | −4,3532 | |||
| S&P500 EMINI FUT Jun25 / DE (N/A) | 0,95 | 1,8214 | 1,8214 | ||||||
| AGX / Argan, Inc. | 0,00 | −15,65 | 0,54 | −5,59 | 1,0384 | 0,0215 | |||
| LRN / Stride, Inc. | 0,00 | −28,86 | 0,50 | −25,00 | 0,9690 | −0,2254 | |||
| CXW / CoreCivic, Inc. | 0,02 | 4,13 | 0,50 | 15,33 | 0,9680 | 0,1912 | |||
| PRM / Perimeter Solutions, Inc. | 0,05 | 38,21 | 0,49 | 12,02 | 0,9488 | 0,1655 | |||
| DFS / Discover Financial Services | 0,00 | 0,48 | 0,9300 | 0,9300 | |||||
| NRG / NRG Energy, Inc. | 0,00 | −10,00 | 0,48 | −3,59 | 0,9295 | 0,0367 | |||
| RSI / Rush Street Interactive, Inc. | 0,04 | 1,92 | 0,48 | −15,22 | 0,9210 | −0,0834 | |||
| CAH / Cardinal Health, Inc. | 0,00 | −43,92 | 0,48 | −23,11 | 0,9209 | −0,0890 | |||
| PPC / Pilgrim's Pride Corporation | 0,01 | −8,51 | 0,48 | 7,40 | 0,9206 | 0,1272 | |||
| IESC / IES Holdings, Inc. | 0,00 | −4,93 | 0,47 | −15,51 | 0,9110 | −0,0859 | |||
| CASH / Pathward Financial, Inc. | 0,01 | −43,25 | 0,47 | −12,94 | 0,9054 | 0,0667 | |||
| EXEL / Exelixis, Inc. | 0,01 | 0,47 | 0,9012 | 0,9012 | |||||
| ATGE / Adtalem Global Education Inc. | 0,00 | −21,82 | 0,47 | −22,48 | 0,9010 | −0,1740 | |||
| BAM / Brookfield Asset Management Ltd. | 0,01 | 146,54 | 0,47 | 120,38 | 0,8931 | 0,5173 | |||
| HOOD / Robinhood Markets, Inc. | 0,01 | −27,36 | 0,46 | −31,35 | 0,8879 | −0,3078 | |||
| MTG / MGIC Investment Corporation | 0,02 | −5,28 | 0,46 | −7,65 | 0,8825 | −0,0008 | |||
| MDU / MDU Resources Group, Inc. | 0,03 | 7,98 | 0,46 | 3,87 | 0,8763 | 0,0961 | |||
| ABM / ABM Industries Incorporated | 0,01 | 10,41 | 0,45 | 0,67 | 0,8736 | 0,0726 | |||
| T / AT&T Inc. | 0,02 | −18,39 | 0,45 | −4,63 | 0,8700 | 0,0255 | |||
| HIG / The Hartford Insurance Group, Inc. | 0,00 | −16,20 | 0,45 | −7,74 | 0,8700 | −0,0030 | |||
| UGI / UGI Corporation | 0,01 | 0,45 | 0,8675 | 0,8675 | |||||
| CALM / Cal-Maine Foods, Inc. | 0,00 | −15,31 | 0,45 | −26,83 | 0,8659 | −0,2267 | |||
| LAUR / Laureate Education, Inc. | 0,02 | 0,45 | 0,8632 | 0,8632 | |||||
| INGR / Ingredion Incorporated | 0,00 | 6,25 | 0,45 | 3,46 | 0,8632 | 0,0915 | |||
| PRDO / Perdoceo Education Corporation | 0,02 | −8,89 | 0,45 | −20,53 | 0,8631 | −0,1405 | |||
| DXPE / DXP Enterprises, Inc. | 0,01 | −12,72 | 0,45 | −23,68 | 0,8606 | −0,1833 | |||
| SKWD / Skyward Specialty Insurance Group, Inc. | 0,01 | −25,65 | 0,44 | −10,84 | 0,8538 | −0,0319 | |||
| COF / Capital One Financial Corporation | 0,00 | −16,07 | 0,44 | −25,75 | 0,8537 | −0,2091 | |||
| VST / Vistra Corp. | 0,00 | −12,06 | 0,44 | −32,11 | 0,8534 | −0,3097 | |||
| LZB / La-Z-Boy Incorporated | 0,01 | 4,59 | 0,44 | 25,78 | 0,8529 | 0,2811 | |||
| AFL / Aflac Incorporated | 0,00 | 2,90 | 0,44 | 4,23 | 0,8528 | 0,0956 | |||
| MCY / Mercury General Corporation | 0,01 | 0,10 | 0,44 | 11,36 | 0,8475 | 0,1434 | |||
| URBN / Urban Outfitters, Inc. | 0,01 | −11,79 | 0,44 | 1,15 | 0,8472 | 0,0224 | |||
| FNF / Fidelity National Financial, Inc. | 0,01 | 6,52 | 0,44 | 17,33 | 0,8461 | 0,1790 | |||
| NTGR / NETGEAR, Inc. | 0,02 | 0,44 | 0,8458 | 0,8458 | |||||
| TAP / Molson Coors Beverage Company | 0,01 | 0,44 | 0,8447 | 0,8447 | |||||
| TDS / Telephone and Data Systems, Inc. | 0,01 | −25,87 | 0,44 | −21,47 | 0,8443 | −0,1488 | |||
| ORI / Old Republic International Corporation | 0,01 | −40,59 | 0,44 | −20,33 | 0,8435 | −0,0097 | |||
| REVG / REV Group, Inc. | 0,01 | −17,92 | 0,44 | −22,61 | 0,8412 | −0,1645 | |||
| L / Loews Corporation | 0,01 | −34,84 | 0,44 | −33,89 | 0,8411 | −0,3335 | |||
| BHF / Brighthouse Financial, Inc. | 0,01 | 0,44 | 0,8396 | 0,8396 | |||||
| GPI / Group 1 Automotive, Inc. | 0,00 | −2,63 | 0,43 | −13,92 | 0,8333 | −0,0617 | |||
| UTHR / United Therapeutics Corporation | 0,00 | 25,66 | 0,43 | 8,29 | 0,8294 | 0,1223 | |||
| SANM / Sanmina Corporation | 0,01 | −4,41 | 0,43 | −12,27 | 0,8246 | −0,0452 | |||
| UHS / Universal Health Services, Inc. | 0,00 | 33,35 | 0,43 | 25,29 | 0,8199 | 0,2145 | |||
| SKYW / SkyWest, Inc. | 0,00 | −9,17 | 0,42 | −33,12 | 0,8120 | −0,3091 | |||
| CPRX / Catalyst Pharmaceuticals, Inc. | 0,02 | 0,42 | 0,8107 | 0,8107 | |||||
| DNOW / DNOW Inc. | 0,03 | −15,93 | 0,42 | −10,23 | 0,8086 | −0,0253 | |||
| RGA / Reinsurance Group of America, Incorporated | 0,00 | 10,83 | 0,42 | −8,91 | 0,8065 | −0,0121 | |||
| FCNCA / First Citizens BancShares, Inc. | 0,00 | −1,67 | 0,42 | −20,79 | 0,8063 | −0,1333 | |||
| SYF / Synchrony Financial | 0,01 | 0,27 | 0,42 | −24,41 | 0,8032 | −0,1803 | |||
| MLI / Mueller Industries, Inc. | 0,01 | −12,97 | 0,42 | −18,71 | 0,8013 | −0,1101 | |||
| UNM / Unum Group | 0,01 | −69,63 | 0,42 | −51,80 | 0,8001 | −0,5799 | |||
| EFSC / Enterprise Financial Services Corp | 0,01 | 0,42 | 0,7994 | 0,7994 | |||||
| TILE / Interface, Inc. | 0,02 | 24,50 | 0,42 | −5,47 | 0,7971 | 0,0174 | |||
| PLXS / Plexus Corp. | 0,00 | 21,53 | 0,41 | 4,82 | 0,7949 | 0,0949 | |||
| PRIM / Primoris Services Corporation | 0,01 | 26,73 | 0,41 | 154,94 | 0,7940 | 0,0936 | |||
| WSM / Williams-Sonoma, Inc. | 0,00 | −6,79 | 0,41 | −31,85 | 0,7935 | −0,2837 | |||
| AIZ / Assurant, Inc. | 0,00 | 14,39 | 0,41 | 2,50 | 0,7884 | 0,0769 | |||
| ADS / Bread Financial Holdings Inc | 0,01 | −13,46 | 0,41 | −35,23 | 0,7883 | −0,3358 | |||
| FOX / Fox Corporation | 0,01 | −10,20 | 0,41 | −14,44 | 0,7858 | −0,0646 | |||
| FOXA / Fox Corporation | 0,01 | −15,95 | 0,41 | −18,40 | 0,7853 | −0,1028 | |||
| EQH / Equitable Holdings, Inc. | 0,01 | −9,69 | 0,41 | −17,91 | 0,7837 | −0,0994 | |||
| FHN / First Horizon Corporation | 0,02 | 2,10 | 0,41 | 5,17 | 0,7835 | 0,1892 | |||
| IDCC / InterDigital, Inc. | 0,00 | −35,51 | 0,41 | −29,20 | 0,7790 | −0,2378 | |||
| TNL / Travel + Leisure Co. | 0,01 | 0,41 | 0,7783 | 0,7783 | |||||
| PRU / Prudential Financial, Inc. | 0,00 | 23,56 | 0,40 | 4,96 | 0,7738 | 0,0929 | |||
| UMBF / UMB Financial Corporation | 0,00 | 0,40 | 0,7735 | 0,7735 | |||||
| ENVA / Enova International, Inc. | 0,00 | −19,20 | 0,40 | −33,99 | 0,7724 | −0,3092 | |||
| PTGX / Protagonist Therapeutics, Inc. | 0,01 | −21,67 | 0,40 | −4,98 | 0,7706 | 0,0202 | |||
| CNO / CNO Financial Group, Inc. | 0,01 | 58,62 | 0,40 | 141,82 | 0,7679 | 0,0504 | |||
| US21871X1090 / Corebridge Financial, Inc. | 0,01 | −3,18 | 0,40 | −15,02 | 0,7608 | −0,0671 | |||
| JLL / Jones Lang LaSalle Incorporated | 0,00 | 99,31 | 0,40 | 107,33 | 0,7608 | 0,1269 | |||
| US71880K1016 / Phinia Inc | 0,01 | 3,56 | 0,40 | −18,22 | 0,7589 | −0,1000 | |||
| INT / World Fuel Services Corp. | 0,02 | 11,95 | 0,39 | −0,76 | 0,7583 | 0,0526 | |||
| MD / Pediatrix Medical Group, Inc. | 0,03 | −6,63 | 0,39 | −14,00 | 0,7560 | −0,0567 | |||
| CLOV / Clover Health Investments, Corp. | 0,12 | −19,30 | 0,39 | −37,58 | 0,7542 | −0,3617 | |||
| KAR / OPENLANE, Inc. | 0,02 | 0,39 | 0,7541 | 0,7541 | |||||
| CENX / Century Aluminum Company | 0,02 | −15,48 | 0,39 | −24,22 | 0,7524 | −0,1645 | |||
| CFG / Citizens Financial Group, Inc. | 0,01 | −4,55 | 0,39 | −26,05 | 0,7486 | −0,1866 | |||
| SNX / TD SYNNEX Corporation | 0,00 | 9,39 | 0,39 | −15,07 | 0,7486 | −0,0653 | |||
| GM / General Motors Company | 0,01 | −2,34 | 0,39 | −10,57 | 0,7477 | −0,0263 | |||
| JXN / Jackson Financial Inc. | 0,00 | −14,70 | 0,39 | −29,58 | 0,7466 | −0,2324 | |||
| UAL / United Airlines Holdings, Inc. | 0,01 | 0,39 | 0,7434 | 0,7434 | |||||
| TGNA / TEGNA Inc. | 0,02 | −6,10 | 0,39 | −16,27 | 0,7420 | −0,0783 | |||
| DAL / Delta Air Lines, Inc. | 0,01 | 0,38 | 0,7362 | 0,7362 | |||||
| YUMC / Yum China Holdings, Inc. | 0,01 | 0,38 | 0,7267 | 0,7267 | |||||
| LNC / Lincoln National Corporation | 0,01 | 1,46 | 0,38 | −8,05 | 0,7249 | −0,0040 | |||
| PL / Planet Labs PBC | 0,11 | 0,38 | 0,7215 | 0,7215 | |||||
| FGXXX / First American Funds Inc - First American Government Obligations Fund Class X | 0,38 | 153,75 | 0,38 | 153,38 | 0,7214 | 0,4438 | |||
| TPC / Tutor Perini Corporation | 0,02 | 9,55 | 0,37 | −2,61 | 0,7179 | 0,0377 | |||
| MATX / Matson, Inc. | 0,00 | 1,76 | 0,37 | −21,73 | 0,7138 | −0,1296 | |||
| SBOT / Serve Robotics Inc. | 0,06 | 0,37 | 0,7052 | 0,7052 | |||||
| ALK / Alaska Air Group, Inc. | 0,01 | 0,37 | 0,7027 | 0,7027 | |||||
| BHE / Benchmark Electronics, Inc. | 0,01 | 15,20 | 0,36 | −12,07 | 0,6862 | −0,0362 | |||
| NEXT / NextDecade Corporation | 0,05 | 0,36 | 0,6854 | 0,6854 | |||||
| WBD / Warner Bros. Discovery, Inc. | 0,04 | 0,36 | 0,6851 | 0,6851 | |||||
| 68V / Baker Hughes Company | 0,01 | 0,35 | 0,6788 | 0,6788 | |||||
| WTTR / Select Water Solutions, Inc. | 0,04 | 3,10 | 0,35 | −29,76 | 0,6668 | −0,2106 | |||
| SNCY / Sun Country Airlines Holdings, Inc. | 0,03 | 0,32 | 0,6149 | 0,6149 | |||||
| US761CVR0427 / RESOLUTE FOREST PRODUCTS | 0,07 | 0,00 | 0,09 | 0,00 | 0,1801 | 0,0136 | |||
| CEIX / CONSOL Energy Inc. | 0,00 | −100,00 | 0,00 | −100,00 | −0,7776 | ||||
| EVGO / EVgo, Inc. | 0,00 | −100,00 | 0,00 | −100,00 | −0,6041 | ||||
| LPX / Louisiana-Pacific Corporation | 0,00 | −100,00 | 0,00 | −100,00 | −0,8612 |