Grundläggande statistik
| Short Interest | 1 458 393 shares - source: NYSE |
| Short Interest Ratio | 4,23 Days to Cover |
| Off-Exchange Short Volume | 54 880 shares - source: FINRA (inc. Dark Pool volume) |
| Off-Exchange Short Volume Ratio | 49,27 % - source: FINRA (inc. Dark Pool volume) |
Introduktion
Denna kort ränta-tracker ger en mängd olika kort ränta relaterade data, hämtade från en mängd olika partners. Uppgifterna är organiserade efter uppdateringsfrekvens, med intradagsdata högst upp (tillgång till kort aktier, kort låneavgift), dagliga data (kort volym, fails-to-deliver) i mitten och de långsammast uppdaterade uppgifterna (kort ränta) längst ner. Observera att kort ränta publiceras två gånger per månad, enligt ett schema som fastställs av FINRA.
Kort squeeze poäng
Korta squeeze-poängen är resultatet av en sofistikerad kvantitativ flerfaktormodell som identifierar företag som har den högsta risken att drabbas av en kort squeeze. Poängsättningsmodellen använder en kombination av kort ränta, flyt, kort låneavgift och andra mätvärden. Siffran sträcker sig från 0 till 100, där högre siffror indikerar en högre risk för en kort squeeze i förhållande till sina konkurrenter, och 50 är genomsnittet.
Uppdateringsfrekvens: Intradag
Se våra Kort Squeeze Leaderboards för USA, Kanada, Australien och Hongkong
Korta låneavgifter
WPP / WPP plc - Depositary Receipt (Common Stock) Korta låneavgifter visas i följande tabell. Tabellen visar den räntesats som en blankare av US:WPP måste betala till långivaren av det värdepapperet. Denna avgift visas som en årlig procentsats (APR). Långivare är fonder eller individer som äger värdepapperet och som har meddelat mäklaren att de är villiga att låna ut det. Utdelningar som betalas till ett blankat värdepapper går till ägaren/långivaren av värdepapperet, inte till låntagaren.
- Start, Min, Max, Senaste (låneräntor)
- Dessa representerar låneräntor för dagen, med räntan i början av dagen, i slutet av dagen (eller den senaste för den aktuella dagen), den lägsta räntan under dagen och den högsta räntan för dagen. Till skillnad från Optionernas implicita låneräntor presenterar vår källa för dessa data dem alltid som positiva tal, och de representerar en årlig ränta som betalas av låntagaren för aktierna.
Uppdateringsfrekvens: Intradag var 30:e minut.
Senaste uppdatering
: 9 minutes ago
| Datum | Starta | Min | Max | Senaste |
|---|---|---|---|---|
| 2025-09-09 | 0,63 | 0,63 | 0,63 | 0,63 |
| 2025-09-08 | 0,66 | 0,62 | 0,66 | 0,63 |
| 2025-09-05 | 0,58 | 0,58 | 0,66 | 0,66 |
| 2025-09-04 | 0,58 | 0,58 | 0,58 | 0,58 |
| 2025-09-03 | 0,57 | 0,57 | 0,58 | 0,58 |
| 2025-09-02 | 0,59 | 0,54 | 0,63 | 0,57 |
| 2025-09-01 | 0,59 | 0,59 | 0,59 | 0,59 |
| 2025-08-29 | 0,54 | 0,54 | 0,59 | 0,59 |
| 2025-08-28 | 0,77 | 0,53 | 0,77 | 0,54 |
| 2025-08-27 | 0,53 | 0,53 | 0,77 | 0,77 |
Volym av blankningar (utanför börsen tillhandahållen av FINRA)
WPP / WPP plc - Depositary Receipt (Common Stock):s blankningsvolym utanför börsen visas i följande diagram. Volym för blankning visar antalet affärer som markerats som blankning på olika handelsplatser. För mer information om hur dessa uppgifter ska tolkas, läs detta informationsmeddelande från FINRA.
Uppdateringsfrekvens: Dagligen vid dagens slut
- FINRA Icke undantagen volym
- Antal korta aktier som handlats. Denna siffra tillhandahålls inte av FINRA men vi beräknar den genom att subtrahera "Undantagen" från "Kort volym"
- FINRA undantagen volym
- Antal sålda korta aktier som var undantagna från uptick-regeln. Detta tillhandahålls av FINRA. Detta antal ingår i både " Kort volym" och "Total volym".
- FINRA Kort volym
- Antal blankade aktier som rapporterats av FINRA. Detta inkluderar både undantagna och icke undantagna.
- FINRA Total volym
- Totalt antal aktier som handlats utanför börsen rapporterat av FINRA
- FINRA Kort volym-kvot
- FINRA Korta volym / FINRA Total volym
| Marknadsdatum | FINRA Inte undantagen volym |
FINRA Undantagen volym |
FINRA Kort volym |
FINRA Total volym |
FINRA Kort volym kvot |
||||
|---|---|---|---|---|---|---|---|---|---|
| 2025-09-08 | 54 880 | + | 0 | = | 54 880 | / | 111 382 | = | 49,27 |
| 2025-09-05 | 31 289 | + | 1 700 | = | 32 989 | / | 90 441 | = | 36,48 |
| 2025-09-04 | 47 717 | + | 0 | = | 47 717 | / | 157 431 | = | 30,31 |
| 2025-09-03 | 82 427 | + | 0 | = | 82 427 | / | 132 592 | = | 62,17 |
| 2025-09-02 | 98 878 | + | 0 | = | 98 878 | / | 196 930 | = | 50,21 |
| 2025-08-29 | 57 784 | + | 1 358 | = | 59 142 | / | 124 692 | = | 47,43 |
| 2025-08-28 | 55 558 | + | 547 | = | 56 105 | / | 114 991 | = | 48,79 |
| 2025-08-27 | 41 641 | + | 0 | = | 41 641 | / | 75 138 | = | 55,42 |
| 2025-08-26 | 53 290 | + | 0 | = | 53 290 | / | 107 367 | = | 49,63 |
| 2025-08-25 | 79 592 | + | 0 | = | 79 592 | / | 139 124 | = | 57,21 |
Volym av blankningar (kombinerad börs + utanför börs)
Den kombinerade korta försäljningsvolymen på börsen och utanför börsen för WPP / WPP plc - Depositary Receipt (Common Stock) finns i tabellen nedan. För att beräkna en korrekt kort volymkvot samlar vi in data från ett antal handelsplatser, men inte ALLA handelsplatser. Detta är viktigt eftersom det innebär att kolumnerna för aggregerad kort och total volym inte visar de faktiska volymerna över alla handelsplatser, utan bara de handelsplatser vi spårar.
- FINRA Kort volym
- Antal korta aktier som handlats utanför börsen rapporterat av FINRA. Detta inkluderar både undantagna och icke undantagna.
- CBOE Kort volym
- Antal korta aktier som handlats rapporterat av CBOE
- PSX/BX Kort volym
- Antal korta aktier som handlats rapporterat av NASDAQ på handelsplatserna PSX/BX
- Aggregerad Kort Volym
- FINRA Kort volym + CBOE Kort volym + PSX/BX Kort volym. Detta är inte den totala korta volymen på alla handelsplatser.
- Aggregerad Total Volym
- FINRA Total volym + CBOE Total volym + PSX/BX Total volym. Detta är inte den totala volymen på alla handelsplatser.
- Aggregerad Kort Volym-kvot
- Aggregerad kort volym / Aggregerad total volym
* Aggregerad kort volym och aggregerad total volym kolumnen visar inte den faktiska totala volymen över alla handelsplatser, utan bara de handelsplatser vi följer.
Fails-To-Deliver
Värdena för totalt antal fails to deliver-aktier representerar den aggregerade nettobalansen av aktier som inte har levererats per en viss likviddag. Fails to deliver på en viss dag är ett kumulativt antal av alla utestående fails fram till den dagen, plus nya fails som inträffar den dagen, minus fails som avvecklas den dagen. Siffran är inte ett dagligt antal fails, utan en kombinerad siffra som inkluderar både nya fails på rapporteringsdagen och befintliga fails. Med andra ord återspeglar dessa siffror aggregerade fails vid en viss tidpunkt och kan ha liten eller ingen relation till gårdagens aggregerade fails. Det är därför viktigt att notera att åldern på de uteblivna leveranserna inte kan fastställas genom att titta på dessa siffror.Om alla aktier levererades en viss dag kommer det inte att finnas någon post i tabellen.
Uppdateringsfrekvens: SEC publicerar dagliga data i batcher som levereras två gånger per månad och med cirka två veckors fördröjning. Så, till exempel, dagliga data för mars månad skulle anlända runt mitten av april.
Dessa data är INTE splitjusterade - de återspeglar de rådata som tillhandahålls av SEC.
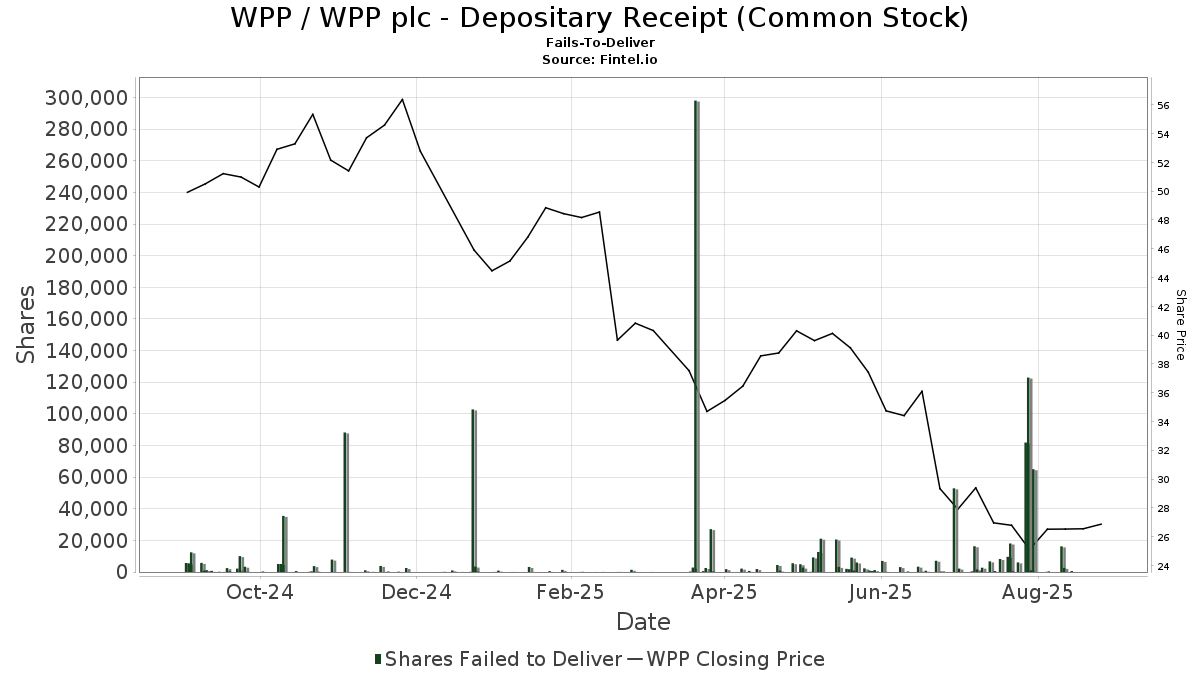
| Datum | Pris | Kvantitet | Värde |
|---|---|---|---|
| 2025-08-14 | 25,11 | 64 974 | 1 631 497,14 |
| 2025-08-13 | 24,55 | 1 094 | 26 857,70 |
| 2025-08-12 | 24,67 | 122 946 | 3 033 077,82 |
| 2025-08-11 | 24,75 | 81 855 | 2 025 911,25 |
| 2025-08-08 | 26,17 | 6 064 | 158 694,88 |
| 2025-08-07 | 26,79 | 36 | 964,44 |
| 2025-08-06 | 26,95 | 475 | 12 801,25 |
| 2025-08-05 | 26,64 | 18 023 | 480 132,72 |
| 2025-08-04 | 26,78 | 9 620 | 257 623,60 |
| 2025-08-01 | 27,08 | 8 191 | 221 812,28 |
| 2025-07-30 | 27,60 | 617 | 17 029,20 |
| 2025-07-28 | 29,27 | 6 728 | 196 928,56 |
| 2025-07-25 | 29,21 | 2 724 | 79 568,04 |
| 2025-07-24 | 29,39 | 158 | 4 643,62 |
| 2025-07-23 | 28,82 | 1 653 | 47 639,46 |
| 2025-07-22 | 27,97 | 16 272 | 455 127,84 |
| 2025-07-21 | 27,83 | 432 | 12 022,56 |
| 2025-07-16 | 27,91 | 2 146 | 59 894,86 |
| 2025-07-14 | 27,99 | 52 912 | 1 481 006,88 |
| 2025-07-10 | 29,34 | 333 | 9 770,22 |
WPP Korta ränta (dagliga Fintel-uppdateringar)
Detta avsnitt använder det officiella NYSE-levererade korta räntan och ger några värdeadderande mätvärden, beräknade dagligen. Kort ränta uppdateras två gånger i månaden enligt ett fastställt schema, men flyt kan uppdateras oftare (även om den inte ändras varje dag), så vi tillhandahåller dagliga uppdateringar av kort ränta % flyt för de senaste femton dagarna. Dagar att täcka beräknas dagligen baserat på den senaste fem dagars handelsvolymen.
Uppdateringsfrekvens: Kort ränta - två gånger per månad. Flyt - dagligen (ändras dock sällan) Schema för publicering av kort ränta
Dessa uppgifter är split-justerade.
| Marknadsdatum | Kort ränta (Aktier) |
Dagar att täcka | Flyt (MM Aktier) |
Flyt minus SI (MM Aktier) |
Kort ränta % Flyt |
|---|---|---|---|---|---|
| 2025-09-08 | |||||
| 2025-09-05 | |||||
| 2025-09-04 | |||||
| 2025-09-03 | |||||
| 2025-09-02 | |||||
| 2025-09-01 | |||||
| 2025-08-29 | |||||
| 2025-08-28 | |||||
| 2025-08-27 | |||||
| 2025-08-26 |
Källa: Kort ränta från NYSE- Utestående aktier och Aktier-flyt aktier tillhandahålls av Capital IQ.
Kort ränta (Officiella NYSE-uppgifter)
Dessa uppgifter är de officiella uppgifterna om kort ränta, som tillhandahålls av NYSE. Kort ränta är det totala antalet öppna korta positioner för ett värdepapper. Dagar att täcka är det korta räntan dividerat med den genomsnittliga volymen. De dagar att täcka som anges här är det officiella värdet som tillhandahålls av NYSE och kan skilja sig från de dagar att täcka som publiceras på andra ställen på Fintel eftersom vi använder en kortare återblicksperiod när vi beräknar genomsnittlig volym.
Uppdateringsfrekvens: Två gånger per månad
Dessa data är INTE splitjusterade - de återspeglar de rådata som tillhandahålls av börsen.
| Avveckling Datum |
Kort ränta | Procentuell förändring | Dagar att täcka | Flyt (MM Aktier) | Kort ränta % av flytet |
Utestående aktier (MM Aktier) |
Kort ränta % av SO |
|---|---|---|---|---|---|---|---|
| 2025-08-15 | 1 458 393 | 4,99 | 2,74 | ||||
| 2025-07-31 | 1 389 046 | 1,31 | 3,03 | ||||
| 2025-07-15 | 1 371 121 | 88,34 | 1,73 | ||||
| 2025-06-30 | 727 990 | −23,73 | 1,86 | ||||
| 2025-06-13 | 954 452 | 46,09 | 2,86 | ||||
| 2025-05-30 | 653 339 | 20,95 | 2,25 | ||||
| 2025-05-15 | 540 188 | −35,40 | 2,16 | ||||
| 2025-04-30 | 836 254 | 248,35 | 2,48 | ||||
| 2025-04-15 | 240 059 | −9,27 | 1,00 | ||||
| 2025-03-31 | 264 584 | −11,92 | 1,00 | ||||
| 2025-03-14 | 300 405 | −21,80 | 1,00 | ||||
| 2025-02-28 | 384 144 | 5,95 | 1,39 | ||||
| 2025-02-14 | 362 582 | 0,11 | 2,96 | ||||
| 2025-01-31 | 362 186 | 4,84 | 1,60 | ||||
| 2025-01-15 | 345 455 | 1,69 | 1,20 | ||||
| 2024-12-31 | 339 714 | −4,57 | 2,88 | ||||
| 2024-12-13 | 355 977 | 8,37 | 2,08 | ||||
| 2024-11-29 | 328 468 | 6,54 | 1,84 | ||||
| 2024-11-15 | 308 298 | 13,84 | 2,09 | ||||
| 2024-10-31 | 270 821 | 38,74 | 2,13 | ||||
| 2024-10-15 | 195 207 | 7,38 | 1,28 | ||||
| 2024-09-30 | 181 784 | −36,24 | 1,81 | ||||
| 2024-09-13 | 285 089 | 16,46 | 1,43 | ||||
| 2024-08-30 | 244 804 | −4,61 | 2,16 | ||||
| 2024-08-15 | 256 644 | −35,65 | 1,33 | ||||
| 2024-07-31 | 398 799 | 97,59 | 1,53 | ||||
| 2024-07-15 | 201 834 | 38,29 | 1,00 | ||||
| 2024-06-28 | 145 945 | 41,71 | 1,00 | ||||
| 2024-06-14 | 102 988 | −33,51 | 1,33 | ||||
| 2024-05-31 | 154 895 | 24,98 | 1,69 | ||||
| 2024-05-15 | 123 934 | −41,57 | 1,31 | ||||
| 2024-04-30 | 212 116 | −35,53 | 1,00 | ||||
| 2024-04-15 | 329 004 | 334,92 | 1,10 | ||||
| 2024-03-28 | 75 647 | −64,62 | 1,00 | ||||
| 2024-03-15 | 213 805 | 55,83 | 1,94 | ||||
| 2024-02-29 | 137 203 | −22,20 | 1,20 | ||||
| 2024-02-15 | 176 358 | −4,09 | 1,41 | ||||
| 2024-01-31 | 183 870 | 22,46 | 1,43 | ||||
| 2024-01-12 | 150 145 | 21,77 | 1,00 | ||||
| 2023-12-29 | 123 300 | −2,44 | 1,00 | ||||
| 2023-12-15 | 126 381 | −32,90 | 1,00 | ||||
| 2023-11-30 | 188 339 | 66,45 | 1,70 | ||||
| 2023-11-15 | 113 153 | 0,53 | 1,00 | ||||
| 2023-10-31 | 112 672 | −6,61 | 1,00 | ||||
| 2023-10-13 | 120 646 | 84,86 | 1,00 | ||||
| 2023-09-29 | 65 265 | 81,86 | 1,00 | ||||
| 2023-09-15 | 35 887 | −36,46 | 1,00 | ||||
| 2023-08-31 | 56 475 | −36,26 | 1,00 | ||||
| 2023-08-15 | 88 597 | 1,65 | 1,00 | ||||
| 2023-07-31 | 87 161 | 12,12 | 1,00 | ||||
| 2023-07-14 | 77 737 | −48,85 | 1,00 | ||||
| 2023-06-30 | 151 978 | −8,51 | 1,00 | ||||
| 2023-06-15 | 166 117 | 31,35 | 1,29 | ||||
| 2023-05-31 | 126 471 | −41,24 | 1,25 | ||||
| 2023-05-15 | 215 250 | 35,91 | 2,20 | ||||
| 2023-04-28 | 158 374 | −13,35 | 2,71 | ||||
| 2023-04-14 | 182 775 | −11,71 | 2,72 | ||||
| 2023-03-31 | 207 010 | −18,70 | 2,54 | ||||
| 2023-03-15 | 254 610 | 7,48 | 3,00 | ||||
| 2023-02-28 | 236 896 | −10,60 | 2,75 | ||||
| 2023-02-15 | 264 984 | −7,25 | 3,61 | ||||
| 2023-01-31 | 285 708 | 22,45 | 4,01 | ||||
| 2023-01-13 | 233 332 | 14,49 | 2,81 | ||||
| 2022-12-30 | 203 809 | −19,95 | 1,88 | ||||
| 2022-12-15 | 254 601 | −2,73 | 2,32 | ||||
| 2022-11-30 | 261 753 | 4,02 | 2,79 | ||||
| 2022-11-15 | 251 644 | −29,79 | 1,88 | ||||
| 2022-10-31 | 358 404 | 1,68 | 2,61 | ||||
| 2022-10-14 | 352 490 | 83,12 | 2,26 | ||||
| 2022-09-30 | 192 495 | 18,21 | 1,03 | ||||
| 2022-09-15 | 162 842 | −27,05 | 1,00 | ||||
| 2022-08-31 | 223 235 | 4,40 | 1,59 | ||||
| 2022-08-15 | 213 823 | 2,99 | 1,38 | ||||
| 2022-07-29 | 207 617 | −32,06 | 1,05 | ||||
| 2022-07-15 | 305 605 | 117,12 | 1,00 | ||||
| 2022-06-30 | 140 755 | −24,93 | 1,00 | ||||
| 2022-06-15 | 187 487 | −26,11 | 1,06 | ||||
| 2022-05-31 | 253 727 | 7,51 | 1,42 | ||||
| 2022-05-13 | 235 994 | 6,60 | 1,26 | ||||
| 2022-04-29 | 221 385 | −23,74 | 1,55 | ||||
| 2022-04-14 | 290 319 | 29,14 | 1,87 | ||||
| 2022-03-31 | 224 815 | −8,68 | 1,34 | ||||
| 2022-03-15 | 246 191 | −0,36 | 1,00 | ||||
| 2022-02-28 | 247 079 | 31,73 | 1,46 | ||||
| 2022-02-15 | 187 568 | −22,30 | 1,55 | ||||
| 2022-01-31 | 241 400 | 33,35 | 1,41 | ||||
| 2022-01-14 | 181 029 | −29,54 | 1,23 | ||||
| 2021-12-31 | 256 935 | 33,47 | 2,68 | ||||
| 2021-12-15 | 192 500 | −5,60 | 1,78 | ||||
| 2021-11-30 | 203 924 | −16,66 | 1,88 | ||||
| 2021-11-15 | 244 678 | −15,31 | 2,48 | ||||
| 2021-10-29 | 288 900 | 10,67 | 2,64 | ||||
| 2021-10-15 | 261 044 | 18,25 | 2,65 | ||||
| 2021-09-30 | 220 763 | 8,95 | 2,19 | ||||
| 2021-09-15 | 202 619 | −19,54 | 2,57 | ||||
| 2021-08-31 | 251 836 | 15,81 | 2,88 | ||||
| 2021-08-13 | 217 459 | −4,04 | 2,22 | ||||
| 2021-07-30 | 226 626 | 6,33 | 2,21 | ||||
| 2021-07-15 | 213 132 | −1,74 | 2,77 | ||||
| 2021-06-30 | 216 898 | −23,73 | 3,58 | ||||
| 2021-06-15 | 284 395 | 0,21 | 4,22 | ||||
| 2021-05-28 | 283 803 | 4,13 | 4,88 | ||||
| 2021-05-14 | 272 543 | −2,81 | 3,21 | ||||
| 2021-04-30 | 280 429 | 8,36 | 3,20 | ||||
| 2021-04-15 | 258 795 | −12,30 | 3,92 | ||||
| 2021-03-31 | 295 083 | 25,92 | 2,72 | ||||
| 2021-03-15 | 234 349 | −1,16 | 2,20 | ||||
| 2021-02-26 | 237 096 | −11,38 | 2,12 | ||||
| 2021-02-12 | 267 550 | −15,49 | 2,88 | ||||
| 2021-01-29 | 316 589 | −4,64 | 3,37 | ||||
| 2021-01-15 | 331 979 | 4,47 | 3,29 |
Källa: Kort ränta från NYSE- Utestående aktier och Aktier-flyt aktier tillhandahålls av Capital IQ.
Funds Disclosing Short Positions - Europe
This section shows European institutions, funds, and major shareholders that have reported short positions in the security.
Upgrade to unlock premium data.
| File Date | Owner | Issuer | ISIN | Total Capitalization Shorted (%) |
|---|---|---|---|---|
| 2025-09-05 | BlackRock Advisors, LLC | WPP PLC | JE00B8KF9B49 | 0,60 |
| 2025-09-03 | BlackRock Advisors, LLC | WPP PLC | JE00B8KF9B49 | 0,52 |
| 2025-08-26 | Citadel Advisors LLC | WPP PLC | JE00B8KF9B49 | 0,52 |
| 2025-08-07 | BlackRock Investment Management (UK) Limited | WPP PLC | JE00B8KF9B49 | 0,93 |
| 2025-08-06 | Citadel Advisors LLC | WPP PLC | JE00B8KF9B49 | 0,51 |
| 2025-07-28 | Marshall Wace LLP | WPP PLC | JE00B8KF9B49 | 0,49 |
| 2025-07-21 | Marshall Wace LLP | WPP PLC | JE00B8KF9B49 | 0,59 |
| 2025-07-17 | Marshall Wace LLP | WPP PLC | JE00B8KF9B49 | 0,66 |
| 2025-07-15 | Marshall Wace LLP | WPP PLC | JE00B8KF9B49 | 0,72 |
| 2025-07-14 | Citadel Advisors LLC | WPP PLC | JE00B8KF9B49 | 0,50 |
| 2025-07-11 | Marshall Wace LLP | WPP PLC | JE00B8KF9B49 | 0,88 |
| 2025-07-09 | Marshall Wace LLP | WPP PLC | JE00B8KF9B49 | 0,90 |
| 2025-07-08 | Marshall Wace LLP | WPP PLC | JE00B8KF9B49 | 0,89 |
| 2025-07-07 | Marshall Wace LLP | WPP PLC | JE00B8KF9B49 | 0,90 |
| 2025-07-02 | Marshall Wace LLP | WPP PLC | JE00B8KF9B49 | 0,89 |
| 2025-06-27 | AQR Capital Management, LLC | WPP PLC | JE00B8KF9B49 | 0,79 |
| 2025-06-26 | Walleye Capital LLC | WPP PLC | JE00B8KF9B49 | 0,45 |
| 2025-06-24 | Marshall Wace LLP | WPP PLC | JE00B8KF9B49 | 0,90 |
| 2025-06-20 | Citadel Advisors LLC | WPP PLC | JE00B8KF9B49 | 0,48 |
| 2025-06-17 | Citadel Advisors LLC | WPP PLC | JE00B8KF9B49 | 0,54 |
| 2025-06-16 | Citadel Advisors LLC | WPP PLC | JE00B8KF9B49 | 0,60 |
| 2025-06-12 | Citadel Advisors LLC | WPP PLC | JE00B8KF9B49 | 0,54 |
| 2025-06-11 | Citadel Advisors LLC | WPP PLC | JE00B8KF9B49 | 0,68 |
| 2025-06-10 | Marshall Wace LLP | WPP PLC | JE00B8KF9B49 | 0,71 |
| 2025-06-09 | BlackRock Investment Management (UK) Limited | WPP PLC | JE00B8KF9B49 | 0,80 |
| 2025-06-03 | BlackRock Investment Management (UK) Limited | WPP PLC | JE00B8KF9B49 | 0,71 |
| 2025-06-02 | Marshall Wace LLP | WPP PLC | JE00B8KF9B49 | 0,61 |
| 2025-05-15 | Marshall Wace LLP | WPP PLC | JE00B8KF9B49 | 0,51 |
| 2025-05-14 | Walleye Capital LLC | WPP PLC | JE00B8KF9B49 | 0,50 |
| 2025-04-29 | Marshall Wace LLP | WPP PLC | JE00B8KF9B49 | 0,50 |
| 2025-04-25 | AQR Capital Management, LLC | WPP PLC | JE00B8KF9B49 | 0,80 |
| 2025-04-23 | AQR Capital Management, LLC | WPP PLC | JE00B8KF9B49 | 0,79 |
| 2025-04-11 | Marshall Wace LLP | WPP PLC | JE00B8KF9B49 | 0,49 |
| 2025-03-14 | Marshall Wace LLP | WPP PLC | JE00B8KF9B49 | 0,50 |
| 2025-03-05 | BlackRock Investment Management (UK) Limited | WPP PLC | JE00B8KF9B49 | 0,64 |
| 2025-01-30 | Marshall Wace LLP | WPP PLC | JE00B8KF9B49 | 0,48 |
| 2025-01-08 | Marshall Wace LLP | WPP PLC | JE00B8KF9B49 | 0,51 |
| 2024-12-12 | AQR Capital Management, LLC | WPP PLC | JE00B8KF9B49 | 0,89 |
| 2024-12-09 | Marshall Wace LLP | WPP PLC | JE00B8KF9B49 | 0,44 |
| 2024-12-06 | AQR Capital Management, LLC | WPP PLC | JE00B8KF9B49 | 0,90 |
| 2024-12-03 | Marshall Wace LLP | WPP PLC | JE00B8KF9B49 | 0,51 |
| 2024-12-02 | Marshall Wace LLP | WPP PLC | JE00B8KF9B49 | 0,49 |
| 2024-11-25 | Marshall Wace LLP | WPP PLC | JE00B8KF9B49 | 0,56 |
| 2024-11-14 | Marshall Wace LLP | WPP PLC | JE00B8KF9B49 | 0,67 |
| 2024-11-04 | AQR Capital Management, LLC | WPP PLC | JE00B8KF9B49 | 0,80 |
| 2024-10-17 | Marshall Wace LLP | WPP PLC | JE00B8KF9B49 | 0,70 |
| 2024-10-08 | AQR Capital Management, LLC | WPP PLC | JE00B8KF9B49 | 0,70 |
| 2024-10-03 | Marshall Wace LLP | WPP PLC | JE00B8KF9B49 | 0,61 |
| 2024-09-26 | Marshall Wace LLP | WPP PLC | JE00B8KF9B49 | 0,50 |
| 2024-09-17 | AQR Capital Management, LLC | WPP PLC | JE00B8KF9B49 | 0,60 |
| 2024-08-29 | AQR Capital Management, LLC | WPP PLC | JE00B8KF9B49 | 0,50 |
| 2024-07-29 | Marshall Wace LLP | WPP PLC | JE00B8KF9B49 | 0,49 |
| 2024-07-11 | Marshall Wace LLP | WPP PLC | JE00B8KF9B49 | 0,59 |
| 2024-06-25 | Marshall Wace LLP | WPP PLC | JE00B8KF9B49 | 0,69 |
| 2024-06-06 | Marshall Wace LLP | WPP PLC | JE00B8KF9B49 | 0,79 |
| 2024-06-03 | Marshall Wace LLP | WPP PLC | JE00B8KF9B49 | 0,80 |
| 2024-05-29 | Marshall Wace LLP | WPP PLC | JE00B8KF9B49 | 0,72 |
| 2024-05-13 | Marshall Wace LLP | WPP PLC | JE00B8KF9B49 | 0,98 |
| 2024-05-02 | Marshall Wace LLP | WPP PLC | JE00B8KF9B49 | 1,00 |
| 2024-04-30 | Marshall Wace LLP | WPP PLC | JE00B8KF9B49 | 0,99 |
| 2024-04-18 | Marshall Wace LLP | WPP PLC | JE00B8KF9B49 | 1,00 |
| 2024-04-10 | Marshall Wace LLP | WPP PLC | JE00B8KF9B49 | 0,90 |
| 2024-03-21 | Marshall Wace LLP | WPP PLC | JE00B8KF9B49 | 0,80 |
| 2024-02-28 | Marshall Wace LLP | WPP PLC | JE00B8KF9B49 | 0,79 |
| 2024-02-20 | Marshall Wace LLP | WPP PLC | JE00B8KF9B49 | 0,80 |
| 2024-02-16 | Marshall Wace LLP | WPP PLC | JE00B8KF9B49 | 0,79 |
| 2024-02-15 | Marshall Wace LLP | WPP PLC | JE00B8KF9B49 | 0,80 |
| 2024-02-13 | Marshall Wace LLP | WPP PLC | JE00B8KF9B49 | 0,79 |
| 2024-02-12 | Marshall Wace LLP | WPP PLC | JE00B8KF9B49 | 0,80 |
| 2024-01-26 | Marshall Wace LLP | WPP PLC | JE00B8KF9B49 | 0,70 |
| 2024-01-16 | Marshall Wace LLP | WPP PLC | JE00B8KF9B49 | 0,61 |
| 2023-12-28 | Marshall Wace LLP | WPP PLC | JE00B8KF9B49 | 0,59 |
| 2023-11-08 | Marshall Wace LLP | WPP PLC | JE00B8KF9B49 | 0,69 |
| 2023-10-27 | Marshall Wace LLP | WPP PLC | JE00B8KF9B49 | 0,78 |
| 2023-10-26 | Marshall Wace LLP | WPP PLC | JE00B8KF9B49 | 0,80 |
| 2023-10-11 | Marshall Wace LLP | WPP PLC | JE00B8KF9B49 | 0,70 |
| 2023-09-28 | Marshall Wace LLP | WPP PLC | JE00B8KF9B49 | 0,60 |
| 2023-09-21 | Marshall Wace LLP | WPP PLC | JE00B8KF9B49 | 0,50 |
| 2023-03-09 | Marshall Wace LLP | WPP PLC | JE00B8KF9B49 | 0,48 |
| 2023-02-23 | Marshall Wace LLP | WPP PLC | JE00B8KF9B49 | 0,59 |
| 2023-02-02 | Marshall Wace LLP | WPP PLC | JE00B8KF9B49 | 0,67 |
| 2023-01-18 | Marshall Wace LLP | WPP PLC | JE00B8KF9B49 | 0,79 |
| 2023-01-10 | Marshall Wace LLP | WPP PLC | JE00B8KF9B49 | 0,80 |
| 2022-12-13 | Marshall Wace LLP | WPP PLC | JE00B8KF9B49 | 0,79 |
| 2022-10-25 | Marshall Wace LLP | WPP PLC | JE00B8KF9B49 | 0,88 |
| 2022-09-23 | Marshall Wace LLP | WPP PLC | JE00B8KF9B49 | 0,90 |
| 2022-09-12 | Marshall Wace LLP | WPP PLC | JE00B8KF9B49 | 0,89 |
| 2022-08-18 | Marshall Wace LLP | WPP PLC | JE00B8KF9B49 | 0,92 |
| 2022-08-12 | Marshall Wace LLP | WPP PLC | JE00B8KF9B49 | 0,80 |
| 2022-07-27 | Marshall Wace LLP | WPP PLC | JE00B8KF9B49 | 0,70 |
| 2022-07-22 | Marshall Wace LLP | WPP PLC | JE00B8KF9B49 | 0,69 |
| 2022-07-18 | Marshall Wace LLP | WPP PLC | JE00B8KF9B49 | 0,79 |
| 2022-07-05 | Marshall Wace LLP | WPP PLC | JE00B8KF9B49 | 0,84 |
| 2022-06-30 | Marshall Wace LLP | WPP PLC | JE00B8KF9B49 | 0,79 |
| 2022-06-17 | Marshall Wace LLP | WPP PLC | JE00B8KF9B49 | 0,89 |
| 2022-06-08 | BlackRock Investment Management (UK) Limited | WPP PLC | JE00B8KF9B49 | 0,39 |
| 2022-06-07 | BlackRock Investment Management (UK) Limited | WPP PLC | JE00B8KF9B49 | 0,50 |
| 2022-05-11 | Marshall Wace LLP | WPP PLC | JE00B8KF9B49 | 0,90 |
| 2022-03-30 | Marshall Wace LLP | WPP PLC | JE00B8KF9B49 | 0,82 |
| 2022-03-29 | Marshall Wace LLP | WPP PLC | JE00B8KF9B49 | 0,79 |
| 2022-03-28 | Marshall Wace LLP | WPP PLC | JE00B8KF9B49 | 0,80 |
| 2022-03-18 | Marshall Wace LLP | WPP PLC | JE00B8KF9B49 | 0,78 |
| 2022-03-09 | Marshall Wace LLP | WPP PLC | JE00B8KF9B49 | 0,80 |
| 2022-01-28 | Marshall Wace LLP | WPP PLC | JE00B8KF9B49 | 0,70 |
| 2021-11-26 | Marshall Wace LLP | WPP PLC | JE00B8KF9B49 | 0,60 |
| 2021-11-09 | Marshall Wace LLP | WPP PLC | JE00B8KF9B49 | 0,50 |
| 2021-10-28 | Marshall Wace LLP | WPP PLC | JE00B8KF9B49 | 0,48 |
| 2021-09-24 | Marshall Wace LLP | WPP PLC | JE00B8KF9B49 | 0,50 |
| 2018-11-13 | Marshall Wace LLP | WPP PLC | JE00B8KF9B49 | 0,46 |
| 2018-11-07 | Marshall Wace LLP | WPP PLC | JE00B8KF9B49 | 0,57 |
| 2018-11-05 | Marshall Wace LLP | WPP PLC | JE00B8KF9B49 | 0,66 |
| 2018-10-31 | Jupiter Investment Management Limited | WPP PLC | JE00B8KF9B49 | 0,38 |
| 2018-10-29 | Marshall Wace LLP | WPP PLC | JE00B8KF9B49 | 0,80 |
| 2018-10-25 | Marshall Wace LLP | WPP PLC | JE00B8KF9B49 | 0,77 |
| 2018-10-23 | Jupiter Investment Management Limited | WPP PLC | JE00B8KF9B49 | 0,57 |
| 2018-10-19 | Lone Pine Capital LLC | WPP PLC | JE00B8KF9B49 | 0,00 |
| 2018-10-18 | Jupiter Investment Management Limited | WPP PLC | JE00B8KF9B49 | 0,68 |
| 2018-10-12 | Marshall Wace LLP | WPP PLC | JE00B8KF9B49 | 0,70 |
| 2018-10-10 | Marshall Wace LLP | WPP PLC | JE00B8KF9B49 | 0,61 |
| 2018-10-05 | Jupiter Investment Management Limited | WPP PLC | JE00B8KF9B49 | 0,78 |
| 2018-09-17 | Marshall Wace LLP | WPP PLC | JE00B8KF9B49 | 0,50 |
| 2018-09-04 | Lone Pine Capital LLC | WPP PLC | JE00B8KF9B49 | 0,51 |
| 2018-08-31 | Lone Pine Capital LLC | WPP PLC | JE00B8KF9B49 | 0,49 |
| 2018-08-16 | Marshall Wace LLP | WPP PLC | JE00B8KF9B49 | 0,49 |
| 2018-08-07 | Marshall Wace LLP | WPP PLC | JE00B8KF9B49 | 0,58 |
| 2018-07-31 | Marshall Wace LLP | WPP PLC | JE00B8KF9B49 | 0,60 |
| 2018-07-24 | Jupiter Investment Management Limited | WPP PLC | JE00B8KF9B49 | 0,88 |
| 2018-07-23 | Jupiter Investment Management Limited | WPP PLC | JE00B8KF9B49 | 0,90 |
| 2018-07-18 | Lone Pine Capital LLC | WPP PLC | JE00B8KF9B49 | 0,54 |
| 2018-07-13 | Marshall Wace LLP | WPP PLC | JE00B8KF9B49 | 0,58 |
| 2018-07-03 | Marshall Wace LLP | WPP PLC | JE00B8KF9B49 | 0,67 |
| 2018-06-12 | Marshall Wace LLP | WPP PLC | JE00B8KF9B49 | 0,78 |
| 2018-06-08 | Marshall Wace LLP | WPP PLC | JE00B8KF9B49 | 0,80 |
| 2018-05-30 | Jupiter Investment Management Limited | WPP PLC | JE00B8KF9B49 | 0,80 |
| 2018-05-24 | Marshall Wace LLP | WPP PLC | JE00B8KF9B49 | 0,71 |
| 2018-05-23 | Marshall Wace LLP | WPP PLC | JE00B8KF9B49 | 0,66 |
| 2018-05-08 | Jupiter Investment Management Limited | WPP PLC | JE00B8KF9B49 | 0,70 |
| 2018-05-01 | Jupiter Investment Management Limited | WPP PLC | JE00B8KF9B49 | 0,61 |
| 2018-04-30 | Marshall Wace LLP | WPP PLC | JE00B8KF9B49 | 0,57 |
| 2018-04-27 | Marshall Wace LLP | WPP PLC | JE00B8KF9B49 | 0,67 |
| 2018-04-16 | Marshall Wace LLP | WPP PLC | JE00B8KF9B49 | 0,75 |
| 2018-04-11 | Jupiter Investment Management Limited | WPP PLC | JE00B8KF9B49 | 0,51 |
| 2018-04-09 | Marshall Wace LLP | WPP PLC | JE00B8KF9B49 | 0,63 |
| 2018-03-23 | Marshall Wace LLP | WPP PLC | JE00B8KF9B49 | 0,58 |
| 2018-03-19 | Marshall Wace LLP | WPP PLC | JE00B8KF9B49 | 0,67 |
| 2018-03-15 | Marshall Wace LLP | WPP PLC | JE00B8KF9B49 | 0,77 |
| 2018-03-08 | Marshall Wace LLP | WPP PLC | JE00B8KF9B49 | 0,88 |
| 2018-03-01 | Marshall Wace LLP | WPP PLC | JE00B8KF9B49 | 0,99 |
| 2018-02-15 | Marshall Wace LLP | WPP PLC | JE00B8KF9B49 | 1,06 |
| 2018-02-12 | Marshall Wace LLP | WPP PLC | JE00B8KF9B49 | 1,19 |
| 2018-02-01 | Marshall Wace LLP | WPP PLC | JE00B8KF9B49 | 1,21 |
| 2018-01-26 | Marshall Wace LLP | WPP PLC | JE00B8KF9B49 | 1,13 |
| 2018-01-17 | Marshall Wace LLP | WPP PLC | JE00B8KF9B49 | 1,00 |
| 2017-12-29 | Marshall Wace LLP | WPP PLC | JE00B8KF9B49 | 0,90 |
| 2017-12-18 | Marshall Wace LLP | WPP PLC | JE00B8KF9B49 | 0,82 |
| 2017-12-13 | Marshall Wace LLP | WPP PLC | JE00B8KF9B49 | 0,70 |
| 2017-12-01 | Marshall Wace LLP | WPP PLC | JE00B8KF9B49 | 0,61 |
| 2017-11-22 | Lone Pine Capital LLC | WPP PLC | JE00B8KF9B49 | 0,44 |
| 2017-11-13 | Marshall Wace LLP | WPP PLC | JE00B8KF9B49 | 0,51 |
| 2017-10-30 | Marshall Wace LLP | WPP PLC | JE00B8KF9B49 | 0,48 |
| 2017-10-27 | Marshall Wace LLP | WPP PLC | JE00B8KF9B49 | 0,50 |
| 2017-09-19 | Lone Pine Capital LLC | WPP PLC | JE00B8KF9B49 | 0,51 |
| 2015-02-19 | Carmignac Gestion | WPP PLC | JE00B8KF9B49 | 0,48 |
| 2015-02-18 | Carmignac Gestion | WPP PLC | JE00B8KF9B49 | 0,55 |
| 2015-01-14 | Carmignac Gestion | WPP PLC | JE00B8KF9B49 | 0,72 |
| 2015-01-08 | Carmignac Gestion | WPP PLC | JE00B8KF9B49 | 0,69 |
| 2014-12-31 | Carmignac Gestion | WPP PLC | JE00B8KF9B49 | 0,70 |
| 2014-12-26 | Carmignac Gestion | WPP PLC | JE00B8KF9B49 | 0,60 |
| 2014-12-24 | Carmignac Gestion | WPP PLC | JE00B8KF9B49 | 0,70 |
| 2014-12-22 | Carmignac Gestion | WPP PLC | JE00B8KF9B49 | 0,63 |
| 2013-05-29 | Susquehanna International Holdings LLC | WPP PLC | JE00B8KF9B49 | 0,00 |
| 2013-05-24 | D. E. Shaw & Co. (London), LLP | WPP PLC | JE00B8KF9B49 | 0,14 |
| 2013-04-08 | D. E. Shaw & Co. (London), LLP | WPP PLC | JE00B8KF9B49 | 1,23 |
| 2013-02-14 | Susquehanna International Holdings LLC | WPP PLC | JE00B8KF9B49 | 0,62 |
| 2013-02-13 | D. E. Shaw & Co. (U.K.), Ltd. | WPP PLC | JE00B8KF9B49 | 1,23 |
| 2013-01-30 | D. E. Shaw & Co. (U.K.), Ltd. | WPP PLC | JE00B8KF9B49 | 1,14 |
| 2013-01-17 | D. E. Shaw & Co. (U.K.), Ltd. | WPP PLC | JE00B8KF9B49 | 0,91 |
| 2013-01-16 | D. E. Shaw & Co. (U.K.), Ltd. | WPP PLC | JE00B8KF9B49 | 0,80 |
| 2013-01-11 | D. E. Shaw & Co. (U.K.), Ltd. | WPP PLC | JE00B8KF9B49 | 0,72 |
| 2012-12-12 | Susquehanna International Holdings LLC | WPP PLC | JE00B8KF9B49 | 0,50 |
| 2012-11-30 | Susquehanna International Holdings LLC | WPP PLC | JE00B8KF9B49 | 0,48 |
| 2012-11-28 | Susquehanna International Holdings LLC | WPP PLC | JE00B8KF9B49 | 0,50 |
| 2012-11-01 | D. E. Shaw & Co. (U.K.), Ltd. | WPP PLC | JE00B8KF9B49 | 0,64 |