Grundläggande statistik
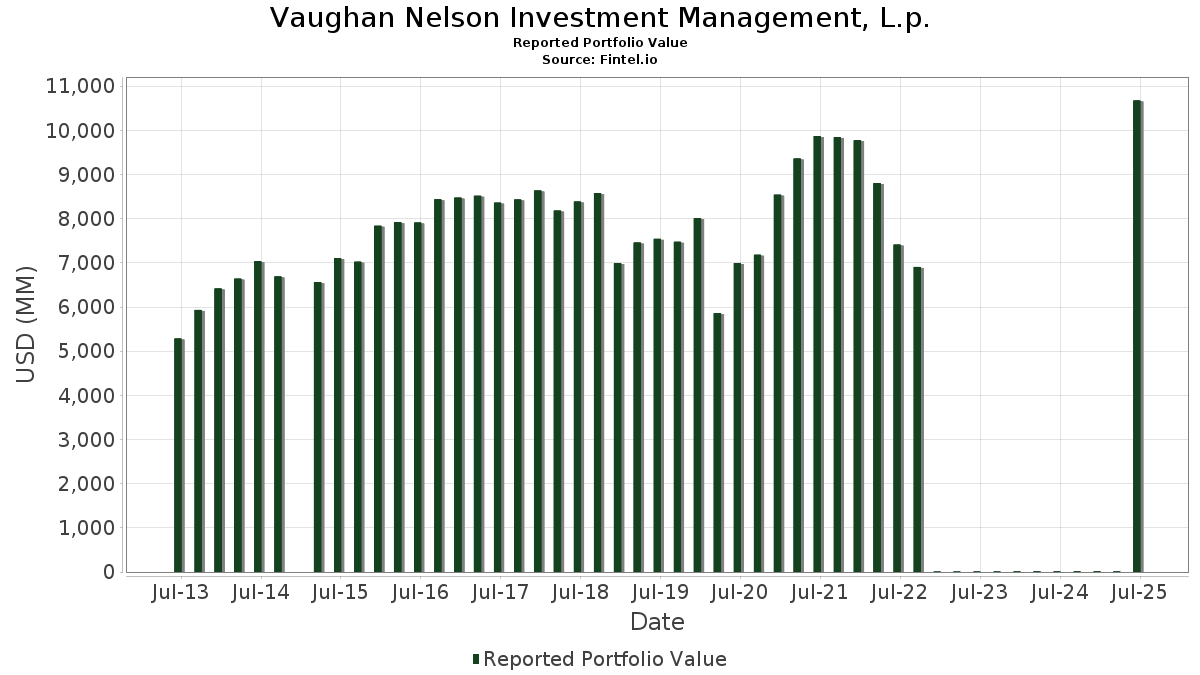
| Portföljvärde | $ 10 673 836 692 |
| Aktuella positioner | 195 |
Senaste innehav, resultat, förvaltat kapital (från 13F, 13D)
Vaughan Nelson Investment Management, L.p. har redovisat 195 totala innehav i sina senaste SEC-arkiveringar. Det senaste portföljvärdet beräknas vara $ 10 673 836 692 USD. Faktiskt förvaltade tillgångar (AUM) är detta värde plus likvida medel (som inte redovisas). Vaughan Nelson Investment Management, L.p.s största innehav är Microsoft Corporation (US:MSFT) , Amazon.com, Inc. (US:AMZN) , NVIDIA Corporation (US:NVDA) , Meta Platforms, Inc. (US:META) , and Taiwan Semiconductor Manufacturing Company Limited - Depositary Receipt (Common Stock) (US:TSM) . Vaughan Nelson Investment Management, L.p.s nya positioner inkluderar Spotify Technology S.A. (US:SPOT) , TransDigm Group Incorporated (US:TDG) , Burlington Stores, Inc. (US:BURL) , Clean Harbors, Inc. (US:CLH) , and Hexcel Corporation (US:HXL) . Vaughan Nelson Investment Management, L.p.s främsta industrier är "Water Transportation" (sic 44) , "Apparel And Accessory Stores" (sic 56) , and "Motor Freight Transportation And Warehousing" (sic 42) .
Största ökningarna detta kvartal
Vi använder förändringen i portföljallokeringen eftersom det är det mest meningsfulla måttet. Förändringar kan bero på transaktioner eller förändringar i aktiekurser.
| Värdepapper | Aktier (MM) |
Värde (MM$) |
Portfölj % av | ΔPortfölj % av |
|---|---|---|---|---|
| 0,27 | 209,49 | 1,9627 | 1,9627 | |
| 0,74 | 157,97 | 1,4800 | 1,4800 | |
| 0,44 | 156,22 | 1,4635 | 1,4635 | |
| 0,20 | 152,07 | 1,4247 | 1,4247 | |
| 0,06 | 94,09 | 0,8815 | 0,8815 | |
| 0,41 | 75,14 | 0,7039 | 0,7039 | |
| 1,94 | 307,26 | 2,8787 | 0,6868 | |
| 0,28 | 64,35 | 0,6029 | 0,6029 | |
| 0,26 | 59,08 | 0,5535 | 0,5535 | |
| 0,75 | 374,13 | 3,5051 | 0,5246 |
Största minskningarna detta kvartal
Vi använder förändringen i portföljallokeringen eftersom det är det mest meningsfulla måttet. Förändringar kan bero på transaktioner eller förändringar i aktiepriser.
| Värdepapper | Aktier (MM) |
Värde (MM$) |
Portfölj % av | ΔPortfölj % av |
|---|---|---|---|---|
| 0,77 | 141,10 | 0,3532 | −2,0064 | |
| 0,41 | 197,68 | 0,4948 | −1,7949 | |
| 1,29 | 87,12 | 0,2181 | −1,6809 | |
| 1,00 | 155,80 | 0,3899 | −1,6103 | |
| 0,92 | 113,50 | 0,2841 | −1,2890 | |
| 0,95 | 215,08 | 0,5383 | −1,1525 | |
| 0,31 | 128,82 | 0,3224 | −1,1304 | |
| 2,20 | 131,24 | 0,3285 | −1,1204 | |
| 1,97 | 153,71 | 0,3847 | −1,0817 | |
| 0,80 | 93,90 | 0,2350 | −1,0351 |
13D/G-arkiveringar
Detta är en lista över 13D- och 13G-arkiveringar som gjorts under det senaste året (om några). Klicka på länken för att se hela transaktionshistoriken. Gröna rader indikerar nya positioner. Röda rader indikerar stängda positioner.
| Fil Datum | Formulär | Värdepapper | Föregående aktier |
Aktuella aktier |
ΔAktier % | % Ägande |
% ΔÄgande | |
|---|---|---|---|---|---|---|---|---|
| 2025-07-22 | CWK / Cushman & Wakefield plc | 9 130 323 | 13 312 527 | 45,81 | 5,75 | 44,84 | ||
| 2025-07-22 | MFA / MFA Financial, Inc. | 5 602 534 | 0 | −100,00 | 0,00 | −100,00 | ||
| 2025-04-17 | KOS / Kosmos Energy Ltd. | 25 112 534 | 4 031 165 | −83,95 | 0,84 | −84,21 |
13F- och fond arkiveringar
Denna blankett lämnades in den 2025-07-21 för rapporteringsperioden 2025-06-30. Klicka på länksymbolen för att se hela transaktionshistoriken.
Uppgradera för att låsa upp premiumdata och exportera till Excel![]() .
.
| Värdepapper | Typ | Genomsnittligt aktiepris | Aktier (MM) |
ΔAktier (%) |
ΔAktier (%) |
Värde ($MM) |
Portfölj (%) |
ΔPortfölj (%) |
|
|---|---|---|---|---|---|---|---|---|---|
| MSFT / Microsoft Corporation | 0,75 | −5,28 | 374,13 | 125 445,30 | 3,5051 | 0,5246 | |||
| AMZN / Amazon.com, Inc. | 1,41 | −5,27 | 308,67 | 109 357,45 | 2,8918 | 0,0665 | |||
| NVDA / NVIDIA Corporation | 1,94 | −3,85 | 307,26 | 140 202,74 | 2,8787 | 0,6868 | |||
| META / Meta Platforms, Inc. | 0,36 | −3,75 | 263,00 | 123 374,18 | 2,4640 | 0,3306 | |||
| TSM / Taiwan Semiconductor Manufacturing Company Limited - Depositary Receipt (Common Stock) | 0,95 | −6,78 | 215,08 | 127 167,46 | 0,5383 | −1,1525 | |||
| GOOGL / Alphabet Inc. | 1,20 | −8,64 | 211,80 | 104 235,96 | 1,9843 | −0,0496 | |||
| JPM / JPMorgan Chase & Co. | 0,73 | −5,12 | 211,16 | 112 218,62 | 1,9783 | 0,0955 | |||
| SPOT / Spotify Technology S.A. | 0,27 | 209,49 | 1,9627 | 1,9627 | |||||
| IWN / iShares Trust - iShares Russell 2000 Value ETF | 1,29 | 4,53 | 203,58 | 109 348,92 | 1,9072 | 0,0438 | |||
| MPWR / Monolithic Power Systems, Inc. | 0,27 | 6,26 | 198,97 | 134 338,51 | 1,8641 | 0,3795 | |||
| BRK.B / Berkshire Hathaway Inc. | 0,41 | −5,36 | 197,68 | 86 220,96 | 0,4948 | −1,7949 | |||
| NOW / ServiceNow, Inc. | 0,18 | 14,11 | 180,15 | 147 565,57 | 0,4509 | −0,7715 | |||
| COHR / Coherent Corp. | 1,82 | 333,42 | 162,60 | 602 111,11 | 0,4070 | 0,1339 | |||
| SHW / The Sherwin-Williams Company | 0,47 | 83,06 | 161,70 | 181 589,89 | 0,4047 | −0,4934 | |||
| COF / Capital One Financial Corporation | 0,74 | 157,97 | 1,4800 | 1,4800 | |||||
| ETN / Eaton Corporation plc | 0,44 | 156,22 | 1,4635 | 1,4635 | |||||
| ZTS / Zoetis Inc. | 1,00 | −17,78 | 155,80 | 77 799,50 | 0,3899 | −1,6103 | |||
| ORLY / O'Reilly Automotive, Inc. | 1,72 | 1 052,93 | 155,24 | 72 442,06 | 1,4544 | −0,6854 | |||
| WAL / Western Alliance Bancorporation | 1,97 | 3,26 | 153,71 | 105 183,56 | 0,3847 | −1,0817 | |||
| URI / United Rentals, Inc. | 0,20 | 152,07 | 1,4247 | 1,4247 | |||||
| ZION / Zions Bancorporation, National Association | 2,83 | 9,26 | 147,25 | 114 044,96 | 0,3685 | −0,9249 | |||
| ICE / Intercontinental Exchange, Inc. | 0,77 | −43,79 | 141,10 | 59 942,98 | 0,3532 | −2,0064 | |||
| CWK / Cushman & Wakefield plc | 12,16 | 46,22 | 134,57 | 160 104,76 | 1,2608 | 0,4113 | |||
| CMA / Comerica Incorporated | 2,20 | −10,33 | 131,24 | 91 036,81 | 0,3285 | −1,1204 | |||
| MSI / Motorola Solutions, Inc. | 0,31 | −7,69 | 128,82 | 88 739,31 | 0,3224 | −1,1304 | |||
| XYL / Xylem Inc. | 0,97 | 29,13 | 125,61 | 141 033,71 | 0,3144 | −0,5837 | |||
| BLD / TopBuild Corp. | 0,37 | −5,52 | 118,34 | 101 047,01 | 0,2962 | −0,8835 | |||
| DIS / The Walt Disney Company | 0,92 | −42,59 | 113,50 | 72 194,90 | 0,2841 | −1,2890 | |||
| APAM / Artisan Partners Asset Management Inc. | 2,46 | 25,03 | 109,23 | 141 761,04 | 0,2734 | −0,4970 | |||
| IBP / Installed Building Products, Inc. | 0,59 | 11,94 | 107,02 | 118 810,00 | 0,2679 | −0,6410 | |||
| LECO / Lincoln Electric Holdings, Inc. | 0,50 | 24,39 | 104,59 | 137 515,79 | 0,2618 | −0,5052 | |||
| CFR / Cullen/Frost Bankers, Inc. | 0,81 | 13,38 | 103,70 | 116 415,73 | 0,2595 | −0,6311 | |||
| CIEN / Ciena Corporation | 1,24 | 375,44 | 100,50 | 669 893,33 | 0,2515 | 0,0945 | |||
| SIGI / Selective Insurance Group, Inc. | 1,15 | 1,99 | 99,70 | 96 700,00 | 0,2496 | −0,7831 | |||
| ESI / Element Solutions Inc | 4,30 | −9,80 | 97,32 | 90 856,07 | 0,2436 | −0,8333 | |||
| TDG / TransDigm Group Incorporated | 0,06 | 94,09 | 0,8815 | 0,8815 | |||||
| EXE / Expand Energy Corporation | 0,80 | −29,63 | 93,90 | 73 839,37 | 0,2350 | −1,0351 | |||
| VVV / Valvoline Inc. | 2,45 | 19,93 | 92,89 | 130 732,39 | 0,2325 | −0,4793 | |||
| CADE / Cadence Bank | 2,90 | 19,89 | 92,64 | 126 804,11 | 0,2319 | −0,5016 | |||
| RRR / Red Rock Resorts, Inc. | 1,77 | 10,69 | 92,28 | 133 639,13 | 0,2310 | −0,4638 | |||
| HRI / Herc Holdings Inc. | 0,70 | 362,83 | 92,24 | 461 075,00 | 0,2309 | 0,0277 | |||
| HII / Huntington Ingalls Industries, Inc. | 0,38 | 25,02 | 90,78 | 148 713,11 | 0,2272 | −0,3862 | |||
| PB / Prosperity Bancshares, Inc. | 1,27 | 14,12 | 89,18 | 112 784,81 | 0,8355 | 0,0416 | |||
| MDLZ / Mondelez International, Inc. | 1,29 | −53,85 | 87,12 | 45 996,83 | 0,2181 | −1,6809 | |||
| AR / Antero Resources Corporation | 2,15 | 12,14 | 86,49 | 112 223,38 | 0,2165 | −0,5577 | |||
| JBTM / JBT Marel Corporation | 0,69 | 21,16 | 83,40 | 120 765,22 | 0,7813 | 0,0820 | |||
| GXO / GXO Logistics, Inc. | 1,67 | −8,05 | 81,47 | 114 643,66 | 0,2039 | −0,5070 | |||
| KEX / Kirby Corporation | 0,71 | 12,67 | 80,99 | 126 445,31 | 0,2027 | −0,4374 | |||
| THG / The Hanover Insurance Group, Inc. | 0,46 | 25,62 | 78,93 | 123 229,69 | 0,1976 | −0,4457 | |||
| FCFS / FirstCash Holdings, Inc. | 0,58 | −9,96 | 77,94 | 101 123,38 | 0,1951 | −0,5754 | |||
| STAG / STAG Industrial, Inc. | 2,11 | 2,45 | 76,56 | 103 364,86 | 0,1916 | −0,5522 | |||
| CLS / Celestica Inc. | 0,48 | 75,69 | 0,1894 | 0,1894 | |||||
| WCC / WESCO International, Inc. | 0,41 | 75,14 | 0,7039 | 0,7039 | |||||
| XOM / Exxon Mobil Corporation | 0,67 | −6,74 | 72,00 | 84 603,53 | 0,1802 | −0,6714 | |||
| SR / Spire Inc. | 0,97 | 9,06 | 71,10 | 102 944,93 | 0,1780 | −0,5208 | |||
| AVGO / Broadcom Inc. | 0,25 | −0,51 | 69,23 | 164 730,95 | 0,6486 | 0,2260 | |||
| HWKN / Hawkins, Inc. | 0,47 | 35,08 | 67,32 | 181 845,95 | 0,6307 | 0,2593 | |||
| GATX / GATX Corporation | 0,43 | 52,71 | 66,71 | 151 509,09 | 0,1670 | −0,2746 | |||
| HUBB / Hubbell Incorporated | 0,16 | 130,31 | 66,25 | 287 926,09 | 0,1658 | −0,0672 | |||
| BURL / Burlington Stores, Inc. | 0,28 | 64,35 | 0,6029 | 0,6029 | |||||
| GIL / Gildan Activewear Inc. | 1,30 | 14,40 | 64,18 | 128 266,00 | 0,1606 | −0,3431 | |||
| EXP / Eagle Materials Inc. | 0,31 | 198,25 | 62,05 | 281 922,73 | 0,1553 | −0,0731 | |||
| TW / Tradeweb Markets Inc. | 0,42 | −19,82 | 61,91 | 79 269,23 | 0,1549 | −0,6278 | |||
| VMI / Valmont Industries, Inc. | 0,19 | 42,91 | 61,32 | 165 624,32 | 0,1535 | −0,2214 | |||
| SLGN / Silgan Holdings Inc. | 1,13 | 61,30 | 0,1534 | 0,1534 | |||||
| CLH / Clean Harbors, Inc. | 0,26 | 59,08 | 0,5535 | 0,5535 | |||||
| VMC / Vulcan Materials Company | 0,22 | −2,57 | 57,44 | 110 353,85 | 0,1438 | −0,3835 | |||
| AXON / Axon Enterprise, Inc. | 0,07 | 143,14 | 57,33 | 409 385,71 | 0,5371 | 0,3873 | |||
| BRKR / Bruker Corporation | 1,29 | 71,16 | 53,30 | 171 829,03 | 0,4993 | 0,1839 | |||
| RUSHA / Rush Enterprises, Inc. | 1,03 | −20,84 | 53,10 | 76 856,52 | 0,1329 | −0,5625 | |||
| NNN / NNN REIT, Inc. | 1,20 | −24,13 | 51,90 | 77 367,16 | 0,1299 | −0,5457 | |||
| RGA / Reinsurance Group of America, Incorporated | 0,26 | −21,16 | 51,02 | 79 621,88 | 0,1277 | −0,5146 | |||
| WTS / Watts Water Technologies, Inc. | 0,20 | 50,40 | 0,1261 | 0,1261 | |||||
| FSS / Federal Signal Corporation | 0,47 | 32,01 | 49,94 | 191 961,54 | 0,1250 | −0,1364 | |||
| HXL / Hexcel Corporation | 0,86 | 48,69 | 0,4562 | 0,4562 | |||||
| WRBY / Warby Parker Inc. | 2,22 | 105,53 | 48,60 | 255 705,26 | 0,1217 | −0,0749 | |||
| NWN / Northwest Natural Holding Company | 1,22 | 48,55 | 0,1215 | 0,1215 | |||||
| TNET / TriNet Group, Inc. | 0,65 | 90,11 | 47,44 | 175 603,70 | 0,1187 | −0,1516 | |||
| ERJ / Embraer S.A. - Depositary Receipt (Common Stock) | 0,83 | 15,36 | 47,37 | 143 451,52 | 0,1186 | −0,2147 | |||
| TYL / Tyler Technologies, Inc. | 0,08 | 25,59 | 46,94 | 130 286,11 | 0,4398 | 0,0733 | |||
| PFGC / Performance Food Group Company | 0,54 | 2,38 | 46,94 | 114 382,93 | 0,1175 | −0,2946 | |||
| WAB / Westinghouse Air Brake Technologies Corporation | 0,22 | 70,01 | 46,46 | 201 886,96 | 0,1163 | −0,1204 | |||
| CCCS / CCC Intelligent Solutions Holdings Inc. | 4,83 | 45,49 | 0,4262 | 0,4262 | |||||
| BWXT / BWX Technologies, Inc. | 0,31 | −43,76 | 44,99 | 83 220,37 | 0,1126 | −0,4351 | |||
| GEV / GE Vernova Inc. | 0,08 | 138,61 | 42,93 | 429 240,00 | 0,1075 | 0,0037 | |||
| BJ / BJ's Wholesale Club Holdings, Inc. | 0,39 | −2,76 | 42,29 | 91 839,13 | 0,1059 | −0,3543 | |||
| AZO / AutoZone, Inc. | 0,01 | −46,61 | 42,04 | 52 455,00 | 0,3939 | −0,4147 | |||
| MRVL / Marvell Technology, Inc. | 0,54 | −21,49 | 41,91 | 99 680,95 | 0,3926 | −0,0319 | |||
| VST / Vistra Corp. | 0,21 | 67,59 | 41,17 | 293 950,00 | 0,1030 | −0,0458 | |||
| SYF / Synchrony Financial | 0,61 | 40,38 | 0,1011 | 0,1011 | |||||
| FN / Fabrinet | 0,13 | 178,86 | 39,22 | 435 644,44 | 0,3674 | 0,2732 | |||
| EVRG / Evergy, Inc. | 0,57 | −2,95 | 39,09 | 97 612,50 | 0,3662 | −0,0366 | |||
| WEC / WEC Energy Group, Inc. | 0,37 | −5,27 | 38,52 | 91 611,90 | 0,0964 | −0,3288 | |||
| CMS / CMS Energy Corporation | 0,54 | −2,96 | 37,25 | 90 743,90 | 0,0932 | −0,3228 | |||
| LNT / Alliant Energy Corporation | 0,61 | −52,21 | 37,05 | 45 078,05 | 0,0927 | −0,7321 | |||
| CACI / CACI International Inc | 0,08 | −14,54 | 36,69 | 111 093,94 | 0,0918 | −0,2386 | |||
| VRT / Vertiv Holdings Co | 0,28 | 146,43 | 35,58 | 444 612,50 | 0,3333 | 0,2522 | |||
| NDAQ / Nasdaq, Inc. | 0,40 | −2,07 | 35,38 | 117 823,33 | 0,3314 | 0,0250 | |||
| GMED / Globus Medical, Inc. | 0,58 | −20,33 | 34,38 | 64 771,70 | 0,3221 | −0,2130 | |||
| EGP / EastGroup Properties, Inc. | 0,20 | −60,04 | 33,84 | 37 926,97 | 0,0847 | −0,8079 | |||
| ADMA / ADMA Biologics, Inc. | 1,80 | 32,79 | 0,3072 | 0,3072 | |||||
| ROK / Rockwell Automation, Inc. | 0,10 | −19,93 | 32,70 | 105 396,77 | 0,0819 | −0,2358 | |||
| FND / Floor & Decor Holdings, Inc. | 0,43 | 32,54 | 0,0815 | 0,0815 | |||||
| DPZ / Domino's Pizza, Inc. | 0,07 | −16,01 | 32,03 | 84 178,95 | 0,0802 | −0,3086 | |||
| MTDR / Matador Resources Company | 0,67 | −3,93 | 31,96 | 91 220,00 | 0,2994 | −0,0567 | |||
| PR / Permian Resources Corporation | 2,33 | −8,76 | 31,74 | 90 591,43 | 0,0794 | −0,2743 | |||
| PH / Parker-Hannifin Corporation | 0,04 | 118,86 | 31,42 | 261 750,00 | 0,2944 | 0,1695 | |||
| TOL / Toll Brothers, Inc. | 0,27 | 188,26 | 30,45 | 338 188,89 | 0,2852 | 0,1876 | |||
| OWL / Blue Owl Capital Inc. | 1,58 | 513,09 | 30,28 | 605 580,00 | 0,0758 | 0,0243 | |||
| MUR / Murphy Oil Corporation | 1,33 | −0,96 | 29,82 | 78 360,53 | 0,2793 | −0,1006 | |||
| CR / Crane Company | 0,16 | 9,90 | 29,48 | 140 266,67 | 0,0738 | −0,1426 | |||
| AME / AMETEK, Inc. | 0,15 | −2,06 | 26,40 | 105 484,00 | 0,2473 | −0,0090 | |||
| DHI / D.R. Horton, Inc. | 0,20 | 148,13 | 26,33 | 263 190,00 | 0,0659 | −0,0387 | |||
| FLS / Flowserve Corporation | 0,50 | 34,34 | 26,23 | 145 638,89 | 0,0657 | −0,1165 | |||
| RSG / Republic Services, Inc. | 0,10 | −60,29 | 25,85 | 40 926,98 | 0,0647 | −0,5743 | |||
| XPO / XPO, Inc. | 0,20 | −31,05 | 25,80 | 83 109,68 | 0,2417 | −0,0769 | |||
| COKE / Coca-Cola Consolidated, Inc. | 0,23 | 547,97 | 25,33 | 53 800,00 | 0,0634 | −0,4092 | |||
| GE / General Electric Company | 0,09 | 22,90 | 0,2145 | 0,2145 | |||||
| FTI / TechnipFMC plc | 0,66 | −37,91 | 22,74 | 68 821,21 | 0,0569 | −0,2801 | |||
| AEO / American Eagle Outfitters, Inc. | 2,31 | 41,66 | 22,20 | 123 211,11 | 0,0556 | −0,1337 | |||
| RRC / Range Resources Corporation | 0,54 | −53,44 | 21,83 | 47 365,22 | 0,0546 | −0,4057 | |||
| HLIO / Helios Technologies, Inc. | 0,61 | −23,36 | 20,20 | 80 704,00 | 0,0506 | −0,2029 | |||
| EXR / Extra Space Storage Inc. | 0,13 | −33,69 | 19,41 | 66 824,14 | 0,0486 | −0,2461 | |||
| ALLE / Allegion plc | 0,13 | −2,28 | 19,17 | 112 676,47 | 0,1796 | 0,0021 | |||
| A / Agilent Technologies, Inc. | 0,15 | −2,19 | 17,16 | 100 823,53 | 0,0429 | −0,1309 | |||
| ARES / Ares Management Corporation | 0,09 | 192,91 | 16,34 | 408 400,00 | 0,0409 | −0,0063 | |||
| TREX / Trex Company, Inc. | 0,28 | 15,06 | 0,1411 | 0,1411 | |||||
| LNW / Light & Wonder, Inc. | 0,14 | 13,75 | 0,1289 | 0,1289 | |||||
| CCL / Carnival Corporation & plc | 0,42 | −2,24 | 11,90 | 148 625,00 | 0,0298 | −0,0547 | |||
| SSNC / SS&C Technologies Holdings, Inc. | 0,14 | −0,89 | 11,64 | 105 681,82 | 0,0291 | −0,0893 | |||
| RCL / Royal Caribbean Cruises Ltd. | 0,04 | −16,49 | 11,25 | 140 575,00 | 0,0282 | −0,0602 | |||
| CDW / CDW Corporation | 0,06 | −66,74 | 10,14 | 37 470,37 | 0,0254 | −0,2482 | |||
| VNSE / Natixis ETF Trust II - Natixis Vaughan Nelson Select ETF | 0,24 | 1,55 | 8,52 | 121 657,14 | 0,0213 | −0,0539 | |||
| NU / Nu Holdings Ltd. | 0,62 | 2 221,21 | 8,45 | 0,0211 | 0,0184 | ||||
| KOS / Kosmos Energy Ltd. | 4,01 | 0,00 | 6,89 | 76 500,00 | 0,0173 | −0,0741 | |||
| MELI / MercadoLibre, Inc. | 0,00 | 8,51 | 5,90 | 147 350,00 | 0,0553 | 0,0147 | |||
| YPF / YPF Sociedad Anónima - Depositary Receipt (Common Stock) | 0,17 | 12,79 | 5,45 | 108 860,00 | 0,0136 | −0,0402 | |||
| IBM / International Business Machines Corporation | 0,01 | 0,00 | 4,39 | 146 300,00 | 0,0110 | −0,0260 | |||
| AJG / Arthur J. Gallagher & Co. | 0,01 | −85,40 | 3,97 | 13 579,31 | 0,0372 | −0,2560 | |||
| ABBV / AbbVie Inc. | 0,02 | 0,00 | 3,92 | 97 975,00 | 0,0098 | −0,0345 | |||
| MS / Morgan Stanley | 0,03 | 0,00 | 3,77 | 125 666,67 | 0,0094 | −0,0218 | |||
| CSCO / Cisco Systems, Inc. | 0,05 | 0,00 | 3,69 | 122 966,67 | 0,0346 | 0,0018 | |||
| WFC / Wells Fargo & Company | 0,04 | 0,00 | 3,55 | 118 200,00 | 0,0333 | 0,0015 | |||
| KO / The Coca-Cola Company | 0,05 | 0,00 | 3,32 | 110 500,00 | 0,0083 | −0,0253 | |||
| BRO / Brown & Brown, Inc. | 0,03 | −52,19 | 3,23 | 46 042,86 | 0,0303 | −0,0455 | |||
| NVT / nVent Electric plc | 0,04 | 31,68 | 3,23 | 322 600,00 | 0,0081 | −0,0095 | |||
| DUK / Duke Energy Corporation | 0,03 | 0,00 | 3,05 | 101 566,67 | 0,0286 | −0,0029 | |||
| JNJ / Johnson & Johnson | 0,02 | 0,00 | 3,01 | 100 133,33 | 0,0075 | −0,0251 | |||
| CMI / Cummins Inc. | 0,01 | 0,00 | 2,83 | 141 200,00 | 0,0071 | −0,0200 | |||
| HD / The Home Depot, Inc. | 0,01 | 0,00 | 2,71 | 135 600,00 | 0,0068 | −0,0203 | |||
| EFX / Equifax Inc. | 0,01 | 18,52 | 2,66 | 133 050,00 | 0,0250 | 0,0038 | |||
| MRK / Merck & Co., Inc. | 0,03 | 0,00 | 2,39 | 119 600,00 | 0,0060 | −0,0212 | |||
| CVS / CVS Health Corporation | 0,03 | 0,00 | 2,36 | 118 100,00 | 0,0059 | −0,0173 | |||
| EOG / EOG Resources, Inc. | 0,02 | 7,88 | 2,18 | 108 800,00 | 0,0055 | −0,0162 | |||
| PFE / Pfizer Inc. | 0,09 | 0,00 | 2,15 | 107 350,00 | 0,0054 | −0,0171 | |||
| EMR / Emerson Electric Co. | 0,02 | 0,00 | 2,09 | 209 200,00 | 0,0052 | −0,0120 | |||
| VZ / Verizon Communications Inc. | 0,05 | 0,00 | 2,09 | 104 500,00 | 0,0052 | −0,0167 | |||
| KDP / Keurig Dr Pepper Inc. | 0,06 | −47,48 | 2,08 | 51 800,00 | 0,0052 | −0,0357 | |||
| EPD / Enterprise Products Partners L.P. - Limited Partnership | 0,06 | 0,00 | 1,73 | 172 800,00 | 0,0043 | −0,0147 | |||
| UPS / United Parcel Service, Inc. | 0,02 | 0,00 | 1,71 | 170 800,00 | 0,0043 | −0,0143 | |||
| SKY / Champion Homes, Inc. | 0,03 | −94,47 | 1,64 | 3 629,55 | 0,0041 | −0,4449 | |||
| OKE / ONEOK, Inc. | 0,02 | 0,00 | 1,42 | 141 700,00 | 0,0036 | −0,0137 | |||
| CVX / Chevron Corporation | 0,01 | 0,00 | 1,21 | 120 900,00 | 0,0030 | −0,0111 | |||
| BLDR / Builders FirstSource, Inc. | 0,01 | 28,75 | 1,03 | 0,0026 | −0,0060 | ||||
| COP / ConocoPhillips | 0,01 | 0,00 | 0,95 | 94 800,00 | 0,0024 | −0,0087 | |||
| HIG / The Hartford Insurance Group, Inc. | 0,01 | 27,42 | 0,90 | 0,0023 | −0,0046 | ||||
| BIV / Vanguard Bond Index Funds - Vanguard Intermediate-Term Bond ETF | 0,01 | 0,00 | 0,89 | 0,0022 | −0,0066 | ||||
| SUB / iShares Trust - iShares Short-Term National Muni Bond ETF | 0,01 | −0,93 | 0,74 | 0,0019 | −0,0056 | ||||
| KSA / iShares Trust - iShares MSCI Saudi Arabia ETF | 0,02 | 0,64 | 0,0060 | 0,0060 | |||||
| IGIB / iShares Trust - iShares 5-10 Year Investment Grade Corporate Bond ETF | 0,01 | 0,00 | 0,63 | 0,0016 | −0,0046 | ||||
| VCSH / Vanguard Scottsdale Funds - Vanguard Short-Term Corporate Bond ETF | 0,01 | 0,00 | 0,47 | 0,0012 | −0,0035 | ||||
| BSV / Vanguard Bond Index Funds - Vanguard Short-Term Bond ETF | 0,01 | 0,00 | 0,47 | 0,0012 | −0,0035 | ||||
| AUB / Atlantic Union Bankshares Corporation | 0,01 | 27,49 | 0,46 | 0,0011 | −0,0024 | ||||
| VCIT / Vanguard Scottsdale Funds - Vanguard Intermediate-Term Corporate Bond ETF | 0,01 | 0,00 | 0,42 | 0,0010 | −0,0031 | ||||
| MUB / iShares Trust - iShares National Muni Bond ETF | 0,00 | −0,38 | 0,41 | 0,0010 | −0,0031 | ||||
| AAXJ / iShares Trust - iShares MSCI All Country Asia ex Japan ETF | 0,00 | 0,00 | 0,37 | 0,0009 | −0,0024 | ||||
| ARCC / Ares Capital Corporation | 0,02 | 0,00 | 0,35 | 0,0009 | −0,0027 | ||||
| D / Dominion Energy, Inc. | 0,00 | 0,00 | 0,26 | 0,0007 | −0,0019 | ||||
| IVV / iShares Trust - iShares Core S&P 500 ETF | 0,00 | 0,00 | 0,25 | 0,0006 | −0,0016 | ||||
| RTX / RTX Corporation | 0,00 | 0,00 | 0,16 | 0,0004 | −0,0011 | ||||
| MAIN / Main Street Capital Corporation | 0,00 | 0,00 | 0,16 | 0,0004 | −0,0011 | ||||
| TSLX / Sixth Street Specialty Lending, Inc. | 0,01 | 0,00 | 0,13 | 0,0003 | −0,0009 | ||||
| AB / AllianceBernstein Holding L.P. - Limited Partnership | 0,00 | 0,00 | 0,11 | 0,0003 | −0,0007 | ||||
| INTC / Intel Corporation | 0,00 | 0,00 | 0,09 | 0,0009 | −0,0001 | ||||
| CLX / The Clorox Company | 0,00 | 0,00 | 0,08 | 0,0002 | −0,0008 | ||||
| CCI / Crown Castle Inc. | 0,00 | 0,00 | 0,08 | 0,0002 | −0,0006 | ||||
| BSM / Black Stone Minerals, L.P. - Limited Partnership | 0,01 | 0,00 | 0,07 | 0,0002 | −0,0007 | ||||
| ILF / iShares Trust - iShares Latin America 40 ETF | 0,00 | 0,00 | 0,07 | 0,0002 | −0,0004 | ||||
| IWS / iShares Trust - iShares Russell Mid-Cap Value ETF | 0,00 | −70,32 | 0,06 | 0,0002 | −0,0018 | ||||
| VGSH / Vanguard Scottsdale Funds - Vanguard Short-Term Treasury ETF | 0,00 | 0,00 | 0,05 | 0,0001 | −0,0004 | ||||
| MGC / Vanguard World Fund - Vanguard Mega Cap ETF | 0,00 | 0,00 | 0,05 | 0,0001 | −0,0003 | ||||
| IWR / iShares Trust - iShares Russell Mid-Cap ETF | 0,00 | 0,04 | 0,0004 | 0,0004 | |||||
| SCHD / Schwab Strategic Trust - Schwab U.S. Dividend Equity ETF | 0,00 | 0,04 | 0,0004 | 0,0004 | |||||
| VO / Vanguard Index Funds - Vanguard Mid-Cap ETF | 0,00 | 0,00 | 0,02 | 0,0001 | −0,0002 | ||||
| AMLP / ALPS ETF Trust - Alerian MLP ETF | 0,00 | 0,00 | 0,01 | 0,0000 | −0,0001 | ||||
| ALL / The Allstate Corporation | 0,00 | −100,00 | 0,00 | 0,0000 | |||||
| ONTO / Onto Innovation Inc. | 0,00 | −100,00 | 0,00 | −100,00 | −0,3117 | ||||
| CMCO / Columbus McKinnon Corporation | 0,00 | −100,00 | 0,00 | −100,00 | −0,1651 | ||||
| TME / Tencent Music Entertainment Group - Depositary Receipt (Common Stock) | 0,00 | −100,00 | 0,00 | 0,0000 | |||||
| CPRI / Capri Holdings Limited | 0,00 | −100,00 | 0,00 | 0,0000 | |||||
| AXTA / Axalta Coating Systems Ltd. | 0,00 | −100,00 | 0,00 | 0,0000 | |||||
| HQY / HealthEquity, Inc. | 0,00 | −100,00 | 0,00 | 0,0000 | |||||
| MSCI / MSCI Inc. | 0,00 | −100,00 | 0,00 | 0,0000 | |||||
| CHD / Church & Dwight Co., Inc. | 0,00 | −100,00 | 0,00 | 0,0000 | |||||
| AU / AngloGold Ashanti plc | 0,00 | −100,00 | 0,00 | 0,0000 | |||||
| SAIA / Saia, Inc. | 0,00 | −100,00 | 0,00 | 0,0000 | |||||
| MAN / ManpowerGroup Inc. | 0,00 | −100,00 | 0,00 | 0,0000 | |||||
| AAON / AAON, Inc. | 0,00 | −100,00 | 0,00 | 0,0000 | |||||
| NSIT / Insight Enterprises, Inc. | 0,00 | −100,00 | 0,00 | 0,0000 | |||||
| POR / Portland General Electric Company | 0,00 | −100,00 | 0,00 | 0,0000 | |||||
| RMBS / Rambus Inc. | 0,00 | −100,00 | 0,00 | 0,0000 | |||||
| ISRG / Intuitive Surgical, Inc. | 0,00 | −100,00 | 0,00 | 0,0000 | |||||
| AZEK / The AZEK Company Inc. | 0,00 | −100,00 | 0,00 | 0,0000 | |||||
| KMPR / Kemper Corporation | 0,00 | −100,00 | 0,00 | 0,0000 | |||||
| SITE / SiteOne Landscape Supply, Inc. | 0,00 | −100,00 | 0,00 | 0,0000 | |||||
| UTHR / United Therapeutics Corporation | 0,00 | −100,00 | 0,00 | 0,0000 | |||||
| MTRN / Materion Corporation | 0,00 | −100,00 | 0,00 | 0,0000 | |||||
| FAF / First American Financial Corporation | 0,00 | −100,00 | 0,00 | 0,0000 | |||||
| BECN / Beacon Roofing Supply, Inc. | 0,00 | −100,00 | 0,00 | 0,0000 | |||||
| RXO / RXO, Inc. | 0,00 | −100,00 | 0,00 | 0,0000 | |||||
| SKX / Skechers U.S.A., Inc. | 0,00 | −100,00 | 0,00 | −100,00 | −0,0961 | ||||
| BILI / Bilibili Inc. - Depositary Receipt (Common Stock) | 0,00 | −100,00 | 0,00 | 0,0000 | −0,0035 | ||||
| FANG / Diamondback Energy, Inc. | 0,00 | −100,00 | 0,00 | 0,0000 | |||||
| MFA / MFA Financial, Inc. | 0,00 | −100,00 | 0,00 | 0,0000 | |||||
| BDX / Becton, Dickinson and Company | 0,00 | −100,00 | 0,00 | 0,0000 | |||||
| AGNC / AGNC Investment Corp. | 0,00 | −100,00 | 0,00 | 0,0000 | |||||
| ITGR / Integer Holdings Corporation | 0,00 | −100,00 | 0,00 | 0,0000 | |||||
| DKS / DICK'S Sporting Goods, Inc. | 0,00 | −100,00 | 0,00 | 0,0000 | |||||
| YUMC / Yum China Holdings, Inc. | 0,00 | −100,00 | 0,00 | 0,0000 | |||||
| STE / STERIS plc | 0,00 | −100,00 | 0,00 | 0,0000 |