Grundläggande statistik
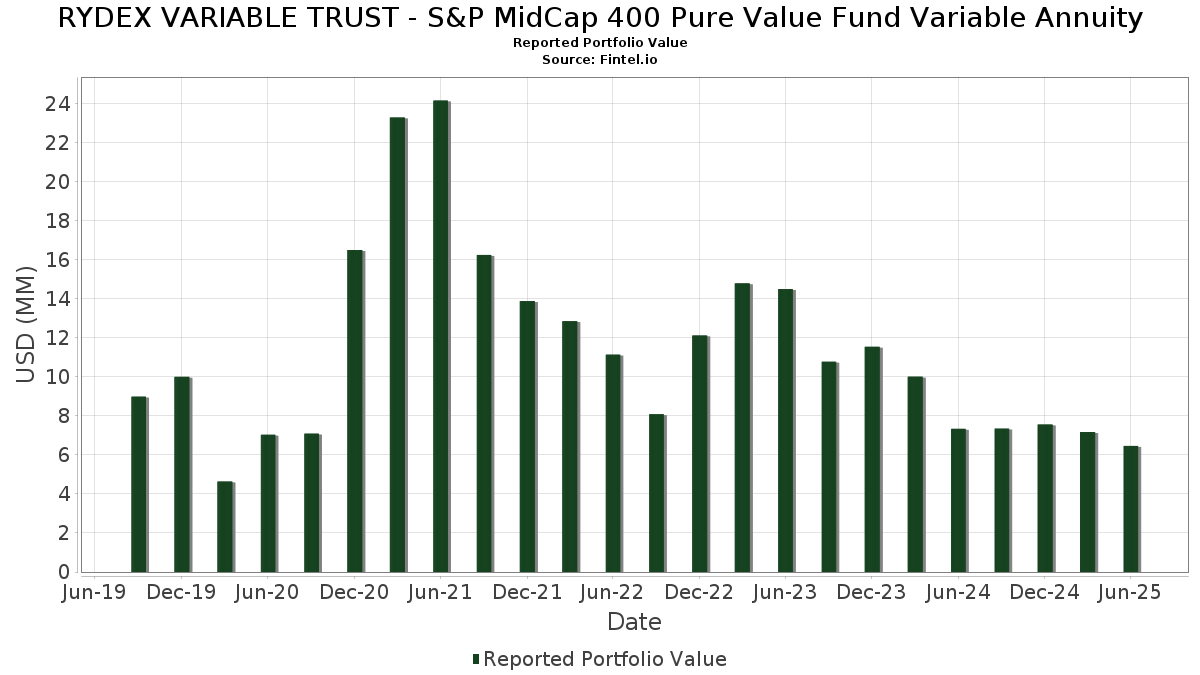
| Portföljvärde | $ 6 456 271 |
| Aktuella positioner | 86 |
Senaste innehav, resultat, förvaltat kapital (från 13F, 13D)
RYDEX VARIABLE TRUST - S&P MidCap 400 Pure Value Fund Variable Annuity har redovisat 86 totala innehav i sina senaste SEC-arkiveringar. Det senaste portföljvärdet beräknas vara $ 6 456 271 USD. Faktiskt förvaltade tillgångar (AUM) är detta värde plus likvida medel (som inte redovisas). RYDEX VARIABLE TRUST - S&P MidCap 400 Pure Value Fund Variable Annuitys största innehav är Concentrix Corporation (US:CNXC) , HF Sinclair Corporation (US:DINO) , The Goodyear Tire & Rubber Company (US:GT) , Avnet, Inc. (US:AVT) , and Arrow Electronics, Inc. (US:ARW) .
Största ökningarna detta kvartal
Vi använder förändringen i portföljallokeringen eftersom det är det mest meningsfulla måttet. Förändringar kan bero på transaktioner eller förändringar i aktiekurser.
| Värdepapper | Aktier (MM) |
Värde (MM$) |
Portfölj % av | ΔPortfölj % av |
|---|---|---|---|---|
| 0,00 | 0,15 | 2,4005 | 1,3296 | |
| 0,01 | 0,23 | 3,5873 | 0,7345 | |
| 0,00 | 0,19 | 2,9954 | 0,7169 | |
| 0,04 | 0,04 | 0,6084 | 0,6084 | |
| 0,00 | 0,20 | 3,0577 | 0,5835 | |
| 0,00 | 0,14 | 2,1971 | 0,4182 | |
| 0,02 | 0,22 | 3,4859 | 0,4005 | |
| 0,03 | 0,3923 | 0,3923 | ||
| 0,00 | 0,13 | 1,9915 | 0,3348 | |
| 0,00 | 0,06 | 0,9717 | 0,3323 |
Största minskningarna detta kvartal
Vi använder förändringen i portföljallokeringen eftersom det är det mest meningsfulla måttet. Förändringar kan bero på transaktioner eller förändringar i aktiepriser.
| Värdepapper | Aktier (MM) |
Värde (MM$) |
Portfölj % av | ΔPortfölj % av |
|---|---|---|---|---|
| 0,00 | 0,10 | 1,6270 | −0,6886 | |
| 0,01 | 0,10 | 1,4862 | −0,3214 | |
| 0,00 | 0,07 | 1,1264 | −0,2920 | |
| 0,00 | 0,06 | 0,9916 | −0,2521 | |
| 0,00 | 0,03 | 0,5297 | −0,2510 | |
| 0,01 | 0,28 | 4,4240 | −0,2024 | |
| 0,00 | 0,04 | 0,5721 | −0,1871 | |
| 0,00 | 0,07 | 1,1635 | −0,1811 | |
| 0,02 | 0,13 | 1,9844 | −0,1475 | |
| 0,01 | 0,13 | 2,0468 | −0,1433 |
13F- och fond arkiveringar
Denna blankett lämnades in den 2025-08-27 för rapporteringsperioden 2025-06-30. Klicka på länksymbolen för att se hela transaktionshistoriken.
Uppgradera för att låsa upp premiumdata och exportera till Excel![]() .
.
| Värdepapper | Typ | Genomsnittligt aktiepris | Aktier (MM) |
ΔAktier (%) |
ΔAktier (%) |
Värde ($MM) |
Portfölj (%) |
ΔPortfölj (%) |
|
|---|---|---|---|---|---|---|---|---|---|
| CNXC / Concentrix Corporation | 0,01 | −9,36 | 0,28 | −13,72 | 4,4240 | −0,2024 | |||
| DINO / HF Sinclair Corporation | 0,01 | −9,37 | 0,23 | 13,37 | 3,5873 | 0,7345 | |||
| GT / The Goodyear Tire & Rubber Company | 0,02 | −9,35 | 0,22 | 1,83 | 3,4859 | 0,4005 | |||
| AVT / Avnet, Inc. | 0,00 | −9,36 | 0,20 | 0,00 | 3,0664 | 0,3063 | |||
| ARW / Arrow Electronics, Inc. | 0,00 | −9,33 | 0,20 | 11,43 | 3,0577 | 0,5835 | |||
| SNX / TD SYNNEX Corporation | 0,00 | −9,31 | 0,19 | 18,63 | 2,9954 | 0,7169 | |||
| LEA / Lear Corporation | 0,00 | −9,38 | 0,17 | −2,29 | 2,6797 | 0,2064 | |||
| PBF / PBF Energy Inc. | 0,01 | −9,36 | 0,15 | 2,67 | 2,4204 | 0,3022 | |||
| CAR / Avis Budget Group, Inc. | 0,00 | −9,37 | 0,15 | 101,32 | 2,4005 | 1,3296 | |||
| AN / AutoNation, Inc. | 0,00 | −9,35 | 0,14 | 11,11 | 2,1971 | 0,4182 | |||
| LAD / Lithia Motors, Inc. | 0,00 | −9,47 | 0,14 | 3,76 | 2,1690 | 0,2943 | |||
| M / Macy's, Inc. | 0,01 | −9,35 | 0,13 | −15,48 | 2,0468 | −0,1433 | |||
| PAG / Penske Automotive Group, Inc. | 0,00 | −9,29 | 0,13 | 8,55 | 1,9915 | 0,3348 | |||
| CLF / Cleveland-Cliffs Inc. | 0,02 | −9,35 | 0,13 | −15,89 | 1,9844 | −0,1475 | |||
| BHF / Brighthouse Financial, Inc. | 0,00 | −9,38 | 0,12 | −16,55 | 1,8261 | −0,1309 | |||
| PFGC / Performance Food Group Company | 0,00 | −9,33 | 0,11 | 0,89 | 1,7791 | 0,1908 | |||
| ACI / Albertsons Companies, Inc. | 0,01 | −9,37 | 0,11 | −11,38 | 1,7040 | −0,0267 | |||
| WHR / Whirlpool Corporation | 0,00 | −9,40 | 0,11 | 1,89 | 1,6953 | 0,1979 | |||
| MAN / ManpowerGroup Inc. | 0,00 | −9,35 | 0,10 | −36,59 | 1,6270 | −0,6886 | |||
| PRGO / Perrigo Company plc | 0,00 | −9,36 | 0,10 | −13,56 | 1,5966 | −0,0679 | |||
| GHC / Graham Holdings Company | 0,00 | −9,82 | 0,10 | −11,21 | 1,4929 | −0,0210 | |||
| NOV / NOV Inc. | 0,01 | −9,35 | 0,10 | −25,78 | 1,4862 | −0,3214 | |||
| WCC / WESCO International, Inc. | 0,00 | −9,40 | 0,08 | 7,79 | 1,3106 | 0,2183 | |||
| RGA / Reinsurance Group of America, Incorporated | 0,00 | −9,32 | 0,08 | −8,14 | 1,2364 | 0,0177 | |||
| USFD / US Foods Holding Corp. | 0,00 | −9,31 | 0,08 | 6,85 | 1,2187 | 0,1901 | |||
| GEF / Greif, Inc. | 0,00 | −9,39 | 0,08 | 6,94 | 1,2142 | 0,1932 | |||
| THO / THOR Industries, Inc. | 0,00 | −9,45 | 0,08 | 5,63 | 1,1834 | 0,1789 | |||
| UGI / UGI Corporation | 0,00 | −9,36 | 0,08 | 0,00 | 1,1737 | 0,1149 | |||
| AGCO / AGCO Corporation | 0,00 | −9,34 | 0,08 | 1,35 | 1,1732 | 0,1275 | |||
| CHRD / Chord Energy Corporation | 0,00 | −9,32 | 0,07 | −22,11 | 1,1635 | −0,1811 | |||
| OSK / Oshkosh Corporation | 0,00 | −9,24 | 0,07 | 8,96 | 1,1494 | 0,2044 | |||
| CIVI / Civitas Resources, Inc. | 0,00 | −9,34 | 0,07 | −28,00 | 1,1264 | −0,2920 | |||
| ALLY / Ally Financial Inc. | 0,00 | −9,36 | 0,07 | −2,74 | 1,1135 | 0,0777 | |||
| UNM / Unum Group | 0,00 | −9,29 | 0,07 | −10,53 | 1,0711 | −0,0015 | |||
| VLY / Valley National Bancorp | 0,01 | −9,35 | 0,07 | −9,46 | 1,0538 | 0,0117 | |||
| OVV / Ovintiv Inc. | 0,00 | −9,38 | 0,06 | −18,99 | 1,0051 | −0,1183 | |||
| MUR / Murphy Oil Corporation | 0,00 | −9,38 | 0,06 | −28,41 | 0,9916 | −0,2521 | |||
| FLEX / Flex Ltd. | 0,00 | −9,32 | 0,06 | 37,78 | 0,9717 | 0,3323 | |||
| PVH / PVH Corp. | 0,00 | −9,41 | 0,06 | −3,17 | 0,9591 | 0,0607 | |||
| VC / Visteon Corporation | 0,00 | −9,28 | 0,06 | 8,93 | 0,9547 | 0,1663 | |||
| CNH / CNH Industrial N.V. | 0,00 | −9,36 | 0,06 | −4,76 | 0,9473 | 0,0556 | |||
| TMHC / Taylor Morrison Home Corporation | 0,00 | −9,30 | 0,06 | −7,81 | 0,9355 | 0,0276 | |||
| HOG / Harley-Davidson, Inc. | 0,00 | −9,37 | 0,06 | −15,94 | 0,9202 | −0,0580 | |||
| TEX / Terex Corporation | 0,00 | −9,41 | 0,06 | 11,54 | 0,9125 | 0,1785 | |||
| CNO / CNO Financial Group, Inc. | 0,00 | −9,34 | 0,06 | −15,15 | 0,8775 | −0,0634 | |||
| ASB / Associated Banc-Corp | 0,00 | −9,36 | 0,05 | −1,85 | 0,8375 | 0,0689 | |||
| DAR / Darling Ingredients Inc. | 0,00 | −9,39 | 0,05 | 10,42 | 0,8351 | 0,1517 | |||
| KRC / Kilroy Realty Corporation | 0,00 | −9,36 | 0,05 | −3,85 | 0,7841 | 0,0404 | |||
| GXO / GXO Logistics, Inc. | 0,00 | −9,37 | 0,05 | 11,36 | 0,7798 | 0,1580 | |||
| BILL / BILL Holdings, Inc. | 0,00 | −9,40 | 0,05 | −9,26 | 0,7798 | 0,0109 | |||
| GAP / The Gap, Inc. | 0,00 | −9,34 | 0,05 | −4,00 | 0,7635 | 0,0468 | |||
| FNB / F.N.B. Corporation | 0,00 | −9,35 | 0,05 | −2,04 | 0,7571 | 0,0633 | |||
| CPRI / Capri Holdings Limited | 0,00 | −9,38 | 0,05 | −18,64 | 0,7557 | −0,0814 | |||
| ORI / Old Republic International Corporation | 0,00 | −9,36 | 0,05 | −11,32 | 0,7440 | −0,0102 | |||
| ESNT / Essent Group Ltd. | 0,00 | −9,39 | 0,05 | −4,08 | 0,7419 | 0,0412 | |||
| OZK / Bank OZK | 0,00 | −9,28 | 0,05 | −2,13 | 0,7330 | 0,0612 | |||
| KMPR / Kemper Corporation | 0,00 | −9,46 | 0,05 | −13,21 | 0,7239 | −0,0218 | |||
| NWE / NorthWestern Energy Group, Inc. | 0,00 | −9,34 | 0,04 | −20,00 | 0,6924 | −0,0834 | |||
| CMC / Commercial Metals Company | 0,00 | −9,38 | 0,04 | −4,44 | 0,6861 | 0,0447 | |||
| PII / Polaris Inc. | 0,00 | −9,33 | 0,04 | −10,42 | 0,6852 | −0,0001 | |||
| SR / Spire Inc. | 0,00 | −9,41 | 0,04 | −16,00 | 0,6693 | −0,0440 | |||
| ARMK / Aramark | 0,00 | −9,29 | 0,04 | 10,53 | 0,6645 | 0,1207 | |||
| SWX / Southwest Gas Holdings, Inc. | 0,00 | −9,41 | 0,04 | −6,67 | 0,6601 | 0,0268 | |||
| SON / Sonoco Products Company | 0,00 | −9,41 | 0,04 | −16,33 | 0,6485 | −0,0506 | |||
| THG / The Hanover Insurance Group, Inc. | 0,00 | −9,36 | 0,04 | −10,87 | 0,6422 | −0,0112 | |||
| FAF / First American Financial Corporation | 0,00 | −9,36 | 0,04 | −14,58 | 0,6406 | −0,0398 | |||
| POR / Portland General Electric Company | 0,00 | −9,37 | 0,04 | −18,37 | 0,6385 | −0,0579 | |||
| VAC / Marriott Vacations Worldwide Corporation | 0,00 | −9,45 | 0,04 | 2,56 | 0,6281 | 0,0732 | |||
| AMKR / Amkor Technology, Inc. | 0,00 | −9,36 | 0,04 | 5,26 | 0,6256 | 0,0909 | |||
| First American Government Obligations Fund - Class X / STIV (N/A) | 0,04 | 0,04 | 0,6084 | 0,6084 | |||||
| STWD / Starwood Property Trust, Inc. | 0,00 | −9,34 | 0,04 | −9,76 | 0,5932 | 0,0128 | |||
| ACHC / Acadia Healthcare Company, Inc. | 0,00 | −9,33 | 0,04 | −32,08 | 0,5721 | −0,1871 | |||
| MMS / Maximus, Inc. | 0,00 | −9,49 | 0,04 | −5,26 | 0,5648 | 0,0190 | |||
| FLR / Fluor Corporation | 0,00 | −9,36 | 0,03 | 30,77 | 0,5430 | 0,1661 | |||
| KNX / Knight-Swift Transportation Holdings Inc. | 0,00 | −9,36 | 0,03 | −8,11 | 0,5417 | 0,0125 | |||
| BKH / Black Hills Corporation | 0,00 | −9,44 | 0,03 | −17,07 | 0,5381 | −0,0403 | |||
| NSP / Insperity, Inc. | 0,00 | −9,32 | 0,03 | −40,00 | 0,5297 | −0,2510 | |||
| PB / Prosperity Bancshares, Inc. | 0,00 | −9,40 | 0,03 | −10,81 | 0,5179 | −0,0052 | |||
| ASH / Ashland Inc. | 0,00 | −9,33 | 0,03 | −23,68 | 0,4579 | −0,0784 | |||
| COTY / Coty Inc. | 0,01 | −9,36 | 0,03 | −22,86 | 0,4228 | −0,0713 | |||
| DE000C4SA6R6 / EURO STOXX 50 Index | 0,03 | 0,3923 | 0,3923 | ||||||
| OLN / Olin Corporation | 0,00 | −9,34 | 0,02 | −23,08 | 0,3167 | −0,0629 | |||
| UAA / Under Armour, Inc. | 0,00 | −9,35 | 0,02 | 0,00 | 0,2616 | 0,0238 | |||
| UA / Under Armour, Inc. | 0,00 | −9,35 | 0,01 | 0,00 | 0,1730 | 0,0154 | |||
| Barclays Capital, Inc. / RA (N/A) | 0,01 | 0,1693 | 0,1693 | ||||||
| BofA Securities, Inc. / RA (N/A) | 0,01 | 0,1635 | 0,1635 |