Grundläggande statistik
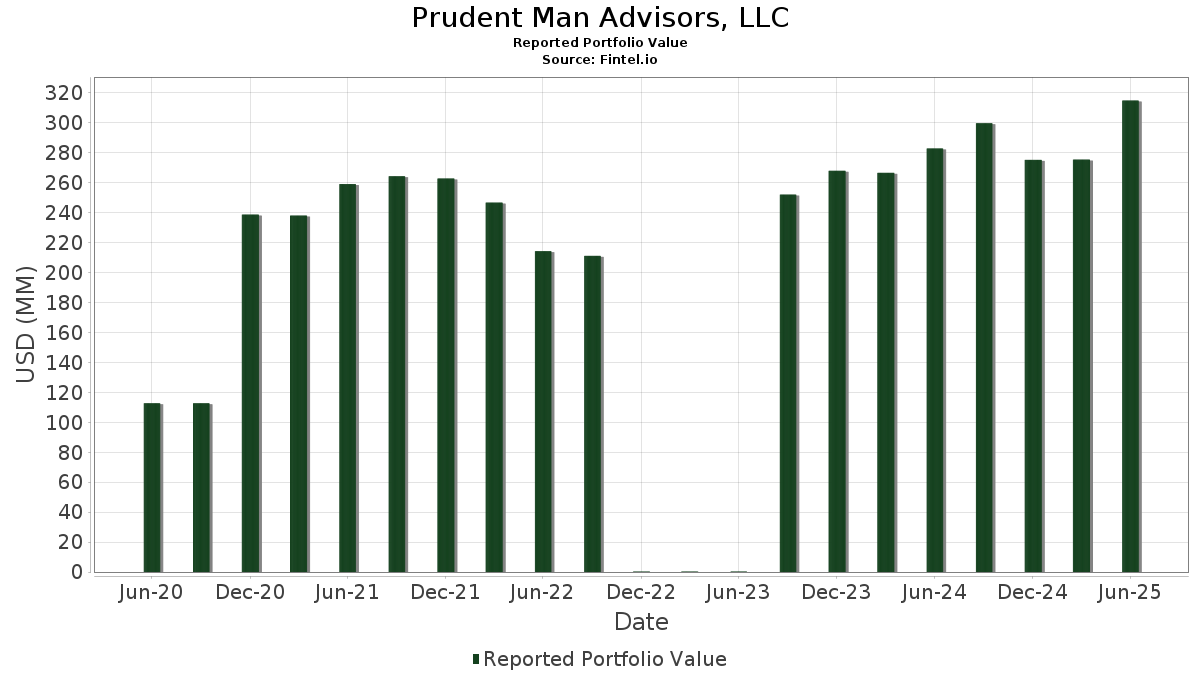
| Portföljvärde | $ 316 288 196 |
| Aktuella positioner | 181 |
Senaste innehav, resultat, förvaltat kapital (från 13F, 13D)
Prudent Man Advisors, LLC har redovisat 181 totala innehav i sina senaste SEC-arkiveringar. Det senaste portföljvärdet beräknas vara $ 316 288 196 USD. Faktiskt förvaltade tillgångar (AUM) är detta värde plus likvida medel (som inte redovisas). Prudent Man Advisors, LLCs största innehav är Vanguard Index Funds - Vanguard Total Stock Market ETF (US:VTI) , Vanguard Bond Index Funds - Vanguard Total Bond Market ETF (US:BND) , iShares Trust - iShares iBoxx $ High Yield Corporate Bond ETF (US:HYG) , iShares Trust - iShares ESG Aware MSCI USA ETF (US:ESGU) , and Vanguard Tax-Managed Funds - Vanguard FTSE Developed Markets ETF (US:VEA) . Prudent Man Advisors, LLCs nya positioner inkluderar Regions Financial Corporation (US:RF) , Vanguard Scottsdale Funds - Vanguard Russell 1000 Value ETF (US:VONV) , Fluor Corporation (US:FLR) , MYR Group Inc. (US:MYRG) , and Boot Barn Holdings, Inc. (US:BOOT) .
Största ökningarna detta kvartal
Vi använder förändringen i portföljallokeringen eftersom det är det mest meningsfulla måttet. Förändringar kan bero på transaktioner eller förändringar i aktiekurser.
| Värdepapper | Aktier (MM) |
Värde (MM$) |
Portfölj % av | ΔPortfölj % av |
|---|---|---|---|---|
| 0,05 | 8,13 | 2,5714 | 1,0590 | |
| 0,02 | 8,49 | 2,6845 | 0,8887 | |
| 0,07 | 4,71 | 1,4904 | 0,5897 | |
| 0,01 | 3,95 | 1,2476 | 0,5287 | |
| 0,02 | 4,82 | 1,5239 | 0,3821 | |
| 0,02 | 3,50 | 1,1053 | 0,3464 | |
| 0,01 | 1,88 | 0,5941 | 0,2667 | |
| 0,02 | 2,25 | 0,7123 | 0,2381 | |
| 0,01 | 1,41 | 0,4471 | 0,2263 | |
| 0,02 | 5,51 | 1,7433 | 0,2175 |
Största minskningarna detta kvartal
Vi använder förändringen i portföljallokeringen eftersom det är det mest meningsfulla måttet. Förändringar kan bero på transaktioner eller förändringar i aktiepriser.
| Värdepapper | Aktier (MM) |
Värde (MM$) |
Portfölj % av | ΔPortfölj % av |
|---|---|---|---|---|
| 0,14 | 41,59 | 13,1479 | −3,6004 | |
| 0,35 | 25,56 | 8,0820 | −1,1145 | |
| 0,20 | 16,37 | 5,1767 | −0,6272 | |
| 0,11 | 4,60 | 1,4530 | −0,1971 | |
| 0,09 | 7,01 | 2,2156 | −0,1585 | |
| 0,00 | 1,14 | 0,3609 | −0,1577 | |
| 0,04 | 3,49 | 1,1024 | −0,1575 | |
| 0,00 | 0,29 | 0,0922 | −0,1224 | |
| 0,07 | 3,07 | 0,9711 | −0,1215 | |
| 0,01 | 1,02 | 0,3231 | −0,1179 |
13F- och fond arkiveringar
Denna blankett lämnades in den 2025-07-31 för rapporteringsperioden 2025-06-30. Klicka på länksymbolen för att se hela transaktionshistoriken.
Uppgradera för att låsa upp premiumdata och exportera till Excel![]() .
.
| Värdepapper | Typ | Genomsnittligt aktiepris | Aktier (MM) |
ΔAktier (%) |
ΔAktier (%) |
Värde ($MM) |
Portfölj (%) |
ΔPortfölj (%) |
|
|---|---|---|---|---|---|---|---|---|---|
| VTI / Vanguard Index Funds - Vanguard Total Stock Market ETF | 0,14 | −18,48 | 41,59 | −9,85 | 13,1479 | −3,6004 | |||
| BND / Vanguard Bond Index Funds - Vanguard Total Bond Market ETF | 0,35 | 0,67 | 25,56 | 0,92 | 8,0820 | −1,1145 | |||
| HYG / iShares Trust - iShares iBoxx $ High Yield Corporate Bond ETF | 0,20 | 0,19 | 16,37 | 2,43 | 5,1767 | −0,6272 | |||
| ESGU / iShares Trust - iShares ESG Aware MSCI USA ETF | 0,07 | 1,78 | 9,81 | 12,96 | 3,1023 | −0,0516 | |||
| VEA / Vanguard Tax-Managed Funds - Vanguard FTSE Developed Markets ETF | 0,15 | −0,33 | 8,89 | 11,80 | 2,8122 | −0,0762 | |||
| MSFT / Microsoft Corporation | 0,02 | 29,55 | 8,49 | 71,65 | 2,6845 | 0,8887 | |||
| NVDA / NVIDIA Corporation | 0,05 | 33,94 | 8,13 | 95,27 | 2,5714 | 1,0590 | |||
| BSV / Vanguard Bond Index Funds - Vanguard Short-Term Bond ETF | 0,09 | 6,60 | 7,01 | 7,17 | 2,2156 | −0,1585 | |||
| AAPL / Apple Inc. | 0,03 | 28,72 | 6,93 | 18,41 | 2,1926 | 0,0662 | |||
| JPM / JPMorgan Chase & Co. | 0,02 | 11,01 | 5,51 | 31,20 | 1,7433 | 0,2175 | |||
| AMZN / Amazon.com, Inc. | 0,02 | 32,92 | 4,82 | 53,28 | 1,5239 | 0,3821 | |||
| VXUS / Vanguard STAR Funds - Vanguard Total International Stock ETF | 0,07 | 70,79 | 4,71 | 90,04 | 1,4904 | 0,5897 | |||
| SRLN / SSGA Active Trust - SPDR Blackstone Senior Loan ETF | 0,11 | 0,00 | 4,60 | 1,12 | 1,4530 | −0,1971 | |||
| IVV / iShares Trust - iShares Core S&P 500 ETF | 0,01 | −3,06 | 4,19 | 7,13 | 1,3263 | −0,0955 | |||
| AVGO / Broadcom Inc. | 0,01 | 21,06 | 3,95 | 99,34 | 1,2476 | 0,5287 | |||
| IWM / iShares Trust - iShares Russell 2000 ETF | 0,02 | −0,13 | 3,51 | 8,03 | 1,1102 | −0,0699 | |||
| GOOG / Alphabet Inc. | 0,02 | 47,30 | 3,50 | 67,22 | 1,1053 | 0,3464 | |||
| VNQ / Vanguard Specialized Funds - Vanguard Real Estate ETF | 0,04 | 2,14 | 3,49 | 0,46 | 1,1024 | −0,1575 | |||
| PM / Philip Morris International Inc. | 0,02 | 8,43 | 3,26 | 24,42 | 1,0313 | 0,0794 | |||
| VMBS / Vanguard Scottsdale Funds - Vanguard Mortgage-Backed Securities ETF | 0,07 | 2,00 | 3,07 | 2,06 | 0,9711 | −0,1215 | |||
| BRK.B / Berkshire Hathaway Inc. | 0,01 | 40,94 | 2,79 | 27,87 | 0,8808 | 0,0898 | |||
| VYM / Vanguard Whitehall Funds - Vanguard High Dividend Yield ETF | 0,02 | 0,40 | 2,67 | 3,76 | 0,8457 | −0,0900 | |||
| BLK / BlackRock, Inc. | 0,00 | 11,82 | 2,50 | 24,00 | 0,7909 | 0,0582 | |||
| MS / Morgan Stanley | 0,02 | 9,83 | 2,34 | 32,58 | 0,7412 | 0,0993 | |||
| PLD / Prologis, Inc. | 0,02 | 9,35 | 2,32 | 2,83 | 0,7350 | −0,0858 | |||
| ABT / Abbott Laboratories | 0,02 | 16,15 | 2,30 | 19,08 | 0,7265 | 0,0260 | |||
| WMT / Walmart Inc. | 0,02 | 54,87 | 2,25 | 72,43 | 0,7123 | 0,2381 | |||
| EMR / Emerson Electric Co. | 0,02 | 17,02 | 2,15 | 42,28 | 0,6789 | 0,1310 | |||
| TMUS / T-Mobile US, Inc. | 0,01 | 19,99 | 2,09 | 7,19 | 0,6598 | −0,0471 | |||
| NEE / NextEra Energy, Inc. | 0,03 | 17,37 | 1,99 | 14,93 | 0,6281 | 0,0005 | |||
| V / Visa Inc. | 0,01 | 32,37 | 1,97 | 34,10 | 0,6243 | 0,0897 | |||
| EQIX / Equinix, Inc. | 0,00 | 10,20 | 1,97 | 7,55 | 0,6220 | −0,0423 | |||
| MA / Mastercard Incorporated | 0,00 | 33,31 | 1,93 | 36,67 | 0,6094 | 0,0974 | |||
| HON / Honeywell International Inc. | 0,01 | 16,21 | 1,91 | 27,85 | 0,6024 | 0,0611 | |||
| ORCL / Oracle Corporation | 0,01 | 33,24 | 1,88 | 108,55 | 0,5941 | 0,2667 | |||
| COST / Costco Wholesale Corporation | 0,00 | 32,04 | 1,78 | 38,14 | 0,5637 | 0,0953 | |||
| AMP / Ameriprise Financial, Inc. | 0,00 | 10,76 | 1,76 | 22,10 | 0,5557 | 0,0331 | |||
| SBUX / Starbucks Corporation | 0,01 | 33,41 | 1,75 | 6,70 | 0,5542 | −0,0420 | |||
| BKNG / Booking Holdings Inc. | 0,00 | 31,72 | 1,73 | 65,55 | 0,5473 | 0,1676 | |||
| LRCX / Lam Research Corporation | 0,02 | 20,28 | 1,73 | 61,10 | 0,5463 | 0,1568 | |||
| LH / Labcorp Holdings Inc. | 0,01 | 8,39 | 1,66 | 22,27 | 0,5242 | 0,0318 | |||
| GLW / Corning Incorporated | 0,03 | 13,61 | 1,62 | 30,52 | 0,5128 | 0,0616 | |||
| BSX / Boston Scientific Corporation | 0,01 | 34,11 | 1,57 | 42,74 | 0,4976 | 0,0974 | |||
| DIS / The Walt Disney Company | 0,01 | 36,36 | 1,57 | 71,35 | 0,4975 | 0,1641 | |||
| EA / Electronic Arts Inc. | 0,01 | 17,60 | 1,55 | 30,00 | 0,4892 | 0,0569 | |||
| QCOM / QUALCOMM Incorporated | 0,01 | 19,49 | 1,52 | 23,84 | 0,4798 | 0,0350 | |||
| KRE / SPDR Series Trust - SPDR S&P Regional Banking ETF | 0,03 | 33,34 | 1,50 | 39,39 | 0,4756 | 0,0835 | |||
| META / Meta Platforms, Inc. | 0,00 | 33,72 | 1,45 | 71,31 | 0,4590 | 0,1512 | |||
| GOOGL / Alphabet Inc. | 0,01 | −0,53 | 1,42 | 13,38 | 0,4474 | −0,0058 | |||
| AMAT / Applied Materials, Inc. | 0,01 | 84,32 | 1,41 | 132,57 | 0,4471 | 0,2263 | |||
| AXON / Axon Enterprise, Inc. | 0,00 | 31,59 | 1,41 | 107,33 | 0,4471 | 0,1992 | |||
| LHX / L3Harris Technologies, Inc. | 0,01 | 17,16 | 1,41 | 40,34 | 0,4457 | 0,0812 | |||
| MRK / Merck & Co., Inc. | 0,02 | 20,57 | 1,39 | 6,37 | 0,4386 | −0,0351 | |||
| PWR / Quanta Services, Inc. | 0,00 | 33,33 | 1,37 | 98,41 | 0,4342 | 0,1828 | |||
| BAC / Bank of America Corporation | 0,03 | −1,35 | 1,35 | 11,84 | 0,4272 | −0,0114 | |||
| CRM / Salesforce, Inc. | 0,00 | 32,62 | 1,32 | 34,80 | 0,4178 | 0,0618 | |||
| WFC / Wells Fargo & Company | 0,02 | −12,45 | 1,31 | −2,31 | 0,4147 | −0,0727 | |||
| DD / DuPont de Nemours, Inc. | 0,02 | 18,38 | 1,31 | 8,80 | 0,4145 | −0,0233 | |||
| DLR / Digital Realty Trust, Inc. | 0,01 | −0,83 | 1,31 | 20,61 | 0,4129 | 0,0199 | |||
| DE / Deere & Company | 0,00 | −10,58 | 1,27 | 0,08 | 0,4020 | −0,0592 | |||
| CMG / Chipotle Mexican Grill, Inc. | 0,02 | 36,72 | 1,21 | 52,78 | 0,3829 | 0,0953 | |||
| CSCO / Cisco Systems, Inc. | 0,02 | 0,00 | 1,21 | 12,41 | 0,3813 | −0,0082 | |||
| J / Jacobs Solutions Inc. | 0,01 | 15,62 | 1,20 | 25,76 | 0,3784 | 0,0328 | |||
| PG / The Procter & Gamble Company | 0,01 | −4,43 | 1,20 | −10,68 | 0,3783 | −0,1079 | |||
| JNK / SPDR Series Trust - SPDR Bloomberg High Yield Bond ETF | 0,01 | −0,10 | 1,17 | 2,01 | 0,3687 | −0,0465 | |||
| XBI / SPDR Series Trust - SPDR S&P Biotech ETF | 0,01 | 18,71 | 1,16 | 21,40 | 0,3678 | 0,0199 | |||
| UNH / UnitedHealth Group Incorporated | 0,00 | 34,18 | 1,14 | −20,10 | 0,3609 | −0,1577 | |||
| RTX / RTX Corporation | 0,01 | −1,61 | 1,14 | 8,48 | 0,3600 | −0,0212 | |||
| BDX / Becton, Dickinson and Company | 0,01 | 17,65 | 1,11 | −11,58 | 0,3503 | −0,1044 | |||
| OKE / ONEOK, Inc. | 0,01 | 83,25 | 1,09 | 50,83 | 0,3455 | 0,0823 | |||
| AME / AMETEK, Inc. | 0,01 | 33,80 | 1,09 | 40,54 | 0,3433 | 0,0630 | |||
| SPGI / S&P Global Inc. | 0,00 | −1,40 | 1,04 | 2,27 | 0,3278 | −0,0401 | |||
| VERSX / Vanguard Emerging Markets Stock Index Fund | 0,02 | −1,29 | 1,03 | 7,94 | 0,3269 | −0,0206 | |||
| AJG / Arthur J. Gallagher & Co. | 0,00 | 34,23 | 1,03 | 24,36 | 0,3247 | 0,0251 | |||
| CVX / Chevron Corporation | 0,01 | −1,69 | 1,02 | −15,90 | 0,3231 | −0,1179 | |||
| BKLN / Invesco Exchange-Traded Fund Trust II - Invesco Senior Loan ETF | 0,05 | 0,00 | 1,00 | 1,01 | 0,3155 | −0,0430 | |||
| KO / The Coca-Cola Company | 0,01 | 0,04 | 1,00 | −1,19 | 0,3147 | −0,0510 | |||
| VTWO / Vanguard Scottsdale Funds - Vanguard Russell 2000 ETF | 0,01 | 7,37 | 0,96 | 16,14 | 0,3049 | 0,0034 | |||
| NKE / NIKE, Inc. | 0,01 | −3,55 | 0,96 | 9,74 | 0,3031 | −0,0139 | |||
| ABBV / AbbVie Inc. | 0,01 | −1,81 | 0,94 | −13,01 | 0,2961 | −0,0948 | |||
| MCD / McDonald's Corporation | 0,00 | −1,47 | 0,92 | −7,84 | 0,2901 | −0,0714 | |||
| AMT / American Tower Corporation | 0,00 | 1,15 | 0,88 | 2,82 | 0,2771 | −0,0326 | |||
| CWEN / Clearway Energy, Inc. | 0,03 | 3,87 | 0,87 | 9,84 | 0,2755 | −0,0126 | |||
| LKQ / LKQ Corporation | 0,02 | 92,53 | 0,87 | 67,44 | 0,2749 | 0,0864 | |||
| EOG / EOG Resources, Inc. | 0,01 | 31,88 | 0,86 | 23,11 | 0,2730 | 0,0181 | |||
| CI / The Cigna Group | 0,00 | −1,77 | 0,83 | −1,31 | 0,2616 | −0,0427 | |||
| VOO / Vanguard Index Funds - Vanguard S&P 500 ETF | 0,00 | 7,78 | 0,83 | 19,19 | 0,2613 | 0,0094 | |||
| TSM / Taiwan Semiconductor Manufacturing Company Limited - Depositary Receipt (Common Stock) | 0,00 | 2,89 | 0,82 | 40,51 | 0,2600 | 0,0473 | |||
| WMB / The Williams Companies, Inc. | 0,01 | −12,30 | 0,82 | −7,76 | 0,2593 | −0,0638 | |||
| NEM / Newmont Corporation | 0,01 | −9,85 | 0,81 | 8,68 | 0,2577 | −0,0143 | |||
| EVRG / Evergy, Inc. | 0,01 | 28,63 | 0,80 | 28,53 | 0,2538 | 0,0272 | |||
| TMO / Thermo Fisher Scientific Inc. | 0,00 | 32,40 | 0,78 | 7,85 | 0,2478 | −0,0160 | |||
| VRTX / Vertex Pharmaceuticals Incorporated | 0,00 | 27,67 | 0,77 | 17,33 | 0,2442 | 0,0050 | |||
| BLV / Vanguard Bond Index Funds - Vanguard Long-Term Bond ETF | 0,01 | 6,75 | 0,77 | 5,49 | 0,2433 | −0,0217 | |||
| LLY / Eli Lilly and Company | 0,00 | 28,26 | 0,77 | 20,98 | 0,2428 | 0,0125 | |||
| EHC / Encompass Health Corporation | 0,01 | −20,71 | 0,76 | −4,06 | 0,2392 | −0,0469 | |||
| FNB / F.N.B. Corporation | 0,05 | −2,17 | 0,74 | 6,00 | 0,2348 | −0,0195 | |||
| WELL / Welltower Inc. | 0,00 | 1,17 | 0,74 | 1,50 | 0,2348 | −0,0308 | |||
| COP / ConocoPhillips | 0,01 | 30,26 | 0,74 | 11,35 | 0,2328 | −0,0074 | |||
| TSLA / Tesla, Inc. | 0,00 | 32,86 | 0,71 | 62,99 | 0,2242 | 0,0661 | |||
| GD / General Dynamics Corporation | 0,00 | −2,16 | 0,70 | 4,79 | 0,2214 | −0,0215 | |||
| NI / NiSource Inc. | 0,02 | 0,17 | 0,70 | 0,72 | 0,2203 | −0,0307 | |||
| CMCSA / Comcast Corporation | 0,02 | 0,21 | 0,69 | −3,10 | 0,2174 | −0,0402 | |||
| CARR / Carrier Global Corporation | 0,01 | −2,12 | 0,68 | 13,00 | 0,2146 | −0,0035 | |||
| DAL / Delta Air Lines, Inc. | 0,01 | 31,16 | 0,68 | 47,92 | 0,2140 | 0,0479 | |||
| NOC / Northrop Grumman Corporation | 0,00 | 29,00 | 0,67 | 25,99 | 0,2117 | 0,0187 | |||
| ITT / ITT Inc. | 0,00 | −2,59 | 0,65 | 18,30 | 0,2067 | 0,0060 | |||
| DOV / Dover Corporation | 0,00 | −0,03 | 0,65 | 4,15 | 0,2067 | −0,0209 | |||
| AEP / American Electric Power Company, Inc. | 0,01 | 0,03 | 0,65 | −4,95 | 0,2065 | −0,0431 | |||
| SYY / Sysco Corporation | 0,01 | 30,32 | 0,64 | 31,56 | 0,2032 | 0,0258 | |||
| SSNC / SS&C Technologies Holdings, Inc. | 0,01 | −0,13 | 0,63 | −1,10 | 0,2000 | −0,0320 | |||
| FNF / Fidelity National Financial, Inc. | 0,01 | −15,24 | 0,60 | −26,95 | 0,1895 | −0,1085 | |||
| VLO / Valero Energy Corporation | 0,00 | 0,21 | 0,59 | 2,09 | 0,1857 | −0,0234 | |||
| HD / The Home Depot, Inc. | 0,00 | 0,00 | 0,58 | 0,00 | 0,1835 | −0,0271 | |||
| REXR / Rexford Industrial Realty, Inc. | 0,02 | 0,24 | 0,58 | −8,86 | 0,1822 | −0,0476 | |||
| MDT / Medtronic plc | 0,01 | −0,06 | 0,57 | −3,07 | 0,1801 | −0,0332 | |||
| BMY / Bristol-Myers Squibb Company | 0,01 | −2,24 | 0,57 | −25,81 | 0,1801 | −0,0986 | |||
| CBRE / CBRE Group, Inc. | 0,00 | 1,26 | 0,51 | 8,60 | 0,1597 | −0,0093 | |||
| PSA / Public Storage | 0,00 | 1,19 | 0,50 | −0,80 | 0,1573 | −0,0248 | |||
| EMN / Eastman Chemical Company | 0,01 | −0,02 | 0,50 | −15,36 | 0,1570 | −0,0558 | |||
| ELV / Elevance Health, Inc. | 0,00 | 0,08 | 0,49 | −10,44 | 0,1547 | −0,0438 | |||
| CXT / Crane NXT, Co. | 0,01 | −3,36 | 0,48 | 1,48 | 0,1518 | −0,0202 | |||
| TIP / iShares Trust - iShares TIPS Bond ETF | 0,00 | 0,00 | 0,46 | −1,07 | 0,1460 | −0,0233 | |||
| COOP / Mr. Cooper Group Inc. | 0,00 | 28,77 | 0,46 | 61,05 | 0,1453 | 0,0414 | |||
| O / Realty Income Corporation | 0,01 | 1,15 | 0,46 | 0,66 | 0,1439 | −0,0206 | |||
| ALB / Albemarle Corporation | 0,01 | 41,07 | 0,45 | 22,70 | 0,1438 | 0,0093 | |||
| GS / The Goldman Sachs Group, Inc. | 0,00 | 31,86 | 0,44 | 71,32 | 0,1399 | 0,0458 | |||
| BWA / BorgWarner Inc. | 0,01 | −3,43 | 0,44 | 13,04 | 0,1398 | −0,0025 | |||
| PFF / iShares Trust - iShares Preferred and Income Securities ETF | 0,01 | 9,98 | 0,44 | 9,75 | 0,1389 | −0,0064 | |||
| TGT / Target Corporation | 0,00 | 0,44 | 0,1376 | 0,1376 | |||||
| OVV / Ovintiv Inc. | 0,01 | 0,00 | 0,42 | −11,13 | 0,1313 | −0,0383 | |||
| EPRT / Essential Properties Realty Trust, Inc. | 0,01 | 15,06 | 0,41 | 12,60 | 0,1300 | −0,0027 | |||
| RF / Regions Financial Corporation | 0,02 | 0,41 | 0,1297 | 0,1297 | |||||
| VONV / Vanguard Scottsdale Funds - Vanguard Russell 1000 Value ETF | 0,00 | 0,41 | 0,1297 | 0,1297 | |||||
| SCHP / Schwab Strategic Trust - Schwab U.S. TIPS ETF | 0,01 | 0,00 | 0,37 | −0,81 | 0,1167 | −0,0184 | |||
| VTR / Ventas, Inc. | 0,01 | 1,17 | 0,32 | −7,06 | 0,1001 | −0,0236 | |||
| ASML / ASML Holding N.V. - Depositary Receipt (Common Stock) | 0,00 | 2,72 | 0,30 | 24,28 | 0,0958 | 0,0072 | |||
| VICI / VICI Properties Inc. | 0,01 | 1,24 | 0,30 | 1,01 | 0,0948 | −0,0128 | |||
| AVB / AvalonBay Communities, Inc. | 0,00 | 1,24 | 0,30 | −4,19 | 0,0942 | −0,0185 | |||
| MPC / Marathon Petroleum Corporation | 0,00 | −56,73 | 0,29 | −50,68 | 0,0922 | −0,1224 | |||
| SPG / Simon Property Group, Inc. | 0,00 | 1,18 | 0,29 | −2,03 | 0,0916 | −0,0158 | |||
| SAP / SAP SE - Depositary Receipt (Common Stock) | 0,00 | 2,72 | 0,29 | 16,67 | 0,0909 | 0,0012 | |||
| MGNI / Magnite, Inc. | 0,01 | 0,27 | 0,0866 | 0,0866 | |||||
| FLR / Fluor Corporation | 0,01 | 0,27 | 0,0841 | 0,0841 | |||||
| DY / Dycom Industries, Inc. | 0,00 | −19,91 | 0,27 | 28,64 | 0,0839 | 0,0089 | |||
| CAT / Caterpillar Inc. | 0,00 | 0,26 | 17,41 | 0,0834 | 0,0020 | ||||
| FN / Fabrinet | 0,00 | 0,26 | 0,0828 | 0,0828 | |||||
| ENSG / The Ensign Group, Inc. | 0,00 | −1,76 | 0,26 | 17,27 | 0,0817 | 0,0016 | |||
| MYRG / MYR Group Inc. | 0,00 | 0,26 | 0,0807 | 0,0807 | |||||
| NPO / Enpro Inc. | 0,00 | 0,25 | 0,0804 | 0,0804 | |||||
| TXN / Texas Instruments Incorporated | 0,00 | 0,25 | 15,35 | 0,0787 | 0,0005 | ||||
| SHEL / Shell plc - Depositary Receipt (Common Stock) | 0,00 | 2,62 | 0,25 | −1,61 | 0,0776 | −0,0128 | |||
| CCI / Crown Castle Inc. | 0,00 | 1,14 | 0,24 | −0,42 | 0,0748 | −0,0114 | |||
| BIV / Vanguard Bond Index Funds - Vanguard Intermediate-Term Bond ETF | 0,00 | 0,00 | 0,23 | 0,88 | 0,0728 | −0,0100 | |||
| AGG / iShares Trust - iShares Core U.S. Aggregate Bond ETF | 0,00 | 0,00 | 0,23 | 0,00 | 0,0721 | −0,0105 | |||
| SONY / Sony Group Corporation - Depositary Receipt (Common Stock) | 0,01 | 2,83 | 0,22 | 5,66 | 0,0710 | −0,0063 | |||
| AZN / AstraZeneca PLC - Depositary Receipt (Common Stock) | 0,00 | 2,93 | 0,22 | −2,19 | 0,0707 | −0,0123 | |||
| ITGR / Integer Holdings Corporation | 0,00 | 0,22 | 0,0700 | 0,0700 | |||||
| BOOT / Boot Barn Holdings, Inc. | 0,00 | 0,22 | 0,0693 | 0,0693 | |||||
| RY / Royal Bank of Canada | 0,00 | 0,22 | 0,0683 | 0,0683 | |||||
| CTRE / CareTrust REIT, Inc. | 0,01 | 0,22 | 0,0682 | 0,0682 | |||||
| NTST / NETSTREIT Corp. | 0,01 | 25,88 | 0,22 | 34,38 | 0,0682 | 0,0100 | |||
| PRGS / Progress Software Corporation | 0,00 | 0,22 | 0,0681 | 0,0681 | |||||
| CRS / Carpenter Technology Corporation | 0,00 | 0,21 | 0,0669 | 0,0669 | |||||
| MAA / Mid-America Apartment Communities, Inc. | 0,00 | 1,29 | 0,21 | −10,73 | 0,0659 | −0,0187 | |||
| TM / Toyota Motor Corporation - Depositary Receipt (Common Stock) | 0,00 | 3,43 | 0,21 | 0,98 | 0,0657 | −0,0090 | |||
| RAMP / LiveRamp Holdings, Inc. | 0,01 | 0,21 | 0,0657 | 0,0657 | |||||
| SUI / Sun Communities, Inc. | 0,00 | 1,30 | 0,21 | −0,48 | 0,0653 | −0,0100 | |||
| GLPI / Gaming and Leisure Properties, Inc. | 0,00 | 1,17 | 0,21 | −7,21 | 0,0653 | −0,0155 | |||
| WY / Weyerhaeuser Company | 0,01 | 1,24 | 0,21 | −11,26 | 0,0650 | −0,0190 | |||
| MUFG / Mitsubishi UFJ Financial Group, Inc. - Depositary Receipt (Common Stock) | 0,01 | 2,53 | 0,20 | 3,13 | 0,0629 | −0,0071 | |||
| DOC / Healthpeak Properties, Inc. | 0,01 | 1,12 | 0,20 | −12,44 | 0,0623 | −0,0194 | |||
| PAYO / Payoneer Global Inc. | 0,03 | −19,21 | 0,17 | −24,23 | 0,0545 | −0,0281 | |||
| BBVA / Banco Bilbao Vizcaya Argentaria, S.A. - Depositary Receipt (Common Stock) | 0,01 | 3,12 | 0,17 | 16,55 | 0,0537 | 0,0007 | |||
| RWT / Redwood Trust, Inc. | 0,03 | 26,75 | 0,17 | 23,70 | 0,0530 | 0,0037 | |||
| CMCO / Columbus McKinnon Corporation | 0,01 | 0,16 | 0,0505 | 0,0505 | |||||
| LYG / Lloyds Banking Group plc - Depositary Receipt (Common Stock) | 0,04 | 3,13 | 0,15 | 14,50 | 0,0476 | −0,0000 | |||
| LBRT / Liberty Energy Inc. | 0,01 | 0,14 | 0,0433 | 0,0433 | |||||
| MFG / Mizuho Financial Group, Inc. - Depositary Receipt (Common Stock) | 0,02 | 2,29 | 0,12 | 3,57 | 0,0367 | −0,0041 | |||
| TALO / Talos Energy Inc. | 0,01 | 0,11 | 0,0363 | 0,0363 | |||||
| PTEN / Patterson-UTI Energy, Inc. | 0,02 | 26,72 | 0,09 | −8,74 | 0,0300 | −0,0077 | |||
| ADEA / Adeia Inc. | 0,00 | −100,00 | 0,00 | 0,0000 | |||||
| AMH / American Homes 4 Rent | 0,00 | −100,00 | 0,00 | 0,0000 | |||||
| GSHD / Goosehead Insurance, Inc | 0,00 | −100,00 | 0,00 | 0,0000 | |||||
| MMSI / Merit Medical Systems, Inc. | 0,00 | −100,00 | 0,00 | 0,0000 | |||||
| LEN / Lennar Corporation | 0,00 | −100,00 | 0,00 | 0,0000 | |||||
| LW / Lamb Weston Holdings, Inc. | 0,00 | −100,00 | 0,00 | 0,0000 | |||||
| GTLS / Chart Industries, Inc. | 0,00 | −100,00 | 0,00 | 0,0000 | |||||
| ATRC / AtriCure, Inc. | 0,00 | −100,00 | 0,00 | 0,0000 |