Grundläggande statistik
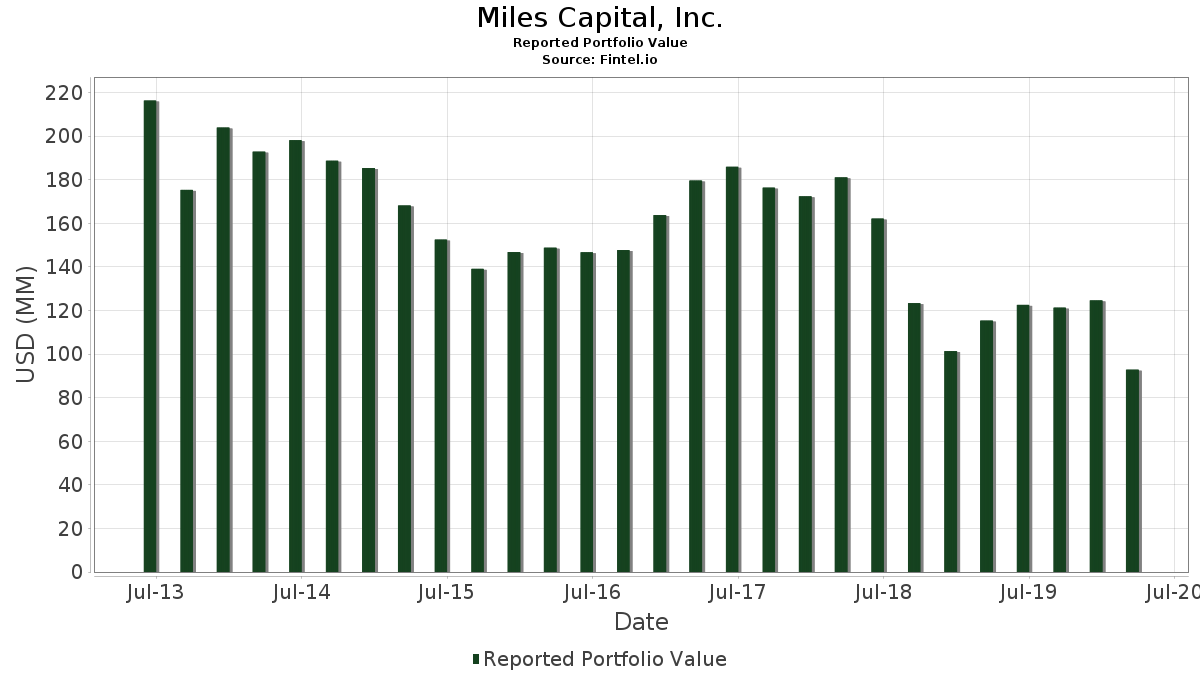
| Portföljvärde | $ 92 826 000 |
| Aktuella positioner | 129 |
Senaste innehav, resultat, förvaltat kapital (från 13F, 13D)
Miles Capital, Inc. har redovisat 129 totala innehav i sina senaste SEC-arkiveringar. Det senaste portföljvärdet beräknas vara $ 92 826 000 USD. Faktiskt förvaltade tillgångar (AUM) är detta värde plus likvida medel (som inte redovisas). Miles Capital, Inc.s största innehav är Vanguard Bond Index Funds - Vanguard Bond Index Fund Total Bond Market Index Fund (US:VBMFX) , iShares Trust - iShares iBoxx $ High Yield Corporate Bond ETF (US:HYG) , Vanguard Tax-Managed Funds - Vanguard FTSE Developed Markets ETF (US:VEA) , Microsoft Corporation (US:MSFT) , and iShares Trust - iShares Russell 2000 ETF (US:IWM) . Miles Capital, Inc.s nya positioner inkluderar Eastman Chemical Company (US:EMN) , QuidelOrtho Corporation (US:QDEL) , Tabula Rasa HealthCare Inc (US:TRHC) , Willscot Corporation Warrants EXP 11/29/2022 (US:US9713751348) , and .
Största ökningarna detta kvartal
Vi använder förändringen i portföljallokeringen eftersom det är det mest meningsfulla måttet. Förändringar kan bero på transaktioner eller förändringar i aktiekurser.
| Värdepapper | Aktier (MM) |
Värde (MM$) |
Portfölj % av | ΔPortfölj % av |
|---|---|---|---|---|
| 0,15 | 4,88 | 5,2593 | 2,9377 | |
| 0,11 | 9,80 | 10,5617 | 2,8643 | |
| 0,12 | 8,94 | 9,6277 | 1,3942 | |
| 0,02 | 2,04 | 2,1966 | 1,3620 | |
| 0,02 | 3,06 | 3,2922 | 1,0115 | |
| 0,01 | 0,70 | 0,7530 | 0,7530 | |
| 0,01 | 0,76 | 0,8133 | 0,6039 | |
| 0,01 | 0,96 | 1,0385 | 0,3756 | |
| 0,04 | 1,80 | 1,9434 | 0,3553 | |
| 0,00 | 1,15 | 1,2346 | 0,3550 |
Största minskningarna detta kvartal
Vi använder förändringen i portföljallokeringen eftersom det är det mest meningsfulla måttet. Förändringar kan bero på transaktioner eller förändringar i aktiepriser.
| Värdepapper | Aktier (MM) |
Värde (MM$) |
Portfölj % av | ΔPortfölj % av |
|---|---|---|---|---|
| 0,00 | 0,00 | −1,1187 | ||
| 0,00 | 0,00 | −0,7254 | ||
| 0,01 | 0,67 | 0,7175 | −0,5673 | |
| 0,02 | 0,14 | 0,1465 | −0,5011 | |
| 0,00 | 0,00 | −0,3972 | ||
| 0,00 | 0,44 | 0,4783 | −0,3057 | |
| 0,03 | 0,34 | 0,3684 | −0,3000 | |
| 0,00 | 0,00 | −0,2993 | ||
| 0,00 | 0,00 | −0,2969 | ||
| 0,00 | 0,00 | −0,2712 |
13F- och fond arkiveringar
Denna blankett lämnades in den 2020-05-13 för rapporteringsperioden 2020-03-31. Klicka på länksymbolen för att se hela transaktionshistoriken.
Uppgradera för att låsa upp premiumdata och exportera till Excel![]() .
.
| Värdepapper | Typ | Genomsnittligt aktiepris | Aktier (MM) |
ΔAktier (%) |
ΔAktier (%) |
Värde ($MM) |
Portfölj (%) |
ΔPortfölj (%) |
|
|---|---|---|---|---|---|---|---|---|---|
| VBMFX / Vanguard Bond Index Funds - Vanguard Bond Index Fund Total Bond Market Index Fund | 0,11 | 0,43 | 9,80 | 2,21 | 10,5617 | 2,8643 | |||
| HYG / iShares Trust - iShares iBoxx $ High Yield Corporate Bond ETF | 0,12 | −0,60 | 8,94 | −12,89 | 9,6277 | 1,3942 | |||
| VEA / Vanguard Tax-Managed Funds - Vanguard FTSE Developed Markets ETF | 0,15 | 123,01 | 4,88 | 68,75 | 5,2593 | 2,9377 | |||
| MSFT / Microsoft Corporation | 0,02 | 7,53 | 3,06 | 7,53 | 3,2922 | 1,0115 | |||
| IWM / iShares Trust - iShares Russell 2000 ETF | 0,02 | 183,77 | 2,04 | 96,06 | 2,1966 | 1,3620 | |||
| AAPL / Apple Inc. | 0,01 | −3,23 | 1,96 | −16,21 | 2,1158 | 0,2348 | |||
| NEE / NextEra Energy, Inc. | 0,01 | −21,94 | 1,89 | −22,43 | 2,0339 | 0,0807 | |||
| MDLZ / Mondelez International, Inc. | 0,04 | 0,26 | 1,80 | −8,84 | 1,9434 | 0,3553 | |||
| PLD / Prologis, Inc. | 0,02 | −0,01 | 1,65 | −9,83 | 1,7786 | 0,3092 | |||
| VYM / Vanguard Whitehall Funds - Vanguard High Dividend Yield ETF | 0,02 | 2,06 | 1,61 | −22,94 | 1,7334 | 0,0578 | |||
| IVV / iShares Trust - iShares Core S&P 500 ETF | 0,01 | −9,50 | 1,53 | −27,67 | 1,6472 | −0,0493 | |||
| VNQ / Vanguard Specialized Funds - Vanguard Real Estate ETF | 0,02 | 4,18 | 1,45 | −21,57 | 1,5588 | 0,0782 | |||
| C.WSA / Citigroup, Inc. | 0,00 | 0,09 | 1,40 | −12,43 | 1,5104 | 0,2256 | |||
| ICE / Intercontinental Exchange, Inc. | 0,02 | −20,53 | 1,31 | −30,66 | 1,4156 | −0,1052 | |||
| DIS / The Walt Disney Company | 0,01 | 33,97 | 1,24 | −10,52 | 1,3380 | 0,2241 | |||
| AMZN / Amazon.com, Inc. | 0,00 | −0,84 | 1,15 | 4,56 | 1,2346 | 0,3550 | |||
| JNK / SPDR Series Trust - SPDR Bloomberg High Yield Bond ETF | 0,01 | −0,07 | 1,10 | −13,60 | 1,1839 | 0,1632 | |||
| CMCSA / Comcast Corporation | 0,03 | 4,49 | 1,09 | −20,12 | 1,1764 | 0,0794 | |||
| TMO / Thermo Fisher Scientific Inc. | 0,00 | 7,24 | 1,05 | −6,33 | 1,1311 | 0,2316 | |||
| HON / Honeywell International Inc. | 0,01 | 7,49 | 1,04 | −18,75 | 1,1204 | 0,0932 | |||
| GILD / Gilead Sciences, Inc. | 0,01 | 1,48 | 0,96 | 16,71 | 1,0385 | 0,3756 | |||
| PM / Philip Morris International Inc. | 0,01 | 9,86 | 0,96 | −5,87 | 1,0374 | 0,2165 | |||
| MPW / Medical Properties Trust, Inc. | 0,05 | −0,43 | 0,84 | −18,45 | 0,9049 | 0,0784 | |||
| MS / Morgan Stanley | 0,02 | 0,54 | 0,83 | −33,15 | 0,8974 | −0,1025 | |||
| CVX / Chevron Corporation | 0,01 | −5,33 | 0,79 | −43,03 | 0,8457 | −0,2602 | |||
| MCD / McDonald's Corporation | 0,00 | −0,04 | 0,77 | −16,36 | 0,8317 | 0,0910 | |||
| AVGO / Broadcom Inc. | 0,00 | −1,03 | 0,77 | −25,77 | 0,8317 | −0,0029 | |||
| EQIX / Equinix, Inc. | 0,00 | 2,42 | 0,77 | 9,59 | 0,8252 | 0,2643 | |||
| CERN / Cerner Corp. | 0,01 | −8,16 | 0,76 | −21,16 | 0,8187 | 0,0451 | |||
| VSBIX / Vanguard Scottsdale Funds - Vanguard Short-Term Treasury Index Fund Institutional Shares | 0,01 | 182,34 | 0,76 | 189,27 | 0,8133 | 0,6039 | |||
| PEP / PepsiCo, Inc. | 0,01 | −1,59 | 0,71 | −13,57 | 0,7616 | 0,1052 | |||
| GOOGL / Alphabet Inc. | 0,00 | −0,33 | 0,70 | −13,53 | 0,7573 | 0,1049 | |||
| TGT / Target Corporation | 0,01 | 0,70 | 0,7530 | 0,7530 | |||||
| PEG / Public Service Enterprise Group Incorporated | 0,02 | −3,55 | 0,68 | −26,59 | 0,7315 | −0,0108 | |||
| HCA / HCA Healthcare, Inc. | 0,01 | −0,61 | 0,67 | −39,57 | 0,7207 | −0,1676 | |||
| COF / Capital One Financial Corporation | 0,01 | −15,08 | 0,67 | −58,40 | 0,7175 | −0,5673 | |||
| MRK / Merck & Co., Inc. | 0,01 | 4,12 | 0,66 | −11,93 | 0,7078 | 0,1091 | |||
| C / Citigroup Inc. - Corporate Bond/Note | 0,02 | 17,64 | 0,65 | −37,98 | 0,6948 | −0,1397 | |||
| TTWO / Take-Two Interactive Software, Inc. | 0,01 | −0,35 | 0,61 | −3,34 | 0,6550 | 0,1502 | |||
| VWO / Vanguard International Equity Index Funds - Vanguard FTSE Emerging Markets ETF | 0,02 | 8,78 | 0,57 | −17,92 | 0,6119 | 0,0566 | |||
| ABT / Abbott Laboratories | 0,01 | 8,31 | 0,56 | −1,74 | 0,6087 | 0,1472 | |||
| AMP / Ameriprise Financial, Inc. | 0,01 | 44,08 | 0,56 | −11,43 | 0,6011 | 0,0956 | |||
| UNH / UnitedHealth Group Incorporated | 0,00 | −4,16 | 0,56 | −18,69 | 0,6000 | 0,0503 | |||
| V / Visa Inc. | 0,00 | 13,72 | 0,54 | −2,52 | 0,5828 | 0,1374 | |||
| INVH / Invitation Homes Inc. | 0,03 | 0,00 | 0,54 | −28,74 | 0,5796 | −0,0263 | |||
| LHX / L3Harris Technologies, Inc. | 0,00 | 5,03 | 0,53 | −4,30 | 0,5753 | 0,1275 | |||
| DAL / Delta Air Lines, Inc. | 0,02 | 10,72 | 0,53 | −45,99 | 0,5731 | −0,2173 | |||
| MA / Mastercard Incorporated | 0,00 | 23,06 | 0,53 | −0,56 | 0,5731 | 0,1438 | |||
| PFE / Pfizer Inc. | 0,02 | −1,23 | 0,53 | −17,70 | 0,5710 | 0,0542 | |||
| XBI / SPDR Series Trust - SPDR S&P Biotech ETF | 0,01 | −0,49 | 0,52 | −19,00 | 0,5602 | 0,0450 | |||
| EHC / Encompass Health Corporation | 0,01 | 3,56 | 0,51 | −4,34 | 0,5462 | 0,1209 | |||
| COST / Costco Wholesale Corporation | 0,00 | 5,15 | 0,51 | 2,02 | 0,5451 | 0,1471 | |||
| LRCX / Lam Research Corporation | 0,00 | −8,67 | 0,50 | −25,04 | 0,5419 | 0,0034 | |||
| HUN / Huntsman Corporation | 0,03 | 36,20 | 0,48 | −18,69 | 0,5203 | 0,0437 | |||
| VZ / Verizon Communications Inc. | 0,01 | −0,08 | 0,45 | −12,55 | 0,4880 | 0,0723 | |||
| CRM / Salesforce, Inc. | 0,00 | −7,15 | 0,45 | −17,77 | 0,4837 | 0,0455 | |||
| SYF / Synchrony Financial | 0,03 | 11,10 | 0,45 | −50,33 | 0,4805 | −0,2402 | |||
| META / Meta Platforms, Inc. | 0,00 | −44,12 | 0,44 | −54,55 | 0,4783 | −0,3057 | |||
| ANTM / Anthem Inc | 0,00 | 2,48 | 0,44 | −23,04 | 0,4751 | 0,0153 | |||
| EMR / Emerson Electric Co. | 0,01 | −0,58 | 0,43 | −37,84 | 0,4654 | −0,0923 | |||
| GM / General Motors Company | 0,02 | 41,13 | 0,43 | −19,74 | 0,4600 | 0,0331 | |||
| WMB / The Williams Companies, Inc. | 0,03 | 1,89 | 0,42 | −39,19 | 0,4514 | −0,1015 | |||
| FNF / Fidelity National Financial, Inc. | 0,02 | 0,56 | 0,42 | −44,91 | 0,4492 | −0,1583 | |||
| CFG / Citizens Financial Group, Inc. | 0,02 | 25,32 | 0,41 | −41,96 | 0,4395 | −0,1246 | |||
| VRTX / Vertex Pharmaceuticals Incorporated | 0,00 | 25,25 | 0,39 | 35,86 | 0,4245 | 0,1917 | |||
| CSCO / Cisco Systems, Inc. | 0,01 | 2,03 | 0,39 | −16,38 | 0,4180 | 0,0456 | |||
| TKR / The Timken Company | 0,01 | −0,03 | 0,38 | −42,57 | 0,4040 | −0,1200 | |||
| RTN / Raytheon Co. | 0,00 | −0,69 | 0,38 | −40,76 | 0,4040 | −0,1040 | |||
| FAF / First American Financial Corporation | 0,01 | 0,08 | 0,37 | −27,17 | 0,3986 | −0,0091 | |||
| VLO / Valero Energy Corporation | 0,01 | 0,39 | 0,36 | −51,40 | 0,3932 | −0,2095 | |||
| DEA / Easterly Government Properties, Inc. | 0,01 | −0,04 | 0,36 | 3,76 | 0,3867 | 0,1091 | |||
| GOOG / Alphabet Inc. | 0,00 | 4,04 | 0,36 | −9,57 | 0,3867 | 0,0682 | |||
| BSX / Boston Scientific Corporation | 0,01 | 56,54 | 0,35 | 12,86 | 0,3781 | 0,1286 | |||
| TMUS / T-Mobile US, Inc. | 0,00 | 16,99 | 0,35 | 25,09 | 0,3760 | 0,1521 | |||
| STWD / Starwood Property Trust, Inc. | 0,03 | −0,33 | 0,34 | −58,94 | 0,3684 | −0,3000 | |||
| ADC / Agree Realty Corporation | 0,01 | −26,28 | 0,33 | −34,97 | 0,3566 | −0,0519 | |||
| TIP / iShares Trust - iShares TIPS Bond ETF | 0,00 | 0,00 | 0,33 | 1,23 | 0,3555 | 0,0939 | |||
| QTS / Qts Realty Trust Inc - Class A | 0,01 | −0,25 | 0,32 | 6,62 | 0,3469 | 0,1045 | |||
| EMN / Eastman Chemical Company | 0,01 | 0,32 | 0,3447 | 0,3447 | |||||
| FNB / F.N.B. Corporation | 0,04 | 15,64 | 0,31 | −32,90 | 0,3361 | −0,0370 | |||
| EHTH / eHealth, Inc. | 0,00 | −0,41 | 0,31 | 45,75 | 0,3329 | 0,3329 | |||
| AMT / American Tower Corporation | 0,00 | 0,00 | 0,31 | −5,21 | 0,3329 | 0,0713 | |||
| VST / Vistra Corp. | 0,02 | 0,23 | 0,30 | −30,52 | 0,3286 | −0,0237 | |||
| PRU / Prudential Financial, Inc. | 0,01 | −0,14 | 0,29 | −44,44 | 0,3178 | −0,1083 | |||
| AMAT / Applied Materials, Inc. | 0,01 | 33,14 | 0,29 | 0,00 | 0,3103 | 0,0791 | |||
| DHR / Danaher Corporation | 0,00 | 6,15 | 0,29 | −4,01 | 0,3092 | 0,0692 | |||
| LHCG / LHC Group Inc | 0,00 | −0,10 | 0,29 | 1,78 | 0,3081 | 0,0826 | |||
| HUM / Humana Inc. | 0,00 | 38,46 | 0,27 | 18,34 | 0,2919 | 0,1082 | |||
| ALLY / Ally Financial Inc. | 0,02 | −0,60 | 0,27 | −53,03 | 0,2919 | −0,1711 | |||
| NEO / NeoGenomics, Inc. | 0,01 | −0,44 | 0,26 | −5,78 | 0,2812 | 0,0589 | |||
| AME / AMETEK, Inc. | 0,00 | 0,67 | 0,26 | −27,37 | 0,2801 | −0,0072 | |||
| KEYS / Keysight Technologies, Inc. | 0,00 | 4,46 | 0,26 | −14,80 | 0,2790 | 0,0351 | |||
| NVS / Novartis AG - Depositary Receipt (Common Stock) | 0,00 | −4,95 | 0,26 | −17,31 | 0,2779 | 0,0276 | |||
| QDEL / QuidelOrtho Corporation | 0,00 | 0,25 | 0,2736 | 0,2736 | |||||
| MDT / Medtronic plc | 0,00 | 15,23 | 0,25 | −8,30 | 0,2736 | 0,0513 | |||
| FN / Fabrinet | 0,00 | 0,09 | 0,25 | −15,67 | 0,2726 | 0,0318 | |||
| STZ / Constellation Brands, Inc. | 0,00 | 1,53 | 0,25 | −23,05 | 0,2661 | 0,0085 | |||
| SRE / Sempra | 0,00 | 0,75 | 0,24 | −24,92 | 0,2629 | 0,0020 | |||
| J / Jacobs Solutions Inc. | 0,00 | 1,07 | 0,24 | −11,11 | 0,2585 | 0,0419 | |||
| DOW / Dow Inc. | 0,01 | 62,03 | 0,23 | 0,86 | 0,2521 | 0,0659 | |||
| FE / FirstEnergy Corp. | 0,01 | 7,26 | 0,23 | −11,36 | 0,2521 | 0,0402 | |||
| HD / The Home Depot, Inc. | 0,00 | 5,74 | 0,23 | −9,65 | 0,2521 | 0,0442 | |||
| ACA / Arcosa, Inc. | 0,01 | −0,27 | 0,23 | −10,77 | 0,2499 | 0,0413 | |||
| LMT / Lockheed Martin Corporation | 0,00 | 11,35 | 0,23 | −3,38 | 0,2467 | 0,0565 | |||
| TSM / Taiwan Semiconductor Manufacturing Company Limited - Depositary Receipt (Common Stock) | 0,00 | −17,99 | 0,23 | −32,64 | 0,2445 | −0,0259 | |||
| PWR / Quanta Services, Inc. | 0,01 | 0,45 | 0,22 | −21,83 | 0,2392 | 0,0113 | |||
| GLPI / Gaming and Leisure Properties, Inc. | 0,01 | 1,88 | 0,22 | −34,42 | 0,2381 | 0,2381 | |||
| VICI / VICI Properties Inc. | 0,01 | 3,48 | 0,22 | −32,72 | 0,2370 | −0,0254 | |||
| JPM / JPMorgan Chase & Co. | 0,00 | 3,28 | 0,22 | −33,23 | 0,2359 | −0,0273 | |||
| SNY / Sanofi - Depositary Receipt (Common Stock) | 0,00 | 1,89 | 0,22 | −11,07 | 0,2338 | 0,0380 | |||
| PFF / iShares Trust - iShares Preferred and Income Securities ETF | 0,01 | 0,00 | 0,21 | −15,42 | 0,2305 | 0,0275 | |||
| FMC / FMC Corporation | 0,00 | 0,62 | 0,21 | −17,69 | 0,2305 | 0,0219 | |||
| HUBB / Hubbell Incorporated | 0,00 | 5,94 | 0,21 | −17,72 | 0,2252 | 0,0213 | |||
| DAR / Darling Ingredients Inc. | 0,01 | −42,79 | 0,21 | −60,93 | 0,2252 | −0,2042 | |||
| MPC / Marathon Petroleum Corporation | 0,01 | 14,55 | 0,21 | −55,10 | 0,2230 | −0,1469 | |||
| AIG / American International Group, Inc. | 0,01 | 1,95 | 0,21 | −51,75 | 0,2230 | −0,1213 | |||
| TRHC / Tabula Rasa HealthCare Inc | 0,00 | 0,21 | 0,2230 | 0,2230 | |||||
| AHH / Armada Hoffler Properties, Inc. | 0,02 | −0,07 | 0,20 | −41,81 | 0,2144 | −0,0601 | |||
| CTRE / CareTrust REIT, Inc. | 0,01 | −0,49 | 0,19 | −28,68 | 0,2090 | −0,0093 | |||
| US30224P2002 / Extended Stay America Inc | 0,02 | 1,97 | 0,18 | −49,86 | 0,1896 | −0,0921 | |||
| UCTT / Ultra Clean Holdings, Inc. | 0,01 | −0,21 | 0,14 | −41,32 | 0,1530 | −0,0412 | |||
| TRGP / Targa Resources Corp. | 0,02 | −0,46 | 0,14 | −83,15 | 0,1465 | −0,5011 | |||
| TWO / Two Harbors Investment Corp. | 0,03 | 4,31 | 0,13 | −72,90 | 0,1357 | −0,2374 | |||
| OFG / OFG Bancorp | 0,01 | 0,25 | 0,12 | −52,71 | 0,1314 | −0,0756 | |||
| EAGLW / Double Eagle Acquisition Corp. | 0,01 | 0,11 | 0,1153 | 0,1153 | |||||
| MUFG / Mitsubishi UFJ Financial Group, Inc. - Depositary Receipt (Common Stock) | 0,03 | 1,51 | 0,10 | −31,47 | 0,1056 | −0,0092 | |||
| SMFG / Sumitomo Mitsui Financial Group, Inc. - Depositary Receipt (Common Stock) | 0,02 | 1,51 | 0,09 | −34,51 | 0,1002 | −0,0138 | |||
| QNST / QuinStreet, Inc. | 0,01 | −0,33 | 0,09 | −47,59 | 0,0937 | 0,0937 | |||
| ITUB / Itaú Unibanco Holding S.A. - Depositary Receipt (Common Stock) | 0,01 | 1,51 | 0,05 | −49,48 | 0,0528 | −0,0251 | |||
| APD / Air Products and Chemicals, Inc. | 0,00 | −100,00 | 0,00 | −100,00 | −1,1187 | ||||
| NVDA / NVIDIA Corporation | 0,00 | −100,00 | 0,00 | −100,00 | −0,2327 | ||||
| BYD / Boyd Gaming Corporation | 0,00 | −100,00 | 0,00 | −100,00 | −0,1982 | ||||
| HIG / The Hartford Insurance Group, Inc. | 0,00 | −100,00 | 0,00 | −100,00 | −0,1701 | ||||
| SPSC / SPS Commerce, Inc. | 0,00 | −100,00 | 0,00 | 0,0000 | 0,0000 | ||||
| VBTX / Veritex Holdings, Inc. | 0,00 | −100,00 | 0,00 | 0,0000 | 0,0000 | ||||
| WD / Walker & Dunlop, Inc. | 0,00 | −100,00 | 0,00 | 0,0000 | 0,0000 | ||||
| ADUS / Addus HomeCare Corporation | 0,00 | −100,00 | 0,00 | 0,0000 | 0,0000 | ||||
| CARG / CarGurus, Inc. | 0,00 | −100,00 | 0,00 | 0,0000 | 0,0000 | ||||
| ROCK / Gibraltar Industries, Inc. | 0,00 | −100,00 | 0,00 | −100,00 | −0,1782 | ||||
| TD / The Toronto-Dominion Bank | 0,00 | −100,00 | 0,00 | −100,00 | −0,1798 | ||||
| VCSH / Vanguard Scottsdale Funds - Vanguard Short-Term Corporate Bond ETF | 0,00 | −100,00 | 0,00 | −100,00 | −0,2969 | ||||
| US0153511094 / Alexion Pharmaceuticals, Inc. | 0,00 | −100,00 | 0,00 | −100,00 | −0,1749 | ||||
| SKYW / SkyWest, Inc. | 0,00 | −100,00 | 0,00 | −100,00 | −0,2255 | ||||
| FANG / Diamondback Energy, Inc. | 0,00 | −100,00 | 0,00 | −100,00 | −0,2143 | ||||
| FLT / Corpay, Inc. | 0,00 | −100,00 | 0,00 | −100,00 | −0,2568 | ||||
| UFPI / UFP Industries, Inc. | 0,00 | −100,00 | 0,00 | −100,00 | −0,2070 | ||||
| RIO / Rio Tinto Group - Depositary Receipt (Common Stock) | 0,00 | −100,00 | 0,00 | −100,00 | −0,1741 | ||||
| LCII / LCI Industries | 0,00 | −100,00 | 0,00 | −100,00 | −0,2215 | ||||
| PRFT / Perficient, Inc. | 0,00 | −100,00 | 0,00 | −100,00 | −0,1990 | ||||
| SMPL / The Simply Good Foods Company | 0,00 | −100,00 | 0,00 | 0,0000 | 0,0000 | ||||
| US2296691064 / Cubic Corporation | 0,00 | −100,00 | 0,00 | −100,00 | −0,2656 | ||||
| ASMLF / ASML Holding N.V. | 0,00 | −100,00 | 0,00 | 0,0000 | 0,0000 | ||||
| TSN / Tyson Foods, Inc. | 0,00 | −100,00 | 0,00 | −100,00 | −0,1733 | ||||
| ARE / Alexandria Real Estate Equities, Inc. | 0,00 | −100,00 | 0,00 | −100,00 | −0,1757 | ||||
| NR / NPK International Inc. | 0,00 | −100,00 | 0,00 | −100,00 | −0,0827 | ||||
| NCLH / Norwegian Cruise Line Holdings Ltd. | 0,00 | −100,00 | 0,00 | −100,00 | −0,2303 | ||||
| LPSN / LivePerson, Inc. | 0,00 | −100,00 | 0,00 | −100,00 | −0,1693 | ||||
| BOOT / Boot Barn Holdings, Inc. | 0,00 | −100,00 | 0,00 | −100,00 | −0,2199 | ||||
| MPWR / Monolithic Power Systems, Inc. | 0,00 | −100,00 | 0,00 | −100,00 | −0,1733 | ||||
| AXON / Axon Enterprise, Inc. | 0,00 | −100,00 | 0,00 | −100,00 | −0,2103 | ||||
| / Virtusa Corp. | 0,00 | −100,00 | 0,00 | −100,00 | −0,2151 | ||||
| SJI / South Jersey Industries Inc. | 0,00 | −100,00 | 0,00 | −100,00 | −0,2030 | ||||
| ENSG / The Ensign Group, Inc. | 0,00 | −100,00 | 0,00 | −100,00 | −0,2712 | ||||
| ESNT / Essent Group Ltd. | 0,00 | −100,00 | 0,00 | −100,00 | −0,1798 | ||||
| TCMD / Tactile Systems Technology, Inc. | 0,00 | −100,00 | 0,00 | −100,00 | −0,2359 | ||||
| RDS.A / Shell Plc - ADR (Representing Ordinary Shares - Class A) | 0,00 | −100,00 | 0,00 | −100,00 | −0,1830 | ||||
| NGVT / Ingevity Corporation | 0,00 | −100,00 | 0,00 | −100,00 | −0,2399 | ||||
| ASGN / ASGN Incorporated | 0,00 | −100,00 | 0,00 | −100,00 | −0,2544 | ||||
| / Total S.A. | 0,00 | −100,00 | 0,00 | −100,00 | −0,2295 | ||||
| SPG / Simon Property Group, Inc. | 0,00 | −100,00 | 0,00 | −100,00 | −0,2006 | ||||
| ITRI / Itron, Inc. | 0,00 | −100,00 | 0,00 | −100,00 | −0,1942 | ||||
| LAD / Lithia Motors, Inc. | 0,00 | −100,00 | 0,00 | −100,00 | −0,1822 | ||||
| EOG / EOG Resources, Inc. | 0,00 | −100,00 | 0,00 | −100,00 | −0,1733 | ||||
| NMIH / NMI Holdings, Inc. | 0,00 | −100,00 | 0,00 | −100,00 | −0,1798 | ||||
| LVS / Las Vegas Sands Corp. | 0,00 | −100,00 | 0,00 | −100,00 | −0,1661 | ||||
| BAC / Bank of America Corporation | 0,00 | −100,00 | 0,00 | −100,00 | −0,7254 | ||||
| SMTC / Semtech Corporation | 0,00 | −100,00 | 0,00 | −100,00 | −0,2127 | ||||
| HAS / Hasbro, Inc. | 0,00 | −100,00 | 0,00 | −100,00 | −0,2993 | ||||
| NPO / Enpro Inc. | 0,00 | −100,00 | 0,00 | −100,00 | −0,1862 | ||||
| GVI / iShares Trust - iShares Intermediate Government/Credit Bond ETF | 0,00 | −100,00 | 0,00 | −100,00 | −0,3972 | ||||
| SAP / SAP SE - Depositary Receipt (Common Stock) | 0,00 | −100,00 | 0,00 | −100,00 | −0,1806 | ||||
| BP / BP p.l.c. - Depositary Receipt (Common Stock) | 0,00 | −100,00 | 0,00 | −100,00 | −0,1790 | ||||
| AROC / Archrock, Inc. | 0,00 | −100,00 | 0,00 | −100,00 | −0,1140 | ||||
| LKQ / LKQ Corporation | 0,00 | −100,00 | 0,00 | −100,00 | −0,2207 | ||||
| ADM / Archer-Daniels-Midland Company | 0,00 | −100,00 | 0,00 | −100,00 | −0,1902 | ||||
| GMS / GMS Inc. | 0,00 | −100,00 | 0,00 | 0,0000 | 0,0000 | ||||
| ABCB / Ameris Bancorp | 0,00 | −100,00 | 0,00 | 0,0000 | 0,0000 | ||||
| BDX / Becton, Dickinson and Company | 0,00 | −100,00 | 0,00 | −100,00 | −0,1725 | ||||
| KOP / Koppers Holdings Inc. | 0,00 | −100,00 | 0,00 | 0,0000 | 0,0000 | ||||
| AIR / AAR Corp. | 0,00 | −100,00 | 0,00 | 0,0000 | 0,0000 | ||||
| SONY / Sony Group Corporation - Depositary Receipt (Common Stock) | 0,00 | −100,00 | 0,00 | −100,00 | −0,2127 |