Grundläggande statistik
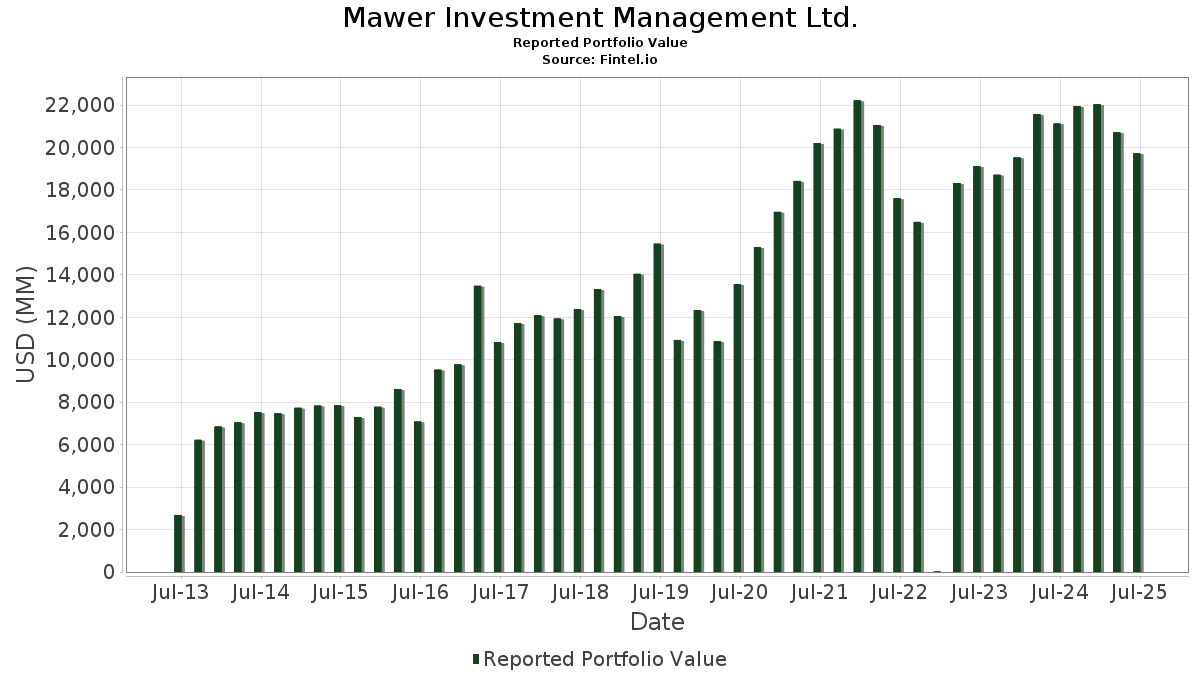
| Portföljvärde | $ 19 720 245 014 |
| Aktuella positioner | 110 |
Senaste innehav, resultat, förvaltat kapital (från 13F, 13D)
Mawer Investment Management Ltd. har redovisat 110 totala innehav i sina senaste SEC-arkiveringar. Det senaste portföljvärdet beräknas vara $ 19 720 245 014 USD. Faktiskt förvaltade tillgångar (AUM) är detta värde plus likvida medel (som inte redovisas). Mawer Investment Management Ltd.s största innehav är Microsoft Corporation (US:MSFT) , Marsh & McLennan Companies, Inc. (US:MMC) , Aon plc (US:AON) , Alphabet Inc. (US:GOOG) , and Booking Holdings Inc. (US:BKNG) . Mawer Investment Management Ltd.s nya positioner inkluderar Northrop Grumman Corporation (US:NOC) , AerCap Holdings N.V. (US:AER) , Elevance Health, Inc. (US:ELV) , Sprott Inc. (US:SII) , and Zoetis Inc. (US:ZTS) . Mawer Investment Management Ltd.s främsta industrier är "Printing, Publishing, And Allied Industries" (sic 27) , "Miscellaneous Retail " (sic 59) , and "Apparel And Accessory Stores" (sic 56) .
Största ökningarna detta kvartal
Vi använder förändringen i portföljallokeringen eftersom det är det mest meningsfulla måttet. Förändringar kan bero på transaktioner eller förändringar i aktiekurser.
| Värdepapper | Aktier (MM) |
Värde (MM$) |
Portfölj % av | ΔPortfölj % av |
|---|---|---|---|---|
| 0,74 | 543,16 | 2,7522 | 2,7522 | |
| 0,98 | 491,98 | 2,4948 | 2,4948 | |
| 2,87 | 1 428,97 | 7,2462 | 1,6938 | |
| 1,24 | 360,06 | 1,8258 | 1,3141 | |
| 1,55 | 181,38 | 0,9197 | 0,9197 | |
| 7,43 | 733,53 | 3,7197 | 0,9116 | |
| 0,16 | 919,34 | 4,6619 | 0,8969 | |
| 3,97 | 870,93 | 4,4130 | 0,8023 | |
| 0,00 | 591,06 | 2,9949 | 0,3577 | |
| 2,68 | 101,45 | 0,5144 | 0,3086 |
Största minskningarna detta kvartal
Vi använder förändringen i portföljallokeringen eftersom det är det mest meningsfulla måttet. Förändringar kan bero på transaktioner eller förändringar i aktiepriser.
| Värdepapper | Aktier (MM) |
Värde (MM$) |
Portfölj % av | ΔPortfölj % av |
|---|---|---|---|---|
| 1,06 | 330,49 | 1,6746 | −3,5705 | |
| 3,94 | 161,83 | 0,8200 | −1,2360 | |
| 5,37 | 1 175,16 | 5,9592 | −1,0782 | |
| 0,10 | 31,64 | 0,1604 | −0,9771 | |
| 2,97 | 1 060,12 | 5,3758 | −0,9328 | |
| 4,84 | 290,99 | 1,4745 | −0,7241 | |
| 0,82 | 270,93 | 1,3739 | −0,3660 | |
| 0,89 | 162,51 | 0,8241 | −0,3129 | |
| 0,27 | 38,69 | 0,1960 | −0,2907 | |
| 2,11 | 750,54 | 3,8030 | −0,2823 |
13D/G-arkiveringar
Detta är en lista över 13D- och 13G-arkiveringar som gjorts under det senaste året (om några). Klicka på länken för att se hela transaktionshistoriken. Gröna rader indikerar nya positioner. Röda rader indikerar stängda positioner.
| Fil Datum | Formulär | Värdepapper | Föregående aktier |
Aktuella aktier |
ΔAktier % | % Ägande |
% ΔÄgande | |
|---|---|---|---|---|---|---|---|---|
| 2025-09-04 | NSP / Insperity, Inc. | 5 190 036 | 2 726 579 | −47,47 | 7,24 | −47,65 | ||
| 2025-08-07 | XP / XP Inc. | 24 589 426 | 0 | −100,00 | 0,00 | −100,00 | ||
| 2025-08-07 | RHI / Robert Half Inc. | 8 079 597 | 3 942 158 | −51,21 | 3,86 | −50,70 | ||
| 2025-06-06 | SANG / Sangoma Technologies Corporation | 3 125 660 | 3 490 247 | 11,66 | 10,42 | 12,04 | ||
| 2025-05-09 | DFIN / Donnelley Financial Solutions, Inc. | 2 021 103 | 1 332 775 | −34,06 | 4,67 | −32,90 | ||
| 2025-05-09 | ESQ / Esquire Financial Holdings, Inc. | 420 212 | 779 889 | 85,59 | 9,25 | 83,17 | ||
| 2025-05-09 | TNET / TriNet Group, Inc. | 3 653 597 | 3 004 110 | −17,78 | 6,21 | −15,63 | ||
| 2025-05-09 | NOA / North American Construction Group Ltd. | 3 106 914 | 2 678 487 | −13,79 | 8,72 | −21,86 | ||
| 2025-02-12 | BBSI / Barrett Business Services, Inc. | 1 834 452 | 2 110 550 | 15,05 | 8,14 | 15,95 | ||
| 2024-11-12 | TIXT / TELUS International (Cda) Inc. | 6 449 296 | 0 | −100,00 | 0,00 | −100,00 | ||
| 2024-11-08 | BNT / Brookfield Wealth Solutions Ltd. | 1 317 978 | 3,04 | |||||
| 2024-11-08 | GIC / Global Industrial Company | 1 939 649 | 1 826 970 | −5,81 | 4,78 | −6,27 | ||
| 2024-11-08 | WINA / Winmark Corporation | 276 571 | 90 273 | −67,36 | 2,56 | −67,72 | ||
| 2024-11-08 | WMG / Warner Music Group Corp. | 8 217 467 | 5,80 |
13F- och fond arkiveringar
Denna blankett lämnades in den 2025-08-07 för rapporteringsperioden 2025-06-30. Klicka på länksymbolen för att se hela transaktionshistoriken.
Uppgradera för att låsa upp premiumdata och exportera till Excel![]() .
.
| Värdepapper | Typ | Genomsnittligt aktiepris | Aktier (MM) |
ΔAktier (%) |
ΔAktier (%) |
Värde ($MM) |
Portfölj (%) |
ΔPortfölj (%) |
|
|---|---|---|---|---|---|---|---|---|---|
| MSFT / Microsoft Corporation | 2,87 | −6,21 | 1 428,97 | 24,27 | 7,2462 | 1,6938 | |||
| MMC / Marsh & McLennan Companies, Inc. | 5,37 | −10,00 | 1 175,16 | −19,36 | 5,9592 | −1,0782 | |||
| AON / Aon plc | 2,97 | −9,23 | 1 060,12 | −18,85 | 5,3758 | −0,9328 | |||
| GOOG / Alphabet Inc. | 5,21 | −14,31 | 923,67 | −2,70 | 4,6839 | 0,0998 | |||
| BKNG / Booking Holdings Inc. | 0,16 | −6,17 | 919,34 | 17,91 | 4,6619 | 0,8969 | |||
| AMZN / Amazon.com, Inc. | 3,97 | 1,01 | 870,93 | 16,47 | 4,4130 | 0,8023 | |||
| V / Visa Inc. | 2,11 | −12,43 | 750,54 | −11,29 | 3,8030 | −0,2823 | |||
| APH / Amphenol Corporation | 7,43 | −16,22 | 733,53 | 26,14 | 3,7197 | 0,9116 | |||
| FCN / FTI Consulting, Inc. | 3,82 | −3,92 | 616,31 | −5,44 | 3,1229 | −0,0242 | |||
| BRK.A / Berkshire Hathaway Inc. | 0,00 | 18,57 | 591,06 | 8,23 | 2,9949 | 0,3577 | |||
| META / Meta Platforms, Inc. | 0,74 | 543,16 | 2,7522 | 2,7522 | |||||
| NOC / Northrop Grumman Corporation | 0,98 | 491,98 | 2,4948 | 2,4948 | |||||
| CDW / CDW Corporation | 2,64 | −6,60 | 471,90 | 4,09 | 2,3930 | 0,2037 | |||
| JPM / JPMorgan Chase & Co. | 1,24 | 187,50 | 360,06 | 239,78 | 1,8258 | 1,3141 | |||
| UNH / UnitedHealth Group Incorporated | 1,06 | −48,92 | 330,49 | −69,57 | 1,6746 | −3,5705 | |||
| SHEL / Shell plc - Depositary Receipt (Common Stock) | 4,59 | −6,88 | 323,22 | −10,53 | 1,6378 | −0,1066 | |||
| LULU / lululemon athletica inc. | 1,36 | 2,77 | 322,98 | −13,74 | 1,6365 | −0,1715 | |||
| NSP / Insperity, Inc. | 4,84 | −5,14 | 290,99 | −36,09 | 1,4745 | −0,7241 | |||
| DE / Deere & Company | 0,56 | −6,49 | 284,46 | 1,31 | 1,4414 | 0,0855 | |||
| CPAY / Corpay, Inc. | 0,82 | −20,98 | 270,93 | −24,81 | 1,3739 | −0,3660 | |||
| MEDP / Medpace Holdings, Inc. | 0,82 | 17,41 | 256,56 | 20,94 | 1,3010 | 0,2767 | |||
| ATR / AptarGroup, Inc. | 1,40 | 16,39 | 219,12 | 22,70 | 1,1111 | 0,2488 | |||
| AJG / Arthur J. Gallagher & Co. | 0,68 | −7,82 | 218,16 | −14,53 | 1,1063 | −0,1262 | |||
| TNET / TriNet Group, Inc. | 2,81 | −6,58 | 205,27 | −13,77 | 1,0401 | −0,1093 | |||
| FERG / Ferguson Enterprises Inc. | 0,93 | −6,86 | 202,14 | 26,58 | 1,0243 | 0,2531 | |||
| COR / Cencora, Inc. | 0,67 | −2,07 | 201,38 | 5,59 | 1,0204 | 0,0995 | |||
| WMG / Warner Music Group Corp. | 7,37 | −6,48 | 200,84 | −18,74 | 1,0177 | −0,1758 | |||
| CME / CME Group Inc. | 0,73 | −16,76 | 199,87 | −13,52 | 1,0128 | −0,1033 | |||
| TME / Tencent Music Entertainment Group - Depositary Receipt (Common Stock) | 10,15 | −7,63 | 197,74 | 24,93 | 1,0027 | 0,2384 | |||
| ACN / Accenture plc | 0,65 | −14,10 | 194,81 | −17,72 | 0,9879 | −0,1555 | |||
| VZ / Verizon Communications Inc. | 4,28 | −9,03 | 185,10 | −13,22 | 0,9379 | −0,0920 | |||
| AER / AerCap Holdings N.V. | 1,55 | 181,38 | 0,9197 | 0,9197 | |||||
| YUMC / Yum China Holdings, Inc. | 3,77 | −6,78 | 168,55 | −19,94 | 0,8541 | −0,1626 | |||
| WAT / Waters Corporation | 0,48 | −7,20 | 166,34 | −12,11 | 0,8428 | −0,0711 | |||
| ICE / Intercontinental Exchange, Inc. | 0,89 | −35,11 | 162,51 | −30,98 | 0,8241 | −0,3129 | |||
| RHI / Robert Half Inc. | 3,94 | −49,49 | 161,83 | −61,99 | 0,8200 | −1,2360 | |||
| ABT / Abbott Laboratories | 1,19 | −9,58 | 161,26 | −7,29 | 0,8171 | −0,0228 | |||
| MA / Mastercard Incorporated | 0,28 | −8,49 | 158,51 | −6,18 | 0,8038 | −0,0121 | |||
| PG / The Procter & Gamble Company | 0,99 | −9,29 | 158,18 | −15,19 | 0,8021 | −0,0985 | |||
| MLM / Martin Marietta Materials, Inc. | 0,29 | −1,30 | 157,40 | 13,32 | 0,7975 | 0,1268 | |||
| POOL / Pool Corporation | 0,50 | −5,98 | 145,26 | −13,91 | 0,7366 | −0,0782 | |||
| BWXT / BWX Technologies, Inc. | 0,90 | 15,60 | 129,72 | 68,81 | 0,6573 | 0,2862 | |||
| CACI / CACI International Inc | 0,27 | −7,34 | 127,02 | 20,38 | 0,6436 | 0,1341 | |||
| OSIS / OSI Systems, Inc. | 0,51 | 11,20 | 115,28 | 28,66 | 0,5841 | 0,1515 | |||
| AEP / American Electric Power Company, Inc. | 1,09 | −6,54 | 112,98 | −11,26 | 0,5729 | −0,0418 | |||
| VRSK / Verisk Analytics, Inc. | 0,36 | −13,61 | 110,67 | −9,59 | 0,5612 | −0,0299 | |||
| HDB / HDFC Bank Limited - Depositary Receipt (Common Stock) | 1,41 | 2,82 | 107,95 | 18,66 | 0,5474 | 0,1081 | |||
| VVV / Valvoline Inc. | 2,68 | 118,79 | 101,45 | 138,02 | 0,5144 | 0,3086 | |||
| SHW / The Sherwin-Williams Company | 0,27 | −9,77 | 93,83 | −11,28 | 0,4758 | −0,0349 | |||
| NKE / NIKE, Inc. | 1,21 | −12,32 | 85,92 | −1,88 | 0,4353 | 0,0125 | |||
| BBSI / Barrett Business Services, Inc. | 1,95 | −0,67 | 81,30 | 0,64 | 0,4123 | 0,0222 | |||
| DHR / Danaher Corporation | 0,40 | −7,76 | 79,19 | −11,12 | 0,4013 | −0,0290 | |||
| TXN / Texas Instruments Incorporated | 0,37 | 17,64 | 76,86 | 35,92 | 0,3894 | 0,1164 | |||
| SO / The Southern Company | 0,84 | −5,56 | 76,81 | −5,68 | 0,3892 | −0,0040 | |||
| BDX / Becton, Dickinson and Company | 0,44 | −0,33 | 76,16 | −25,05 | 0,3859 | −0,1048 | |||
| ESQ / Esquire Financial Holdings, Inc. | 0,78 | −0,51 | 73,44 | 24,93 | 0,3721 | 0,0883 | |||
| TW / Tradeweb Markets Inc. | 0,48 | −10,16 | 70,00 | −11,41 | 0,3547 | −0,0269 | |||
| SPGI / S&P Global Inc. | 0,13 | −11,65 | 69,68 | −8,31 | 0,3531 | −0,0139 | |||
| KSPI / Joint Stock Company Kaspi.kz - Depositary Receipt (Common Stock) | 0,81 | −6,37 | 68,38 | −14,40 | 0,3465 | −0,0392 | |||
| DFIN / Donnelley Financial Solutions, Inc. | 1,07 | −19,39 | 66,24 | 13,70 | 0,3356 | 0,0543 | |||
| BIO / Bio-Rad Laboratories, Inc. | 0,27 | −9,42 | 64,46 | −10,25 | 0,3266 | −0,0202 | |||
| JNJ / Johnson & Johnson | 0,41 | −17,81 | 62,60 | −24,30 | 0,3174 | −0,0818 | |||
| NTES / NetEase, Inc. - Depositary Receipt (Common Stock) | 0,46 | −30,70 | 62,38 | −9,38 | 0,3163 | −0,0161 | |||
| PAYX / Paychex, Inc. | 0,41 | −31,07 | 59,30 | −35,01 | 0,3007 | −0,1399 | |||
| AAON / AAON, Inc. | 0,79 | 39,67 | 58,30 | 31,83 | 0,2954 | 0,0819 | |||
| ELV / Elevance Health, Inc. | 0,14 | 53,89 | 0,2733 | 0,2733 | |||||
| ITT / ITT Inc. | 0,33 | −5,48 | 51,14 | 14,76 | 0,2593 | 0,0442 | |||
| SII / Sprott Inc. | 0,73 | 50,43 | 0,2557 | 0,2557 | |||||
| TSM / Taiwan Semiconductor Manufacturing Company Limited - Depositary Receipt (Common Stock) | 0,21 | 18,62 | 47,13 | 61,84 | 0,2388 | 0,0982 | |||
| ZTS / Zoetis Inc. | 0,29 | 45,78 | 0,2322 | 0,2322 | |||||
| CGNX / Cognex Corporation | 1,44 | 45,72 | 0,2319 | 0,2319 | |||||
| ABBV / AbbVie Inc. | 0,24 | −5,70 | 45,29 | −16,45 | 0,2295 | −0,0323 | |||
| ARM / Arm Holdings plc - Depositary Receipt (Common Stock) | 0,28 | 44,60 | 0,2262 | 0,2262 | |||||
| AME / AMETEK, Inc. | 0,24 | −30,04 | 42,97 | −26,46 | 0,2177 | −0,0644 | |||
| HSY / The Hershey Company | 0,26 | −5,30 | 42,42 | −8,11 | 0,2151 | −0,0078 | |||
| ICLR / ICON Public Limited Company | 0,27 | −53,83 | 38,69 | −61,62 | 0,1960 | −0,2907 | |||
| STT / State Street Corporation | 0,36 | −29,98 | 38,46 | −16,84 | 0,1949 | −0,0284 | |||
| MKC.V / McCormick & Company, Incorporated | 0,48 | −10,27 | 36,51 | −17,35 | 0,1850 | −0,0283 | |||
| RYAN / Ryan Specialty Holdings, Inc. | 0,50 | −2,78 | 33,79 | −10,52 | 0,1712 | −0,0111 | |||
| BWA / BorgWarner Inc. | 0,98 | −4,91 | 32,97 | 11,12 | 0,1672 | 0,0239 | |||
| SNA / Snap-on Incorporated | 0,10 | −85,46 | 31,64 | −86,57 | 0,1604 | −0,9771 | |||
| SN / SharkNinja, Inc. | 0,29 | −10,67 | 28,93 | 6,02 | 0,1466 | 0,0148 | |||
| BRK.B / Berkshire Hathaway Inc. | 0,06 | 8,37 | 27,99 | −1,15 | 0,1418 | 0,0051 | |||
| IBKR / Interactive Brokers Group, Inc. | 0,45 | 245,47 | 25,05 | 15,60 | 0,1269 | 0,0223 | |||
| CASH / Pathward Financial, Inc. | 0,25 | −11,35 | 20,18 | −3,85 | 0,1022 | 0,0009 | |||
| RMD / ResMed Inc. | 0,08 | −3,36 | 20,12 | 11,38 | 0,1019 | 0,0147 | |||
| LPLA / LPL Financial Holdings Inc. | 0,05 | −3,54 | 19,87 | 10,57 | 0,1007 | 0,0139 | |||
| KNSL / Kinsale Capital Group, Inc. | 0,04 | −3,36 | 17,27 | −3,92 | 0,0876 | 0,0008 | |||
| ENSG / The Ensign Group, Inc. | 0,11 | 16,90 | 0,0857 | 0,0857 | |||||
| FCNCA / First Citizens BancShares, Inc. | 0,01 | −3,34 | 16,87 | 1,99 | 0,0855 | 0,0056 | |||
| CSL / Carlisle Companies Incorporated | 0,04 | −20,96 | 14,76 | −13,32 | 0,0748 | −0,0074 | |||
| RBA / RB Global, Inc. | 0,13 | −3,63 | 13,84 | 2,03 | 0,0702 | 0,0047 | |||
| MUSA / Murphy USA Inc. | 0,03 | 18,95 | 12,90 | 2,99 | 0,0653 | 0,0049 | |||
| DHI / D.R. Horton, Inc. | 0,10 | −3,35 | 12,26 | −1,98 | 0,0622 | 0,0018 | |||
| FOUR / Shift4 Payments, Inc. | 0,11 | 63,63 | 10,59 | 98,48 | 0,0536 | 0,0279 | |||
| ABNB / Airbnb, Inc. | 0,08 | 55,39 | 9,93 | 72,16 | 0,0504 | 0,0225 | |||
| WMS / Advanced Drainage Systems, Inc. | 0,08 | −3,72 | 9,46 | 1,79 | 0,0480 | 0,0031 | |||
| CBZ / CBIZ, Inc. | 0,13 | 9,23 | 0,0468 | 0,0468 | |||||
| KLAC / KLA Corporation | 0,01 | −39,34 | 9,18 | −20,07 | 0,0465 | −0,0089 | |||
| VRSN / VeriSign, Inc. | 0,03 | −18,27 | 8,82 | −7,03 | 0,0447 | −0,0011 | |||
| ORLY / O'Reilly Automotive, Inc. | 0,09 | 859,69 | 8,35 | −39,62 | 0,0423 | −0,0244 | |||
| EEFT / Euronet Worldwide, Inc. | 0,08 | −3,55 | 8,15 | −8,49 | 0,0413 | −0,0017 | |||
| MAR / Marriott International, Inc. | 0,02 | 6,75 | 0,0342 | 0,0342 | |||||
| GOOGL / Alphabet Inc. | 0,03 | −19,73 | 6,09 | −8,52 | 0,0309 | −0,0013 | |||
| YMM / Full Truck Alliance Co. Ltd. - Depositary Receipt (Common Stock) | 0,43 | 42,51 | 5,09 | 31,82 | 0,0258 | 0,0071 | |||
| GSIG / Goldman Sachs ETF Trust - Goldman Sachs Access Investment Grade Corporate 1-5 Year Bond ETF | 0,03 | 4,15 | 0,0211 | 0,0211 | |||||
| PDD / PDD Holdings Inc. - Depositary Receipt (Common Stock) | 0,03 | 0,00 | 2,83 | −11,58 | 0,0143 | −0,0011 | |||
| AAPL / Apple Inc. | 0,00 | 0,00 | 0,81 | −7,62 | 0,0041 | −0,0001 | |||
| NVDD / Direxion Shares ETF Trust - Direxion Daily NVDA Bear 1X Shares | 0,00 | 0,00 | 0,32 | 45,83 | 0,0016 | 0,0006 | |||
| LLY / Eli Lilly and Company | 0,00 | 0,00 | 0,23 | −5,67 | 0,0012 | −0,0000 | |||
| CVS / CVS Health Corporation | 0,00 | −100,00 | 0,00 | 0,0000 | |||||
| WINA / Winmark Corporation | 0,00 | −100,00 | 0,00 | 0,0000 | |||||
| MBC / MasterBrand, Inc. | 0,00 | −100,00 | 0,00 | 0,0000 | |||||
| XPEL / XPEL, Inc. | 0,00 | −100,00 | 0,00 | 0,0000 | |||||
| CRL / Charles River Laboratories International, Inc. | 0,00 | −100,00 | 0,00 | 0,0000 | |||||
| XP / XP Inc. | 0,00 | −100,00 | 0,00 | 0,0000 | |||||
| FDX / FedEx Corporation | 0,00 | −100,00 | 0,00 | 0,0000 |