Grundläggande statistik
| Portföljvärde | $ 89 417 318 |
| Aktuella positioner | 33 |
Senaste innehav, resultat, förvaltat kapital (från 13F, 13D)
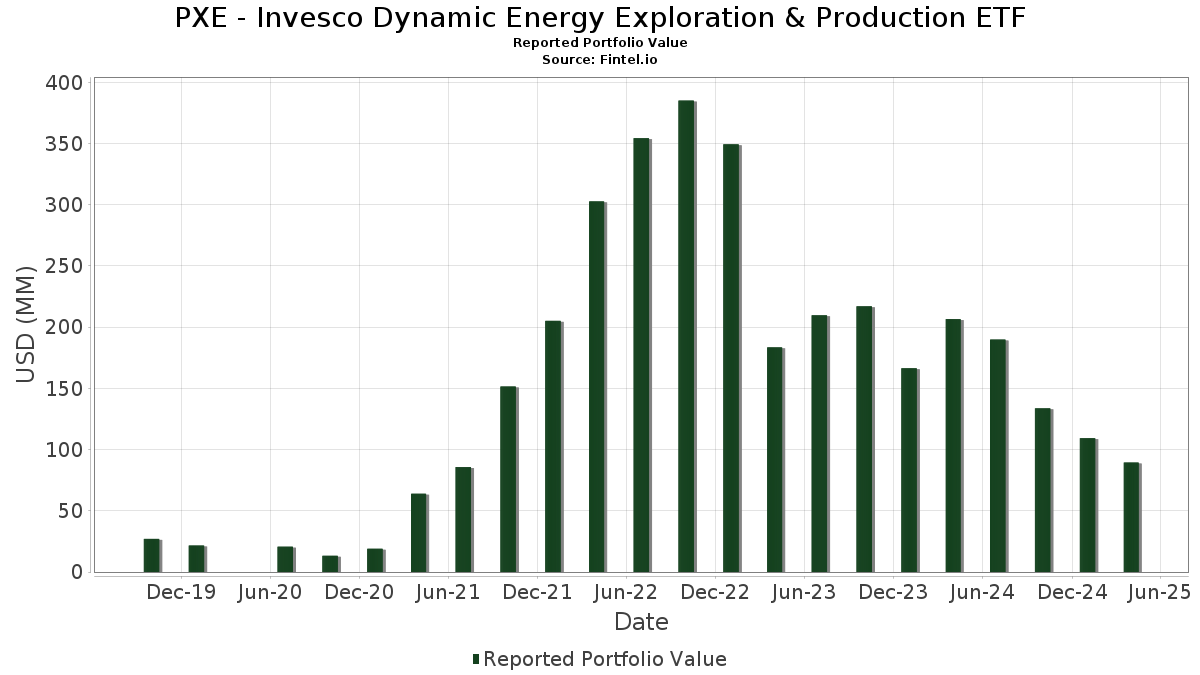
PXE - Invesco Dynamic Energy Exploration & Production ETF har redovisat 33 totala innehav i sina senaste SEC-arkiveringar. Det senaste portföljvärdet beräknas vara $ 89 417 318 USD. Faktiskt förvaltade tillgångar (AUM) är detta värde plus likvida medel (som inte redovisas). PXE - Invesco Dynamic Energy Exploration & Production ETFs största innehav är EQT Corporation (US:EQT) , Expand Energy Corporation (US:EXE) , Marathon Petroleum Corporation (US:MPC) , Cabot Oil & Gas Corp. (US:COG) , and Valero Energy Corporation (US:VLO) . PXE - Invesco Dynamic Energy Exploration & Production ETFs nya positioner inkluderar Flame Acquisition Corp. (US:FLME) , .
Största ökningarna detta kvartal
Vi använder förändringen i portföljallokeringen eftersom det är det mest meningsfulla måttet. Förändringar kan bero på transaktioner eller förändringar i aktiekurser.
| Värdepapper | Aktier (MM) |
Värde (MM$) |
Portfölj % av | ΔPortfölj % av |
|---|---|---|---|---|
| 13,01 | 13,01 | 18,2532 | 18,2532 | |
| 5,00 | 5,00 | 7,0061 | 7,0061 | |
| 0,04 | 4,32 | 6,0578 | 3,0546 | |
| 0,08 | 1,49 | 2,0932 | 2,0932 | |
| 0,88 | 1,35 | 1,8944 | 1,8944 | |
| 0,09 | 4,33 | 6,0726 | 1,2214 | |
| 0,08 | 2,27 | 3,1835 | 1,2037 | |
| 0,03 | 3,90 | 5,4738 | 0,4855 | |
| 0,10 | 2,06 | 2,8844 | 0,4280 | |
| 0,27 | 1,86 | 2,6147 | 0,3444 |
Största minskningarna detta kvartal
Vi använder förändringen i portföljallokeringen eftersom det är det mest meningsfulla måttet. Förändringar kan bero på transaktioner eller förändringar i aktiepriser.
| Värdepapper | Aktier (MM) |
Värde (MM$) |
Portfölj % av | ΔPortfölj % av |
|---|---|---|---|---|
| 0,17 | 1,41 | 1,9791 | −0,9840 | |
| 0,06 | 1,58 | 2,2098 | −0,6470 | |
| 0,18 | 1,46 | 2,0413 | −0,5890 | |
| 0,10 | 1,62 | 2,2721 | −0,5542 | |
| 0,04 | 1,76 | 2,4663 | −0,3963 | |
| 0,15 | 1,99 | 2,7901 | −0,3484 | |
| 0,07 | 1,61 | 2,2543 | −0,2027 | |
| 0,16 | 3,84 | 5,3811 | −0,1204 | |
| 0,06 | 1,85 | 2,5976 | −0,0987 | |
| 0,03 | 3,59 | 5,0400 | −0,0662 |
13F- och fond arkiveringar
Denna blankett lämnades in den 2025-06-27 för rapporteringsperioden 2025-04-30. Klicka på länksymbolen för att se hela transaktionshistoriken.
Uppgradera för att låsa upp premiumdata och exportera till Excel![]() .
.
| Värdepapper | Typ | Genomsnittligt aktiepris | Aktier (MM) |
ΔAktier (%) |
ΔAktier (%) |
Värde ($MM) |
Portfölj (%) |
ΔPortfölj (%) |
|
|---|---|---|---|---|---|---|---|---|---|
| Invesco Private Prime Fund / STIV (N/A) | 13,01 | 13,01 | 18,2532 | 18,2532 | |||||
| Invesco Private Government Fund / STIV (N/A) | 5,00 | 5,00 | 7,0061 | 7,0061 | |||||
| EQT / EQT Corporation | 0,09 | −54,66 | 4,33 | −47,12 | 6,0726 | 1,2214 | |||
| EXE / Expand Energy Corporation | 0,04 | 45,49 | 4,32 | 48,78 | 6,0578 | 3,0546 | |||
| MPC / Marathon Petroleum Corporation | 0,03 | −14,17 | 3,90 | −19,08 | 5,4738 | 0,4855 | |||
| COG / Cabot Oil & Gas Corp. | 0,16 | −18,57 | 3,84 | −27,87 | 5,3811 | −0,1204 | |||
| VLO / Valero Energy Corporation | 0,03 | −13,57 | 3,71 | −24,57 | 5,2103 | 0,1163 | |||
| DVN / Devon Energy Corporation | 0,12 | −11,89 | 3,63 | −21,42 | 5,0844 | 0,3115 | |||
| EOG / EOG Resources, Inc. | 0,03 | −17,00 | 3,59 | −27,21 | 5,0400 | −0,0662 | |||
| PSX / Phillips 66 | 0,03 | −12,81 | 3,53 | −23,02 | 4,9442 | 0,2065 | |||
| NFG / National Fuel Gas Company | 0,03 | −28,64 | 2,42 | −21,75 | 3,3914 | 0,1940 | |||
| CNX / CNX Resources Corporation | 0,08 | 10,34 | 2,27 | 18,61 | 3,1835 | 1,2037 | |||
| GPOR / Gulfport Energy Corporation | 0,01 | −18,06 | 2,26 | −20,81 | 3,1713 | 0,2170 | |||
| CVI / CVR Energy, Inc. | 0,11 | −22,46 | 2,14 | −22,81 | 3,0045 | 0,1329 | |||
| RRC / Range Resources Corporation | 0,06 | −21,07 | 2,11 | −27,71 | 2,9606 | −0,0597 | |||
| MGY / Magnolia Oil & Gas Corporation | 0,10 | −0,02 | 2,06 | −13,40 | 2,8844 | 0,4280 | |||
| PR / Permian Resources Corporation | 0,17 | −5,25 | 2,01 | −23,69 | 2,8245 | 0,0948 | |||
| MNR / Mach Natural Resources LP | 0,15 | −13,09 | 1,99 | −34,42 | 2,7901 | −0,3484 | |||
| CHRD / Chord Energy Corporation | 0,02 | −0,90 | 1,94 | −20,47 | 2,7197 | 0,1970 | |||
| TALO / Talos Energy Inc. | 0,27 | 0,07 | 1,86 | −49,49 | 2,6147 | 0,3444 | |||
| OVV / Ovintiv Inc. | 0,06 | −10,66 | 1,85 | −28,93 | 2,5976 | −0,0987 | |||
| CRC / California Resources Corporation | 0,05 | 5,34 | 1,77 | −26,12 | 2,4807 | 0,0044 | |||
| NOG / Northern Oil and Gas, Inc. | 0,07 | 11,15 | 1,76 | −24,87 | 2,4701 | 0,0450 | |||
| MTDR / Matador Resources Company | 0,04 | −6,78 | 1,76 | −36,47 | 2,4663 | −0,3963 | |||
| MUR / Murphy Oil Corporation | 0,08 | −1,09 | 1,73 | −23,74 | 2,4287 | 0,0795 | |||
| APA / APA Corporation | 0,10 | −16,32 | 1,62 | −40,74 | 2,2721 | −0,5542 | |||
| SM / SM Energy Company | 0,07 | 12,72 | 1,61 | −32,34 | 2,2543 | −0,2027 | |||
| CIVI / Civitas Resources, Inc. | 0,06 | 6,28 | 1,58 | −42,96 | 2,2098 | −0,6470 | |||
| FLME / Flame Acquisition Corp. | 0,08 | 1,49 | 2,0932 | 2,0932 | |||||
| HPK / HighPeak Energy, Inc. | 0,18 | −2,60 | 1,46 | −42,76 | 2,0413 | −0,5890 | |||
| CRGY / Crescent Energy Company | 0,17 | −10,40 | 1,41 | −50,73 | 1,9791 | −0,9840 | |||
| KOS / Kosmos Energy Ltd. | 0,88 | 1,35 | 1,8944 | 1,8944 | |||||
| US8252528851 / Invesco Government & Agency Portfolio, Institutional Class | 0,11 | −24,95 | 0,11 | −24,83 | 0,1536 | 0,0026 |