Grundläggande statistik
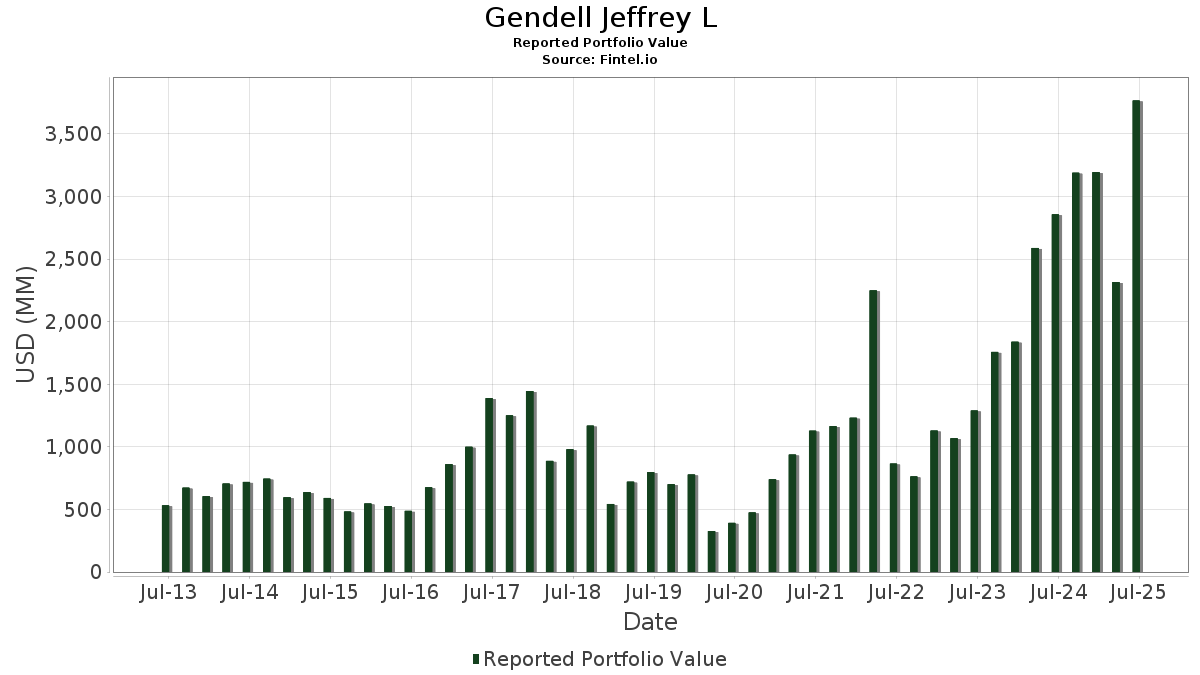
| Portföljvärde | $ 3 766 390 852 |
| Aktuella positioner | 77 |
Senaste innehav, resultat, förvaltat kapital (från 13F, 13D)
Gendell Jeffrey L har redovisat 77 totala innehav i sina senaste SEC-arkiveringar. Det senaste portföljvärdet beräknas vara $ 3 766 390 852 USD. Faktiskt förvaltade tillgångar (AUM) är detta värde plus likvida medel (som inte redovisas). Gendell Jeffrey Ls största innehav är IES Holdings, Inc. (US:IESC) , Avadel Pharmaceuticals plc (US:AVDL) , BlueLinx Holdings Inc. (US:BXC) , iShares Trust - iShares Russell 2000 ETF (US:IWM) , and Alpha Metallurgical Resources, Inc. (US:AMR) . Gendell Jeffrey Ls nya positioner inkluderar Apple Inc. (US:AAPL) , Flex Ltd. (US:FLEX) , Innovex International, Inc. (US:INVX) , Tecogen Inc. (US:TGEN) , and . Gendell Jeffrey Ls främsta industrier är "Automotive Dealers And Gasoline Service Stations" (sic 55) , "Miscellaneous Retail " (sic 59) , and "Insurance Carriers" (sic 63) .
Största ökningarna detta kvartal
Vi använder förändringen i portföljallokeringen eftersom det är det mest meningsfulla måttet. Förändringar kan bero på transaktioner eller förändringar i aktiekurser.
| Värdepapper | Aktier (MM) |
Värde (MM$) |
Portfölj % av | ΔPortfölj % av |
|---|---|---|---|---|
| 10,68 | 3 162,65 | 83,9704 | 7,5675 | |
| 0,15 | 20,45 | 0,5431 | 0,5431 | |
| 0,17 | 36,68 | 0,5404 | 0,5404 | |
| 0,05 | 10,26 | 0,2724 | 0,2724 | |
| 0,17 | 10,67 | 0,1571 | 0,1571 | |
| 0,02 | 7,28 | 0,1073 | 0,1073 | |
| 0,05 | 7,18 | 0,1906 | 0,0993 | |
| 0,07 | 6,46 | 0,0951 | 0,0951 | |
| 0,05 | 2,50 | 0,0663 | 0,0663 | |
| 0,15 | 4,22 | 0,0622 | 0,0622 |
Största minskningarna detta kvartal
Vi använder förändringen i portföljallokeringen eftersom det är det mest meningsfulla måttet. Förändringar kan bero på transaktioner eller förändringar i aktiepriser.
| Värdepapper | Aktier (MM) |
Värde (MM$) |
Portfölj % av | ΔPortfölj % av |
|---|---|---|---|---|
| 5,18 | 45,81 | 0,6749 | −1,3964 | |
| 0,56 | 41,93 | 0,6177 | −0,9453 | |
| 0,30 | 33,34 | 0,4911 | −0,7334 | |
| 0,35 | 4,64 | 0,0684 | −0,7209 | |
| 0,06 | 4,87 | 0,0717 | −0,6889 | |
| 0,14 | 31,13 | 0,4587 | −0,6766 | |
| 1,40 | 3,63 | 0,0534 | −0,5672 | |
| 0,12 | 12,06 | 0,1776 | −0,5493 | |
| 1,94 | 15,17 | 0,2234 | −0,5456 | |
| 0,29 | 8,26 | 0,1217 | −0,5170 |
13D/G-arkiveringar
Detta är en lista över 13D- och 13G-arkiveringar som gjorts under det senaste året (om några). Klicka på länken för att se hela transaktionshistoriken. Gröna rader indikerar nya positioner. Röda rader indikerar stängda positioner.
| Fil Datum | Formulär | Värdepapper | Föregående aktier |
Aktuella aktier |
ΔAktier % | % Ägande |
% ΔÄgande | |
|---|---|---|---|---|---|---|---|---|
| 2025-08-14 | FRD / Friedman Industries, Incorporated | 453 129 | 354 576 | −21,75 | 5,00 | −23,08 | ||
| 2025-08-14 | KLXE / KLX Energy Services Holdings, Inc. | 1 526 795 | 1 693 219 | 10,90 | 9,50 | 2,04 | ||
| 2025-02-14 | NINE / Nine Energy Service, Inc. | 3 313 322 | 4 184 044 | 26,28 | 9,90 | 5,54 | ||
| 2024-11-13 | ASRV / AmeriServ Financial, Inc. | 1 246 113 | 1 572 987 | 26,23 | 9,52 | 30,95 | ||
| 2024-11-13 | FUSB / First US Bancshares, Inc. | 291 981 | 361 084 | 23,67 | 6,32 | 24,17 | ||
| 2024-11-13 | IROQ / IF Bancorp, Inc. | 272 040 | 326 382 | 19,98 | 9,73 | 19,98 |
13F- och fond arkiveringar
Denna blankett lämnades in den 2025-08-14 för rapporteringsperioden 2025-06-30. Klicka på länksymbolen för att se hela transaktionshistoriken.
Uppgradera för att låsa upp premiumdata och exportera till Excel![]() .
.
| Värdepapper | Typ | Genomsnittligt aktiepris | Aktier (MM) |
ΔAktier (%) |
ΔAktier (%) |
Värde ($MM) |
Portfölj (%) |
ΔPortfölj (%) |
|
|---|---|---|---|---|---|---|---|---|---|
| IESC / IES Holdings, Inc. | 10,68 | −0,39 | 3 162,65 | 78,72 | 83,9704 | 7,5675 | |||
| AVDL / Avadel Pharmaceuticals plc | 5,18 | −15,51 | 45,81 | −4,51 | 0,6749 | −1,3964 | |||
| BXC / BlueLinx Holdings Inc. | 0,56 | 16,76 | 41,93 | 15,82 | 0,6177 | −0,9453 | |||
| IWM / iShares Trust - iShares Russell 2000 ETF | 0,17 | 36,68 | 0,5404 | 0,5404 | |||||
| AMR / Alpha Metallurgical Resources, Inc. | 0,30 | 30,89 | 33,34 | 17,54 | 0,4911 | −0,7334 | |||
| OIH / VanEck ETF Trust - VanEck Oil Services ETF | 0,14 | 34,77 | 31,13 | 18,40 | 0,4587 | −0,6766 | |||
| MU / Micron Technology, Inc. | 0,17 | 116,88 | 20,58 | 207,65 | 0,3032 | 0,0144 | |||
| OC / Owens Corning | 0,15 | 20,45 | 0,5431 | 0,5431 | |||||
| SLB / Schlumberger Limited | 0,45 | 13,73 | 15,21 | −8,04 | 0,2241 | −0,4900 | |||
| LXU / LSB Industries, Inc. | 1,94 | −28,06 | 15,17 | −14,86 | 0,2234 | −0,5456 | |||
| INDV / Indivior PLC | 0,86 | 41,22 | 12,62 | 118,45 | 0,1860 | −0,0635 | |||
| TTI / TETRA Technologies, Inc. | 3,64 | −12,97 | 12,24 | −12,98 | 0,1803 | −0,4269 | |||
| MHK / Mohawk Industries, Inc. | 0,12 | −22,01 | 12,06 | −28,39 | 0,1776 | −0,5493 | |||
| SKY / Champion Homes, Inc. | 0,17 | 10,67 | 0,1571 | 0,1571 | |||||
| ATKR / Atkore Inc. | 0,15 | −24,76 | 10,59 | −11,52 | 0,1560 | −0,3607 | |||
| RBCAA / Republic Bancorp, Inc. | 0,14 | −2,59 | 10,45 | 11,60 | 0,1539 | −0,2503 | |||
| AAPL / Apple Inc. | 0,05 | 10,26 | 0,2724 | 0,2724 | |||||
| PATK / Patrick Industries, Inc. | 0,11 | 0,00 | 9,70 | 9,12 | 0,1428 | −0,2408 | |||
| OIS / Oil States International, Inc. | 1,61 | −4,11 | 8,62 | −0,20 | 0,1270 | −0,2458 | |||
| AMBC / Ambac Financial Group, Inc. | 1,20 | 98,98 | 8,51 | 61,44 | 0,1254 | −0,1022 | |||
| MTRX / Matrix Service Company | 0,61 | 2,90 | 8,30 | 11,83 | 0,1223 | −0,1982 | |||
| NBR / Nabors Industries Ltd. | 0,29 | −16,90 | 8,26 | −44,18 | 0,1217 | −0,5170 | |||
| IROQ / IF Bancorp, Inc. | 0,33 | −0,06 | 7,94 | 1,00 | 0,1170 | −0,2225 | |||
| XBI / SPDR Series Trust - SPDR S&P Biotech ETF | 0,09 | 137,55 | 7,65 | 142,92 | 0,1127 | −0,0233 | |||
| CNR / Core Natural Resources, Inc. | 0,11 | 87,71 | 7,50 | 69,81 | 0,1106 | −0,0803 | |||
| SNDK / Sandisk Corporation | 0,16 | 370,97 | 7,48 | 348,68 | 0,1101 | 0,0382 | |||
| CMI / Cummins Inc. | 0,02 | 7,28 | 0,1073 | 0,1073 | |||||
| AMD / Advanced Micro Devices, Inc. | 0,05 | 145,79 | 7,18 | 239,50 | 0,1906 | 0,0993 | |||
| LBRT / Liberty Energy Inc. | 0,59 | 23,47 | 6,76 | −10,47 | 0,0996 | −0,2263 | |||
| IOSP / Innospec Inc. | 0,08 | 3,28 | 6,71 | −8,35 | 0,0988 | −0,2172 | |||
| ODP / The ODP Corporation | 0,37 | −0,24 | 6,62 | 26,22 | 0,0975 | −0,1289 | |||
| CLB / Core Laboratories Inc. | 0,57 | 24,61 | 6,56 | −4,23 | 0,0966 | −0,1991 | |||
| UFPI / UFP Industries, Inc. | 0,07 | 6,46 | 0,0951 | 0,0951 | |||||
| GLW / Corning Incorporated | 0,12 | 500,00 | 6,31 | 589,62 | 0,0930 | 0,0534 | |||
| PEBK / Peoples Bancorp of North Carolina, Inc. | 0,22 | 0,00 | 6,28 | 5,92 | 0,0926 | −0,1635 | |||
| WDC / Western Digital Corporation | 0,10 | 111,11 | 6,08 | 234,19 | 0,0896 | 0,0110 | |||
| FRD / Friedman Industries, Incorporated | 0,35 | −17,80 | 5,87 | −8,59 | 0,0865 | −0,1908 | |||
| FUNC / First United Corporation | 0,18 | 0,00 | 5,53 | 3,29 | 0,0815 | −0,1497 | |||
| FMBH / First Mid Bancshares, Inc. | 0,14 | 0,00 | 5,15 | 7,42 | 0,0759 | −0,1312 | |||
| ALRS / Alerus Financial Corporation | 0,23 | −40,05 | 5,06 | −29,72 | 0,0745 | −0,2362 | |||
| ASRV / AmeriServ Financial, Inc. | 1,64 | 0,00 | 4,97 | 25,11 | 0,0733 | −0,0983 | |||
| FUSB / First US Bancshares, Inc. | 0,38 | 4,22 | 4,87 | 0,62 | 0,0718 | −0,1373 | |||
| MTRN / Materion Corporation | 0,06 | −58,91 | 4,87 | 5,71 | 0,0717 | −0,6889 | |||
| NOV / NOV Inc. | 0,39 | 49,66 | 4,82 | 22,24 | 0,0710 | −0,0993 | |||
| WTTR / Select Water Solutions, Inc. | 0,55 | −34,27 | 4,72 | −45,91 | 0,0695 | −0,3073 | |||
| BTU / Peabody Energy Corporation | 0,35 | −74,35 | 4,64 | −74,60 | 0,0684 | −0,7209 | |||
| COFS / ChoiceOne Financial Services, Inc. | 0,15 | −35,91 | 4,26 | −36,07 | 0,0628 | −0,2251 | |||
| WGO / Winnebago Industries, Inc. | 0,15 | 4,22 | 0,0622 | 0,0622 | |||||
| SND / Smart Sand, Inc. | 2,04 | 18,11 | 4,10 | −8,34 | 0,0604 | −0,1327 | |||
| TSEM / Tower Semiconductor Ltd. | 0,09 | 27,36 | 4,04 | 54,83 | 0,0595 | −0,0531 | |||
| DTI / Drilling Tools International Corporation | 1,41 | 20,87 | 4,03 | 45,35 | 0,0594 | −0,0603 | |||
| FCG / First Trust Exchange-Traded Fund - First Trust Natural Gas ETF | 0,16 | −57,83 | 3,70 | −60,78 | 0,0545 | −0,3526 | |||
| RIG / Transocean Ltd. | 1,40 | −69,13 | 3,63 | −74,77 | 0,0534 | −0,5672 | |||
| TILE / Interface, Inc. | 0,17 | 0,00 | 3,53 | 5,50 | 0,0520 | −0,0925 | |||
| CZWI / Citizens Community Bancorp, Inc. | 0,25 | −1,04 | 3,43 | −5,04 | 0,0505 | −0,1053 | |||
| NINE / Nine Energy Service, Inc. | 4,18 | −0,13 | 3,22 | −31,84 | 0,0475 | −0,1567 | |||
| KLXE / KLX Energy Services Holdings, Inc. | 1,69 | 1,20 | 3,17 | −45,94 | 0,0841 | −0,1688 | |||
| SLND / Southland Holdings, Inc. | 0,74 | 6,74 | 3,10 | 49,21 | 0,0457 | −0,0440 | |||
| PSCE / Invesco Exchange-Traded Fund Trust II - Invesco S&P SmallCap Energy ETF | 0,07 | −5,07 | 2,91 | −11,96 | 0,0429 | −0,0998 | |||
| COHR / Coherent Corp. | 0,03 | 0,00 | 2,80 | 37,40 | 0,0412 | −0,0467 | |||
| SXC / SunCoke Energy, Inc. | 0,29 | 7,02 | 2,51 | −0,04 | 0,0369 | −0,0714 | |||
| FLEX / Flex Ltd. | 0,05 | 2,50 | 0,0663 | 0,0663 | |||||
| CAC / Camden National Corporation | 0,06 | −49,41 | 2,49 | −49,28 | 0,0366 | −0,1750 | |||
| BW / Babcock & Wilcox Enterprises, Inc. | 2,57 | 49,25 | 2,48 | 113,53 | 0,0365 | −0,0136 | |||
| LUMN / Lumen Technologies, Inc. | 0,55 | 0,00 | 2,41 | 11,73 | 0,0355 | −0,0576 | |||
| BVFL / BV Financial, Inc. | 0,14 | 0,00 | 2,15 | −0,19 | 0,0317 | −0,0614 | |||
| SHBI / Shore Bancshares, Inc. | 0,14 | −51,72 | 2,15 | −43,94 | 0,0317 | −0,1340 | |||
| ORN / Orion Group Holdings, Inc. | 0,19 | −67,10 | 1,74 | −42,96 | 0,0256 | −0,1060 | |||
| FENC / Fennec Pharmaceuticals Inc. | 0,14 | −28,44 | 1,16 | −2,44 | 0,0171 | −0,0342 | |||
| BRBS / Blue Ridge Bankshares, Inc. | 0,31 | 11,12 | 1,12 | 22,40 | 0,0165 | −0,0230 | |||
| SBFG / SB Financial Group, Inc. | 0,05 | 0,00 | 0,88 | −8,20 | 0,0130 | −0,0286 | |||
| FRBA / First Bank | 0,05 | −15,21 | 0,76 | −11,36 | 0,0112 | −0,0257 | |||
| INVX / Innovex International, Inc. | 0,04 | 0,61 | 0,0163 | 0,0163 | |||||
| TGEN / Tecogen Inc. | 0,04 | 0,28 | 0,0075 | 0,0075 | |||||
| CIVB / Civista Bancshares, Inc. | 0,01 | 0,00 | 0,23 | 18,97 | 0,0034 | −0,0050 | |||
| OCC / Optical Cable Corporation | 0,07 | 51,00 | 0,20 | 57,60 | 0,0029 | −0,0025 | |||
| ASTL / Algoma Steel Group Inc. | 0,09 | 0,00 | 0,05 | 38,24 | 0,0007 | −0,0008 | |||
| QXO / QXO, Inc. | 0,00 | −100,00 | 0,00 | 0,0000 | |||||
| EQT / EQT Corporation | 0,00 | −100,00 | 0,00 | 0,0000 | |||||
| IWN / iShares Trust - iShares Russell 2000 Value ETF | 0,00 | −100,00 | 0,00 | 0,0000 | |||||
| HP / Helmerich & Payne, Inc. | 0,00 | −100,00 | 0,00 | 0,0000 | |||||
| HBT / HBT Financial, Inc. | 0,00 | −100,00 | 0,00 | 0,0000 | |||||
| C / Citigroup Inc. | 0,00 | −100,00 | 0,00 | 0,0000 | |||||
| HAL / Halliburton Company | 0,00 | −100,00 | 0,00 | 0,0000 | |||||
| HWBK / Hawthorn Bancshares, Inc. | 0,00 | −100,00 | 0,00 | 0,0000 | |||||
| SDRL / Seadrill Limited | 0,00 | −100,00 | 0,00 | 0,0000 | |||||
| XLE / The Select Sector SPDR Trust - The Energy Select Sector SPDR Fund | 0,00 | −100,00 | 0,00 | −100,00 | −0,1412 | ||||
| CMT / Core Molding Technologies, Inc. | 0,00 | −100,00 | 0,00 | 0,0000 | |||||
| KRE / SPDR Series Trust - SPDR S&P Regional Banking ETF | 0,00 | −100,00 | 0,00 | 0,0000 | |||||
| BORR / Borr Drilling Limited | 0,00 | −100,00 | 0,00 | 0,0000 |