Grundläggande statistik
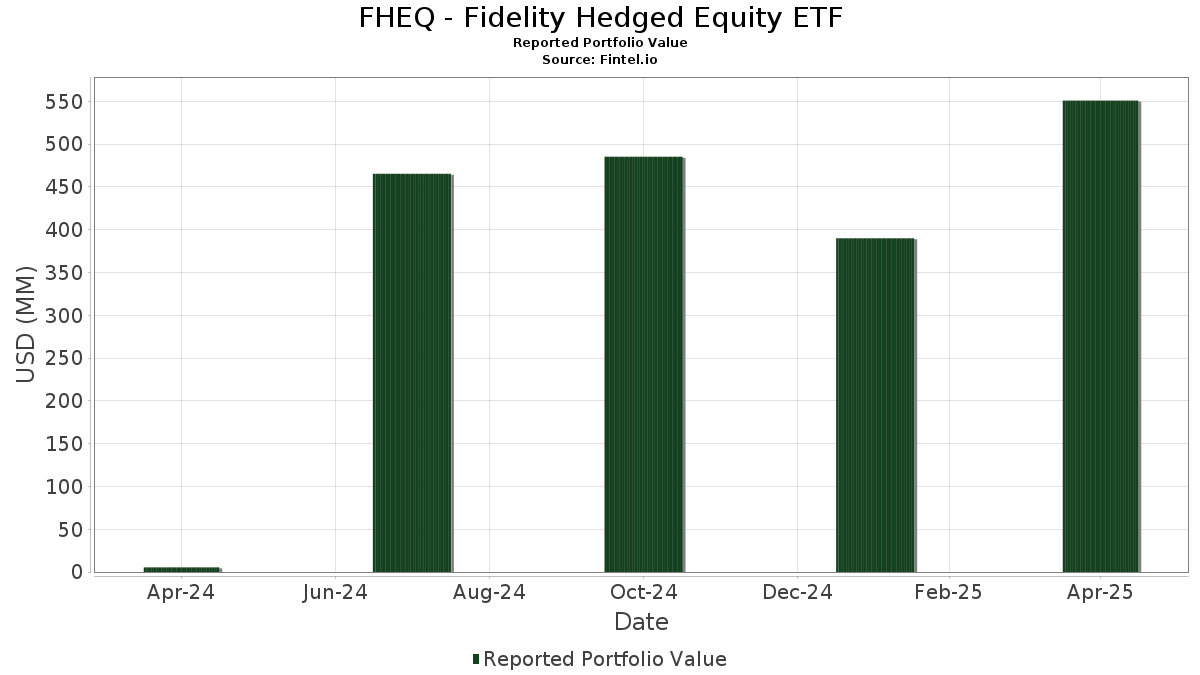
| Portföljvärde | $ 550 955 206 |
| Aktuella positioner | 180 |
Senaste innehav, resultat, förvaltat kapital (från 13F, 13D)
FHEQ - Fidelity Hedged Equity ETF har redovisat 180 totala innehav i sina senaste SEC-arkiveringar. Det senaste portföljvärdet beräknas vara $ 550 955 206 USD. Faktiskt förvaltade tillgångar (AUM) är detta värde plus likvida medel (som inte redovisas). FHEQ - Fidelity Hedged Equity ETFs största innehav är Apple Inc. (US:AAPL) , NVIDIA Corporation (US:NVDA) , Microsoft Corporation (US:MSFT) , Amazon.com, Inc. (US:AMZN) , and Meta Platforms, Inc. (US:META) . FHEQ - Fidelity Hedged Equity ETFs nya positioner inkluderar Airbnb, Inc. (US:ABNB) , New Residential Investment Corp (US:NRZ) , The Williams Companies, Inc. (AT:WMB) , FedEx Corporation (US:FDX) , and Expro Group Holdings N.V. (US:XPRO) .
Största ökningarna detta kvartal
Vi använder förändringen i portföljallokeringen eftersom det är det mest meningsfulla måttet. Förändringar kan bero på transaktioner eller förändringar i aktiekurser.
| Värdepapper | Aktier (MM) |
Värde (MM$) |
Portfölj % av | ΔPortfölj % av |
|---|---|---|---|---|
| 0,01 | 3,71 | 0,6743 | 0,6270 | |
| 0,04 | 4,35 | 0,7895 | 0,6188 | |
| 0,01 | 5,55 | 1,0070 | 0,5574 | |
| 0,02 | 2,76 | 0,5008 | 0,5008 | |
| 0,01 | 2,67 | 0,4844 | 0,4844 | |
| 0,01 | 2,60 | 0,4728 | 0,4728 | |
| 0,03 | 2,84 | 0,5151 | 0,4501 | |
| 0,22 | 2,43 | 0,4405 | 0,4405 | |
| 0,02 | 2,42 | 0,4392 | 0,4319 | |
| 2,27 | 0,4125 | 0,4125 |
Största minskningarna detta kvartal
Vi använder förändringen i portföljallokeringen eftersom det är det mest meningsfulla måttet. Förändringar kan bero på transaktioner eller förändringar i aktiepriser.
| Värdepapper | Aktier (MM) |
Värde (MM$) |
Portfölj % av | ΔPortfölj % av |
|---|---|---|---|---|
| 0,02 | 6,04 | 1,0959 | −0,7422 | |
| 0,12 | 21,88 | 3,9722 | −0,6345 | |
| 0,03 | 15,82 | 2,8723 | −0,5921 | |
| 0,01 | 2,03 | 0,3689 | −0,4530 | |
| 0,05 | 8,23 | 1,4943 | −0,4486 | |
| 0,03 | 8,52 | 1,5470 | −0,4032 | |
| 0,07 | 10,47 | 1,9002 | −0,3866 | |
| 0,01 | 2,38 | 0,4321 | −0,3845 | |
| 0,00 | 0,75 | 0,1365 | −0,3678 | |
| 0,01 | 0,23 | 0,0425 | −0,3331 |
13F- och fond arkiveringar
Denna blankett lämnades in den 2025-06-26 för rapporteringsperioden 2025-04-30. Klicka på länksymbolen för att se hela transaktionshistoriken.
Uppgradera för att låsa upp premiumdata och exportera till Excel![]() .
.
| Värdepapper | Typ | Genomsnittligt aktiepris | Aktier (MM) |
ΔAktier (%) |
ΔAktier (%) |
Värde ($MM) |
Portfölj (%) |
ΔPortfölj (%) |
|
|---|---|---|---|---|---|---|---|---|---|
| AAPL / Apple Inc. | 0,18 | 50,57 | 38,92 | 35,58 | 7,0666 | −0,2914 | |||
| NVDA / NVIDIA Corporation | 0,30 | 52,94 | 32,95 | 38,74 | 5,9828 | −0,1051 | |||
| MSFT / Microsoft Corporation | 0,08 | 49,43 | 30,60 | 42,30 | 5,5550 | 0,0440 | |||
| AMZN / Amazon.com, Inc. | 0,12 | 56,88 | 21,88 | 21,73 | 3,9722 | −0,6345 | |||
| META / Meta Platforms, Inc. | 0,03 | 46,93 | 15,82 | 17,05 | 2,8723 | −0,5921 | |||
| BRK.B / Berkshire Hathaway Inc. | 0,03 | 45,20 | 13,87 | 65,21 | 2,5187 | 0,3665 | |||
| AVGO / Broadcom Inc. | 0,07 | 54,08 | 12,56 | 34,03 | 2,2804 | −0,1216 | |||
| GOOGL / Alphabet Inc. | 0,07 | 50,71 | 10,47 | 17,31 | 1,9002 | −0,3866 | |||
| JPM / JPMorgan Chase & Co. | 0,03 | 22,36 | 8,52 | 11,99 | 1,5470 | −0,4032 | |||
| GOOG / Alphabet Inc. | 0,05 | 38,75 | 8,23 | 8,58 | 1,4943 | −0,4486 | |||
| XOM / Exxon Mobil Corporation | 0,07 | 46,31 | 7,79 | 44,68 | 1,4150 | 0,0342 | |||
| NFLX / Netflix, Inc. | 0,01 | 15,30 | 7,00 | 33,59 | 1,2700 | −0,0721 | |||
| ABBV / AbbVie Inc. | 0,03 | 41,72 | 6,70 | 50,34 | 1,2158 | 0,0742 | |||
| HD / The Home Depot, Inc. | 0,02 | 55,03 | 6,65 | 35,65 | 1,2069 | −0,0491 | |||
| MA / Mastercard Incorporated | 0,01 | 22,14 | 6,61 | 20,52 | 1,1996 | −0,2056 | |||
| LLY / Eli Lilly and Company | 0,01 | 101,87 | 6,10 | 123,75 | 1,1084 | 0,4090 | |||
| TSLA / Tesla, Inc. | 0,02 | 20,69 | 6,04 | −15,84 | 1,0959 | −0,7422 | |||
| CRM / Salesforce, Inc. | 0,02 | 72,43 | 5,72 | 35,58 | 1,0391 | −0,0427 | |||
| WMT / Walmart Inc. | 0,06 | 13,85 | 5,71 | 12,80 | 1,0372 | −0,2610 | |||
| PG / The Procter & Gamble Company | 0,04 | 103,87 | 5,70 | 99,68 | 1,0345 | 0,3031 | |||
| COST / Costco Wholesale Corporation | 0,01 | 211,56 | 5,55 | 216,37 | 1,0070 | 0,5574 | |||
| PM / Philip Morris International Inc. | 0,03 | 44,24 | 5,12 | 89,83 | 0,9290 | 0,2381 | |||
| MRK / Merck & Co., Inc. | 0,06 | 59,21 | 5,01 | 37,27 | 0,9087 | −0,0259 | |||
| QCOM / QUALCOMM Incorporated | 0,03 | 55,97 | 4,75 | 33,90 | 0,8628 | −0,0468 | |||
| ADBE / Adobe Inc. | 0,01 | 57,41 | 4,63 | 34,92 | 0,8406 | −0,0389 | |||
| PGR / The Progressive Corporation | 0,02 | 57,03 | 4,62 | 79,54 | 0,8382 | 0,1791 | |||
| SCHW / The Charles Schwab Corporation | 0,05 | 47,72 | 4,42 | 45,36 | 0,8019 | 0,0231 | |||
| MS / Morgan Stanley | 0,04 | 683,10 | 4,35 | 553,83 | 0,7895 | 0,6188 | |||
| GILD / Gilead Sciences, Inc. | 0,04 | 27,91 | 4,33 | 40,19 | 0,7861 | −0,0054 | |||
| BAC / Bank of America Corporation | 0,11 | 48,85 | 4,23 | 28,20 | 0,7677 | −0,0776 | |||
| DIS / The Walt Disney Company | 0,05 | 48,17 | 4,22 | 19,20 | 0,7654 | −0,1411 | |||
| V / Visa Inc. | 0,01 | 85,57 | 4,15 | 87,57 | 0,7534 | 0,1864 | |||
| AMAT / Applied Materials, Inc. | 0,03 | 87,77 | 4,14 | 56,91 | 0,7525 | 0,0755 | |||
| TT / Trane Technologies plc | 0,01 | 56,23 | 4,01 | 65,06 | 0,7283 | 0,1055 | |||
| PFE / Pfizer Inc. | 0,16 | 42,10 | 3,97 | 30,80 | 0,7211 | −0,0572 | |||
| UNH / UnitedHealth Group Incorporated | 0,01 | 79,08 | 3,93 | 35,81 | 0,7142 | −0,0281 | |||
| LMT / Lockheed Martin Corporation | 0,01 | 47,58 | 3,90 | 52,34 | 0,7086 | 0,0518 | |||
| WFC / Wells Fargo & Company | 0,05 | 48,27 | 3,88 | 33,61 | 0,7053 | −0,0399 | |||
| AMT / American Tower Corporation | 0,02 | 131,95 | 3,79 | 182,77 | 0,6885 | 0,3447 | |||
| GS / The Goldman Sachs Group, Inc. | 0,01 | 2 255,21 | 3,71 | 1 918,48 | 0,6743 | 0,6270 | |||
| CTAS / Cintas Corporation | 0,02 | 36,16 | 3,68 | 43,70 | 0,6688 | 0,0118 | |||
| TJX / The TJX Companies, Inc. | 0,03 | 18,35 | 3,60 | 22,05 | 0,6534 | −0,1024 | |||
| CSCO / Cisco Systems, Inc. | 0,06 | 12,35 | 3,59 | 7,04 | 0,6516 | −0,2079 | |||
| FTNT / Fortinet, Inc. | 0,03 | 192,01 | 3,56 | 200,51 | 0,6471 | 0,3429 | |||
| ECL / Ecolab Inc. | 0,01 | 39,20 | 3,45 | 39,91 | 0,6257 | −0,0057 | |||
| CMCSA / Comcast Corporation | 0,10 | 18,32 | 3,26 | 20,22 | 0,5916 | −0,1031 | |||
| CME / CME Group Inc. | 0,01 | 59,84 | 3,25 | 87,22 | 0,5905 | 0,1453 | |||
| CVNA / Carvana Co. | 0,01 | 60,67 | 3,24 | 58,66 | 0,5874 | 0,0647 | |||
| BMY / Bristol-Myers Squibb Company | 0,06 | 48,44 | 3,16 | 26,44 | 0,5739 | −0,0670 | |||
| CSX / CSX Corporation | 0,11 | 137,27 | 3,14 | 102,71 | 0,5698 | 0,1728 | |||
| LDOS / Leidos Holdings, Inc. | 0,02 | 51,85 | 3,13 | 57,44 | 0,5688 | 0,0585 | |||
| JNJ / Johnson & Johnson | 0,02 | 31,18 | 3,13 | 34,77 | 0,5680 | −0,0270 | |||
| T / AT&T Inc. | 0,11 | 48,62 | 3,06 | 73,48 | 0,5561 | 0,1036 | |||
| ELV / Elevance Health, Inc. | 0,01 | 30,83 | 2,99 | 3,42 | 0,5437 | −0,0782 | |||
| BDX / Becton, Dickinson and Company | 0,01 | 48,72 | 2,95 | 24,42 | 0,5347 | −0,0721 | |||
| US31635A1051 / Fidelity Cash Central Fund | 2,93 | −3,18 | 2,93 | −3,17 | 0,5318 | −0,2436 | |||
| DASH / DoorDash, Inc. | 0,01 | 449,38 | 2,88 | 462,18 | 0,5237 | 0,3920 | |||
| ITRI / Itron, Inc. | 0,03 | 772,38 | 2,84 | 839,07 | 0,5151 | 0,4501 | |||
| PYPL / PayPal Holdings, Inc. | 0,04 | 73,86 | 2,83 | 29,23 | 0,5130 | −0,0474 | |||
| ADP / Automatic Data Processing, Inc. | 0,01 | 163,88 | 2,81 | 161,92 | 0,5108 | 0,2354 | |||
| INCY / Incyte Corporation | 0,04 | 92,90 | 2,76 | 62,99 | 0,5014 | 0,0671 | |||
| ABNB / Airbnb, Inc. | 0,02 | 2,76 | 0,5008 | 0,5008 | |||||
| BIIB / Biogen Inc. | 0,02 | 247,84 | 2,72 | 142,19 | 0,4930 | 0,2584 | |||
| KLAC / KLA Corporation | 0,00 | 47,21 | 2,71 | 40,12 | 0,4921 | −0,0037 | |||
| NEE / NextEra Energy, Inc. | 0,04 | −6,15 | 2,70 | −12,30 | 0,4909 | −0,2991 | |||
| VEEV / Veeva Systems Inc. | 0,01 | 2,67 | 0,4844 | 0,4844 | |||||
| MSI / Motorola Solutions, Inc. | 0,01 | 11,68 | 2,64 | 4,84 | 0,4800 | −0,1665 | |||
| GRMN / Garmin Ltd. | 0,01 | 341,39 | 2,64 | 282,61 | 0,4794 | 0,3023 | |||
| MCD / McDonald's Corporation | 0,01 | 2,60 | 0,4728 | 0,4728 | |||||
| ZBRA / Zebra Technologies Corporation | 0,01 | 110,22 | 2,51 | 34,26 | 0,4562 | −0,0235 | |||
| MMC / Marsh & McLennan Companies, Inc. | 0,01 | −11,95 | 2,51 | −8,45 | 0,4561 | −0,2473 | |||
| RTX / RTX Corporation | 0,02 | 35,82 | 2,45 | 32,90 | 0,4452 | −0,0279 | |||
| NRZ / New Residential Investment Corp | 0,22 | 2,43 | 0,4405 | 0,4405 | |||||
| AMD / Advanced Micro Devices, Inc. | 0,02 | 10 210,37 | 2,42 | 7 011,76 | 0,4392 | 0,4319 | |||
| EOG / EOG Resources, Inc. | 0,02 | 48,88 | 2,39 | 30,61 | 0,4347 | −0,0352 | |||
| COP / ConocoPhillips | 0,03 | −5,25 | 2,39 | −14,56 | 0,4338 | −0,2829 | |||
| ALRM / Alarm.com Holdings, Inc. | 0,04 | 48,35 | 2,39 | 31,06 | 0,4336 | −0,0335 | |||
| UNP / Union Pacific Corporation | 0,01 | −14,17 | 2,38 | −25,31 | 0,4321 | −0,3845 | |||
| TMUS / T-Mobile US, Inc. | 0,01 | 367,91 | 2,35 | 395,99 | 0,4269 | 0,3054 | |||
| LYFT / Lyft, Inc. | 0,19 | 527,37 | 2,35 | 475,49 | 0,4265 | 0,3217 | |||
| S and P 500 INDX PUT 4150 02/20/2026 / DE (N/A) | 2,27 | 0,4125 | 0,4125 | ||||||
| WMB / The Williams Companies, Inc. | 0,04 | 2,26 | 0,4106 | 0,4106 | |||||
| S and P 500 INDX PUT 3750 03/20/2026 / DE (N/A) | 2,25 | 0,4086 | 0,4086 | ||||||
| GE / General Electric Company | 0,01 | 712,86 | 2,24 | 706,47 | 0,4072 | 0,3358 | |||
| S and P 500 INDX PUT 5330 06/20/2025 / DE (N/A) | 2,20 | 0,3993 | 0,3993 | ||||||
| F / Ford Motor Company | 0,22 | 48,82 | 2,20 | 47,88 | 0,3992 | 0,0179 | |||
| NOC / Northrop Grumman Corporation | 0,00 | −10,83 | 2,09 | −10,97 | 0,3802 | −0,2227 | |||
| ALLE / Allegion plc | 0,02 | 48,80 | 2,09 | 56,08 | 0,3801 | 0,0363 | |||
| CAT / Caterpillar Inc. | 0,01 | 28,82 | 2,09 | 7,30 | 0,3790 | −0,1198 | |||
| AXP / American Express Company | 0,01 | −24,50 | 2,03 | −36,65 | 0,3689 | −0,4530 | |||
| EXEL / Exelixis, Inc. | 0,05 | 12,68 | 1,91 | 33,10 | 0,3468 | −0,0211 | |||
| S and P 500 INDX PUT 5030 07/18/2025 / DE (N/A) | 1,84 | 0,3348 | 0,3348 | ||||||
| FDX / FedEx Corporation | 0,01 | 1,84 | 0,3338 | 0,3338 | |||||
| XPRO / Expro Group Holdings N.V. | 0,01 | 1,79 | 0,3251 | 0,3251 | |||||
| LNG / Cheniere Energy, Inc. | 0,01 | 1,77 | 0,3210 | 0,3210 | |||||
| SPGI / S&P Global Inc. | 0,00 | 45,65 | 1,75 | 39,73 | 0,3175 | −0,0034 | |||
| VZ / Verizon Communications Inc. | 0,04 | 1,74 | 0,3156 | 0,3156 | |||||
| CCI / Crown Castle Inc. | 0,02 | 1 065,33 | 1,69 | 1 286,89 | 0,3072 | 0,2758 | |||
| ABT / Abbott Laboratories | 0,01 | 1,66 | 0,3007 | 0,3007 | |||||
| ZM / Zoom Communications Inc. | 0,02 | −9,32 | 1,63 | −19,15 | 0,2960 | −0,2207 | |||
| NOW / ServiceNow, Inc. | 0,00 | 26,66 | 1,60 | 18,77 | 0,2908 | −0,0548 | |||
| EME / EMCOR Group, Inc. | 0,00 | 265,28 | 1,58 | 227,12 | 0,2870 | 0,1630 | |||
| ALL / The Allstate Corporation | 0,01 | 32,44 | 1,51 | 36,66 | 0,2735 | −0,0091 | |||
| VICI / VICI Properties Inc. | 0,05 | 24,41 | 1,45 | 27,37 | 0,2638 | 0,0189 | |||
| S and P 500 INDX PUT 3450 04/17/2026 / DE (N/A) | 1,40 | 0,2536 | 0,2536 | ||||||
| LIN / Linde plc | 0,00 | 1,39 | 0,2519 | 0,2519 | |||||
| KMI / Kinder Morgan, Inc. | 0,05 | 1,34 | 0,2434 | 0,2434 | |||||
| ESE / ESCO Technologies Inc. | 0,01 | 1,31 | 0,2381 | 0,2381 | |||||
| TMO / Thermo Fisher Scientific Inc. | 0,00 | 37,31 | 1,30 | −1,44 | 0,2356 | −0,1019 | |||
| JCI / Johnson Controls International plc | 0,01 | 1,21 | 0,2196 | 0,2196 | |||||
| CRH / CRH plc | 0,01 | −39,70 | 1,20 | −41,92 | 0,2175 | −0,3109 | |||
| CTRE / CareTrust REIT, Inc. | 0,04 | 175,37 | 1,18 | 204,40 | 0,2134 | 0,1144 | |||
| TAP / Molson Coors Beverage Company | 0,02 | 1,15 | 0,2095 | 0,2095 | |||||
| 0LO4 / Ventas, Inc. | 0,02 | 1,15 | 0,2092 | 0,2092 | |||||
| GAP / The Gap, Inc. | 0,05 | 333,57 | 1,10 | 294,62 | 0,1999 | 0,1284 | |||
| EQIX / Equinix, Inc. | 0,00 | 1,07 | 0,1941 | 0,1941 | |||||
| MSCI / MSCI Inc. | 0,00 | −15,53 | 1,07 | −22,85 | 0,1938 | −0,1608 | |||
| VMI / Valmont Industries, Inc. | 0,00 | 43,77 | 1,06 | 27,11 | 0,1916 | −0,0213 | |||
| TROW / T. Rowe Price Group, Inc. | 0,01 | 47,57 | 0,98 | 11,77 | 0,1776 | −0,0467 | |||
| GBTG / Global Business Travel Group, Inc. | 0,14 | 0,95 | 0,1732 | 0,1732 | |||||
| OXY / Occidental Petroleum Corporation | 0,02 | 213,98 | 0,93 | 165,53 | 0,1692 | 0,0792 | |||
| BBWI / Bath & Body Works, Inc. | 0,03 | −31,04 | 0,93 | −44,07 | 0,1688 | −0,2572 | |||
| HON / Honeywell International Inc. | 0,00 | 0,92 | 0,1669 | 0,1669 | |||||
| GLPI / Gaming and Leisure Properties, Inc. | 0,02 | 0,92 | 0,1667 | 0,1667 | |||||
| EA / Electronic Arts Inc. | 0,01 | 0,90 | 0,1636 | 0,1636 | |||||
| ANF / Abercrombie & Fitch Co. | 0,01 | 65,32 | 0,89 | −3,88 | 0,1620 | −0,0759 | |||
| EXPE / Expedia Group, Inc. | 0,01 | 209,53 | 0,87 | 184,64 | 0,1583 | 0,0797 | |||
| LRCX / Lam Research Corporation | 0,01 | −4,33 | 0,87 | −15,36 | 0,1571 | −0,1050 | |||
| CBOE / Cboe Global Markets, Inc. | 0,00 | 0,86 | 0,1570 | 0,1570 | |||||
| EXC / Exelon Corporation | 0,02 | 0,82 | 0,1493 | 0,1493 | |||||
| CMS / CMS Energy Corporation | 0,01 | 0,82 | 0,1488 | 0,1488 | |||||
| WELL / Welltower Inc. | 0,01 | 0,80 | 0,1448 | 0,1448 | |||||
| SO / The Southern Company | 0,01 | 48,67 | 0,77 | 62,92 | 0,1397 | 0,0185 | |||
| GM / General Motors Company | 0,02 | 0,77 | 0,1392 | 0,1392 | |||||
| TRV / The Travelers Companies, Inc. | 0,00 | −70,96 | 0,75 | −68,84 | 0,1365 | −0,3678 | |||
| CRUS / Cirrus Logic, Inc. | 0,01 | −17,11 | 0,74 | −20,66 | 0,1345 | −0,1051 | |||
| BBY / Best Buy Co., Inc. | 0,01 | 0,71 | 0,1287 | 0,1287 | |||||
| AIT / Applied Industrial Technologies, Inc. | 0,00 | 11,10 | 0,70 | 4,01 | 0,1273 | −0,0456 | |||
| OSK / Oshkosh Corporation | 0,01 | 0,70 | 0,1273 | 0,1273 | |||||
| COMP / Compass, Inc. | 0,09 | 305,85 | 0,68 | 331,65 | 0,1240 | 0,0835 | |||
| BCPC / Balchem Corporation | 0,00 | 0,67 | 0,1220 | 0,1220 | |||||
| MTH / Meritage Homes Corporation | 0,01 | 0,67 | 0,1218 | 0,1218 | |||||
| MWA / Mueller Water Products, Inc. | 0,03 | 0,66 | 0,1198 | 0,1198 | |||||
| GL / Globe Life Inc. | 0,01 | −25,04 | 0,66 | −24,25 | 0,1192 | −0,1030 | |||
| S and P 500 INDX PUT 5240 05/16/2025 / DE (N/A) | 0,57 | 0,1043 | 0,1043 | ||||||
| CNC / Centene Corporation | 0,01 | 46,14 | 0,57 | 36,60 | 0,1037 | −0,0035 | |||
| SPG / Simon Property Group, Inc. | 0,00 | 43,35 | 0,57 | 29,84 | 0,1035 | −0,0091 | |||
| HUM / Humana Inc. | 0,00 | 0,55 | 0,0994 | 0,0994 | |||||
| FTI / TechnipFMC plc | 0,02 | 13,40 | 0,54 | 6,26 | 0,0988 | −0,0324 | |||
| SYF / Synchrony Financial | 0,01 | 0,51 | 0,0930 | 0,0930 | |||||
| OPCH / Option Care Health, Inc. | 0,01 | 46,45 | 0,47 | 52,90 | 0,0862 | 0,0067 | |||
| KO / The Coca-Cola Company | 0,01 | 0,46 | 0,0834 | 0,0834 | |||||
| COKE / Coca-Cola Consolidated, Inc. | 0,00 | 0,39 | 0,0711 | 0,0711 | |||||
| PLTK / Playtika Holding Corp. | 0,07 | 48,83 | 0,36 | 9,54 | 0,0647 | −0,0188 | |||
| SWX / Southwest Gas Holdings, Inc. | 0,00 | 0,35 | 0,0639 | 0,0639 | |||||
| MNST / Monster Beverage Corporation | 0,01 | 0,34 | 0,0611 | 0,0611 | |||||
| AYI / Acuity Inc. | 0,00 | −69,90 | 0,33 | −77,97 | 0,0597 | −0,3221 | |||
| US31635A3032 / Fidelity Securities Lending Cash Central Fund | 0,29 | 0,29 | 0,0533 | 0,0533 | |||||
| MHO / M/I Homes, Inc. | 0,00 | 2 029,46 | 0,25 | 1 714,29 | 0,0462 | 0,0426 | |||
| BAH / Booz Allen Hamilton Holding Corporation | 0,00 | −65,55 | 0,24 | −67,96 | 0,0436 | −0,1484 | |||
| TDC / Teradata Corporation | 0,01 | −76,31 | 0,23 | −84,10 | 0,0425 | −0,3331 | |||
| MMS / Maximus, Inc. | 0,00 | −73,73 | 0,21 | −76,70 | 0,0388 | −0,1957 | |||
| NUE / Nucor Corporation | 0,00 | −78,71 | 0,21 | −80,22 | 0,0387 | −0,2375 | |||
| PPC / Pilgrim's Pride Corporation | 0,00 | 0,19 | 0,0340 | 0,0340 | |||||
| PECO / Phillips Edison & Company, Inc. | 0,01 | 0,18 | 0,0336 | 0,0336 | |||||
| DOCS / Doximity, Inc. | 0,00 | 0,13 | 0,0243 | 0,0243 | |||||
| TSN / Tyson Foods, Inc. | 0,00 | 0,13 | 0,0229 | 0,0229 | |||||
| CALM / Cal-Maine Foods, Inc. | 0,00 | 0,12 | 0,0222 | 0,0222 | |||||
| TWLO / Twilio Inc. | 0,00 | 3,46 | 0,10 | −31,47 | 0,0178 | −0,0191 | |||
| ILMN / Illumina, Inc. | 0,00 | 0,08 | 0,0154 | 0,0154 | |||||
| THC / Tenet Healthcare Corporation | 0,00 | 0,08 | 0,0141 | 0,0141 | |||||
| S and P500 EMINI FUT JUN25 ESM5 / DE (N/A) | 0,07 | 0,0135 | 0,0135 | ||||||
| CVX / Chevron Corporation | 0,00 | −25,04 | 0,07 | −32,08 | 0,0132 | −0,0140 | |||
| YOU / Clear Secure, Inc. | 0,00 | 0,07 | 0,0124 | 0,0124 | |||||
| SAM / The Boston Beer Company, Inc. | 0,00 | −96,73 | 0,03 | −97,17 | 0,0055 | −0,2225 | |||
| TPL / Texas Pacific Land Corporation | 0,00 | 0,03 | 0,0047 | 0,0047 | |||||
| TENB / Tenable Holdings, Inc. | 0,00 | −97,21 | 0,03 | −98,07 | 0,0047 | −0,3280 | |||
| WEN / The Wendy's Company | 0,00 | 0,00 | 0,0001 | 0,0001 | |||||
| DBX / Dropbox, Inc. | 0,00 | −99,65 | 0,00 | −100,00 | 0,0001 | −0,0424 | |||
| OGE / OGE Energy Corp. | 0,00 | 0,00 | 0,00 | 0,0000 | −0,0000 | ||||
| BKNG / Booking Holdings Inc. | 0,00 | −100,00 | 0,00 | −100,00 | −0,2040 | ||||
| RSG / Republic Services, Inc. | 0,00 | −100,00 | 0,00 | −100,00 | −0,0583 | ||||
| CSL / Carlisle Companies Incorporated | 0,00 | −100,00 | 0,00 | −100,00 | −0,0950 |