Grundläggande statistik
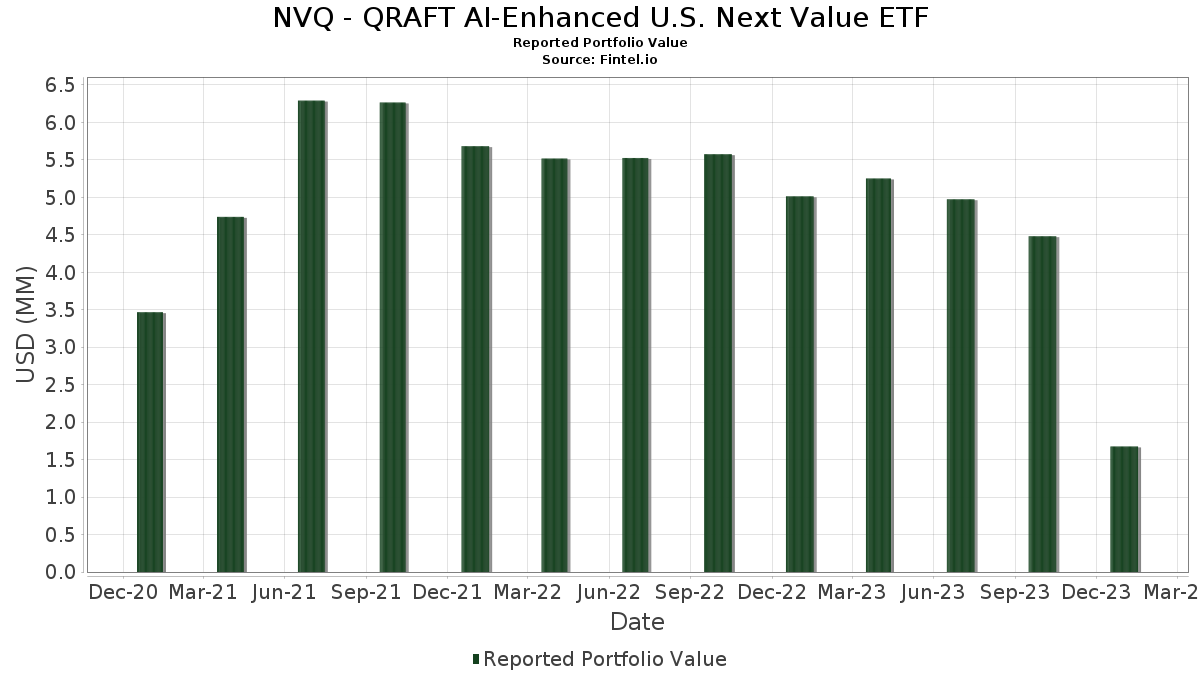
| Portföljvärde | $ 1 675 310 |
| Aktuella positioner | 105 |
Senaste innehav, resultat, förvaltat kapital (från 13F, 13D)
NVQ - QRAFT AI-Enhanced U.S. Next Value ETF har redovisat 105 totala innehav i sina senaste SEC-arkiveringar. Det senaste portföljvärdet beräknas vara $ 1 675 310 USD. Faktiskt förvaltade tillgångar (AUM) är detta värde plus likvida medel (som inte redovisas). NVQ - QRAFT AI-Enhanced U.S. Next Value ETFs största innehav är Booking Holdings Inc. (US:BKNG) , CVS Health Corporation (US:CVS) , Canadian Natural Resources Limited (US:CNQ) , EOG Resources, Inc. (US:EOG) , and Target Corporation (US:TGT) . NVQ - QRAFT AI-Enhanced U.S. Next Value ETFs nya positioner inkluderar Canadian Natural Resources Limited (US:CNQ) , Nutrien Ltd. (CA:NTR) , Range Resources Corporation (US:RRC) , H&R Block, Inc. (US:HRB) , and Alpha Metallurgical Resources, Inc. (US:AMR) .
Största ökningarna detta kvartal
Vi använder förändringen i portföljallokeringen eftersom det är det mest meningsfulla måttet. Förändringar kan bero på transaktioner eller förändringar i aktiekurser.
| Värdepapper | Aktier (MM) |
Värde (MM$) |
Portfölj % av | ΔPortfölj % av |
|---|---|---|---|---|
| 0,00 | 0,12 | 7,2499 | 4,1369 | |
| 0,00 | 0,07 | 4,0886 | 4,0886 | |
| 0,00 | 0,06 | 3,8471 | 2,9891 | |
| 0,00 | 0,05 | 3,2729 | 2,9068 | |
| 0,00 | 0,04 | 2,6328 | 2,2637 | |
| 0,00 | 0,04 | 2,4609 | 2,1218 | |
| 0,00 | 0,04 | 2,5740 | 2,0056 | |
| 0,00 | 0,03 | 1,8119 | 1,8119 | |
| 0,00 | 0,03 | 1,9737 | 1,5886 | |
| 0,00 | 0,02 | 1,5068 | 1,5068 |
Största minskningarna detta kvartal
Vi använder förändringen i portföljallokeringen eftersom det är det mest meningsfulla måttet. Förändringar kan bero på transaktioner eller förändringar i aktiepriser.
| Värdepapper | Aktier (MM) |
Värde (MM$) |
Portfölj % av | ΔPortfölj % av |
|---|---|---|---|---|
| 0,00 | 0,02 | 1,1144 | −5,4020 | |
| 0,00 | 0,03 | 1,9691 | −4,6838 | |
| 0,00 | 0,01 | 0,6269 | −3,4902 | |
| 0,00 | 0,00 | 0,0997 | −2,9501 | |
| 0,00 | 0,00 | 0,3017 | −2,8728 | |
| 0,00 | 0,04 | 2,4769 | −2,3112 | |
| 0,00 | 0,00 | 0,2367 | −1,9752 | |
| 0,00 | 0,00 | 0,2491 | −1,7904 | |
| 0,00 | 0,01 | 0,3844 | −1,6890 | |
| 0,00 | 0,01 | 0,3093 | −1,5796 |
13F- och fond arkiveringar
Denna blankett lämnades in den 2024-03-21 för rapporteringsperioden 2024-01-31. Klicka på länksymbolen för att se hela transaktionshistoriken.
Uppgradera för att låsa upp premiumdata och exportera till Excel![]() .
.
| Värdepapper | Typ | Genomsnittligt aktiepris | Aktier (MM) |
ΔAktier (%) |
ΔAktier (%) |
Värde ($MM) |
Portfölj (%) |
ΔPortfölj (%) |
|
|---|---|---|---|---|---|---|---|---|---|
| BKNG / Booking Holdings Inc. | 0,00 | −32,00 | 0,12 | −14,39 | 7,2499 | 4,1369 | |||
| CVS / CVS Health Corporation | 0,00 | −66,55 | 0,09 | −64,06 | 5,6109 | −0,1035 | |||
| CNQ / Canadian Natural Resources Limited | 0,00 | 0,07 | 4,0886 | 4,0886 | |||||
| EOG / EOG Resources, Inc. | 0,00 | −37,22 | 0,06 | −43,36 | 3,9085 | 1,3725 | |||
| TGT / Target Corporation | 0,00 | 31,12 | 0,06 | 65,79 | 3,8471 | 2,9891 | |||
| MPC / Marathon Petroleum Corporation | 0,00 | −58,45 | 0,06 | −54,35 | 3,8357 | 0,7401 | |||
| PSX / Phillips 66 | 0,00 | −73,09 | 0,06 | −61,29 | 3,7023 | 0,7471 | |||
| NUE / Nucor Corporation | 0,00 | 159,46 | 0,05 | 231,25 | 3,2729 | 2,9068 | |||
| VLO / Valero Energy Corporation | 0,00 | −39,46 | 0,05 | −34,29 | 2,8373 | 1,2641 | |||
| LEN / Lennar Corporation | 0,00 | 86,45 | 0,04 | 168,75 | 2,6328 | 2,2637 | |||
| CTSH / Cognizant Technology Solutions Corporation | 0,00 | 38,99 | 0,04 | 68,00 | 2,5740 | 2,0056 | |||
| CNC / Centene Corporation | 0,00 | −82,60 | 0,04 | −81,31 | 2,4769 | −2,3112 | |||
| BLDR / Builders FirstSource, Inc. | 0,00 | 66,43 | 0,04 | 166,67 | 2,4609 | 2,1218 | |||
| STLD / Steel Dynamics, Inc. | 0,00 | 66,05 | 0,03 | 88,24 | 1,9737 | 1,5886 | |||
| KR / The Kroger Co. | 0,00 | −89,32 | 0,03 | −89,26 | 1,9691 | −4,6838 | |||
| CVE / Cenovus Energy Inc. | 0,00 | 0,03 | 1,8119 | 1,8119 | |||||
| NTR / Nutrien Ltd. | 0,00 | 0,02 | 1,5068 | 1,5068 | |||||
| RS / Reliance, Inc. | 0,00 | −78,09 | 0,02 | −75,51 | 1,4749 | −0,7280 | |||
| COKE / Coca-Cola Consolidated, Inc. | 0,00 | −61,54 | 0,02 | −48,78 | 1,3092 | 0,3859 | |||
| WLK / Westlake Corporation | 0,00 | 0,71 | 0,02 | 18,75 | 1,1859 | 0,8255 | |||
| MUSA / Murphy USA Inc. | 0,00 | −93,54 | 0,02 | −93,81 | 1,1144 | −5,4020 | |||
| COG / Cabot Oil & Gas Corp. | 0,00 | 110,72 | 0,02 | 125,00 | 1,0996 | 0,9315 | |||
| SYF / Synchrony Financial | 0,00 | −19,51 | 0,02 | 13,33 | 1,0823 | 0,7261 | |||
| WIRE / Encore Wire Corporation | 0,00 | −24,21 | 0,02 | 0,00 | 0,9871 | 0,6079 | |||
| BCC / Boise Cascade Company | 0,00 | −29,59 | 0,02 | 6,67 | 0,9800 | 0,6264 | |||
| CHRW / C.H. Robinson Worldwide, Inc. | 0,00 | −73,13 | 0,02 | −72,73 | 0,9355 | −0,3082 | |||
| BBY / Best Buy Co., Inc. | 0,00 | −15,54 | 0,02 | −6,25 | 0,9343 | 0,5599 | |||
| WSM / Williams-Sonoma, Inc. | 0,00 | −32,14 | 0,01 | −12,50 | 0,8935 | 0,5180 | |||
| MLI / Mueller Industries, Inc. | 0,00 | −36,42 | 0,01 | −17,65 | 0,8608 | 0,4703 | |||
| US4039491000 / HF Sinclair Corp. | 0,00 | −32,98 | 0,01 | −30,00 | 0,8586 | 0,3975 | |||
| LSTR / Landstar System, Inc. | 0,00 | −88,56 | 0,01 | −86,87 | 0,8042 | −1,4135 | |||
| TOL / Toll Brothers, Inc. | 0,00 | −44,26 | 0,01 | −18,75 | 0,7912 | 0,4203 | |||
| TPH / Tri Pointe Homes, Inc. | 0,00 | −41,76 | 0,01 | −20,00 | 0,7788 | 0,4225 | |||
| UFPI / UFP Industries, Inc. | 0,00 | −35,29 | 0,01 | −25,00 | 0,7587 | 0,3976 | |||
| ATKR / Atkore Inc. | 0,00 | −30,77 | 0,01 | −14,29 | 0,7511 | 0,4266 | |||
| MOS / The Mosaic Company | 0,00 | −20,86 | 0,01 | −26,67 | 0,7225 | 0,3680 | |||
| MATX / Matson, Inc. | 0,00 | −45,92 | 0,01 | −35,29 | 0,7219 | 0,3411 | |||
| PAG / Penske Automotive Group, Inc. | 0,00 | −23,08 | 0,01 | −21,43 | 0,7216 | 0,3895 | |||
| RHI / Robert Half Inc. | 0,00 | −37,39 | 0,01 | −35,29 | 0,7205 | 0,3233 | |||
| X / United States Steel Corporation | 0,00 | −54,48 | 0,01 | −38,89 | 0,6975 | 0,2921 | |||
| CLF / Cleveland-Cliffs Inc. | 0,00 | −49,64 | 0,01 | −38,89 | 0,6838 | 0,2666 | |||
| MTH / Meritage Homes Corporation | 0,00 | −54,93 | 0,01 | −37,50 | 0,6444 | 0,2830 | |||
| CACI / CACI International Inc | 0,00 | −94,72 | 0,01 | −94,57 | 0,6269 | −3,4902 | |||
| WRK / WestRock Company | 0,00 | −81,53 | 0,01 | −77,78 | 0,6192 | −0,2989 | |||
| DKS / DICK'S Sporting Goods, Inc. | 0,00 | −57,50 | 0,01 | −41,18 | 0,6163 | 0,2343 | |||
| CVCO / Cavco Industries, Inc. | 0,00 | −54,55 | 0,01 | −43,75 | 0,6054 | 0,2378 | |||
| MHO / M/I Homes, Inc. | 0,00 | −62,80 | 0,01 | −43,75 | 0,5965 | 0,2173 | |||
| AN / AutoNation, Inc. | 0,00 | −42,61 | 0,01 | −35,71 | 0,5604 | 0,2265 | |||
| MDC / M.D.C. Holdings, Inc. | 0,00 | −65,64 | 0,01 | −43,75 | 0,5517 | 0,1942 | |||
| LPX / Louisiana-Pacific Corporation | 0,00 | −57,46 | 0,01 | −50,00 | 0,5421 | 0,1816 | |||
| SSD / Simpson Manufacturing Co., Inc. | 0,00 | −57,76 | 0,01 | −46,67 | 0,5392 | 0,1943 | |||
| HUBG / Hub Group, Inc. | 0,00 | −14,41 | 0,01 | −46,67 | 0,5230 | 0,1824 | |||
| PBF / PBF Energy Inc. | 0,00 | −48,62 | 0,01 | −46,67 | 0,5128 | 0,1680 | |||
| ASGN / ASGN Incorporated | 0,00 | −57,75 | 0,01 | −52,94 | 0,5079 | 0,1111 | |||
| JEF / Jefferies Financial Group Inc. | 0,00 | −82,43 | 0,01 | −80,95 | 0,5055 | −0,3544 | |||
| GPI / Group 1 Automotive, Inc. | 0,00 | −52,31 | 0,01 | −50,00 | 0,4901 | 0,1240 | |||
| PATK / Patrick Industries, Inc. | 0,00 | −66,38 | 0,01 | −58,82 | 0,4760 | 0,0869 | |||
| Invesco Government & Agency Portfolio / STIV (000000000) | 0,01 | 0,01 | 0,4757 | 0,4757 | |||||
| Invesco Government & Agency Portfolio / STIV (000000000) | 0,01 | 0,01 | 0,4757 | 0,4757 | |||||
| Invesco Government & Agency Portfolio / STIV (000000000) | 0,01 | 0,01 | 0,4757 | 0,4757 | |||||
| Invesco Government & Agency Portfolio / STIV (000000000) | 0,01 | 0,01 | 0,4757 | 0,4757 | |||||
| Invesco Government & Agency Portfolio / STIV (000000000) | 0,01 | 0,01 | 0,4757 | 0,4757 | |||||
| RRC / Range Resources Corporation | 0,00 | 0,01 | 0,4626 | 0,4626 | |||||
| ABG / Asbury Automotive Group, Inc. | 0,00 | −53,95 | 0,01 | −50,00 | 0,4448 | 0,1202 | |||
| GRBK / Green Brick Partners, Inc. | 0,00 | −66,83 | 0,01 | −56,25 | 0,4409 | 0,0789 | |||
| CCS / Century Communities, Inc. | 0,00 | −68,20 | 0,01 | −56,25 | 0,4375 | 0,0792 | |||
| OLN / Olin Corporation | 0,00 | −60,34 | 0,01 | −50,00 | 0,4368 | 0,1050 | |||
| BECN / Beacon Roofing Supply, Inc. | 0,00 | −63,72 | 0,01 | −62,50 | 0,4132 | 0,0542 | |||
| AMG / Affiliated Managers Group, Inc. | 0,00 | −66,42 | 0,01 | −62,50 | 0,4072 | 0,0400 | |||
| AMN / AMN Healthcare Services, Inc. | 0,00 | −86,45 | 0,01 | −87,76 | 0,4004 | −0,7120 | |||
| DDS / Dillard's, Inc. | 0,00 | −67,92 | 0,01 | −62,50 | 0,4002 | 0,0330 | |||
| HRB / H&R Block, Inc. | 0,00 | 0,01 | 0,3958 | 0,3958 | |||||
| KFY / Korn Ferry | 0,00 | −70,03 | 0,01 | −62,50 | 0,3923 | 0,0195 | |||
| CLS / Celestica Inc. | 0,00 | 0,01 | 0,3885 | 0,3885 | |||||
| GEF.B / Greif, Inc. | 0,00 | −93,10 | 0,01 | −93,48 | 0,3844 | −1,6890 | |||
| CIVI / Civitas Resources, Inc. | 0,00 | 0,01 | 0,3782 | 0,3782 | |||||
| NXST / Nexstar Media Group, Inc. | 0,00 | −71,07 | 0,01 | −62,50 | 0,3781 | −0,0002 | |||
| ICL / ICL Group Ltd | 0,00 | −56,61 | 0,01 | −60,00 | 0,3765 | 0,0383 | |||
| STRL / Sterling Infrastructure, Inc. | 0,00 | −66,24 | 0,01 | −64,71 | 0,3653 | −0,0201 | |||
| THO / THOR Industries, Inc. | 0,00 | −71,04 | 0,01 | −68,75 | 0,3642 | 0,0050 | |||
| AMR / Alpha Metallurgical Resources, Inc. | 0,00 | 0,01 | 0,3641 | 0,3641 | |||||
| TMHC / Taylor Morrison Home Corporation | 0,00 | 78,12 | 0,01 | 66,67 | 0,3614 | 0,2990 | |||
| ANF / Abercrombie & Fitch Co. | 0,00 | −82,20 | 0,01 | −72,22 | 0,3407 | −0,0787 | |||
| SFM / Sprouts Farmers Market, Inc. | 0,00 | −94,99 | 0,01 | −94,05 | 0,3093 | −1,5796 | |||
| SIG / Signet Jewelers Limited | 0,00 | −79,34 | 0,00 | −75,00 | 0,3024 | −0,0748 | |||
| LOPE / Grand Canyon Education, Inc. | 0,00 | −96,84 | 0,00 | −97,18 | 0,3017 | −2,8728 | |||
| ANDE / The Andersons, Inc. | 0,00 | −72,78 | 0,00 | −75,00 | 0,2948 | −0,0834 | |||
| VLY / Valley National Bancorp | 0,00 | 173,08 | 0,00 | 300,00 | 0,2907 | 0,2531 | |||
| DFIN / Donnelley Financial Solutions, Inc. | 0,00 | −75,73 | 0,00 | −75,00 | 0,2832 | −0,0921 | |||
| LCII / LCI Industries | 0,00 | −75,00 | 0,00 | −75,00 | 0,2503 | −0,1081 | |||
| ARLP / Alliance Resource Partners, L.P. - Limited Partnership | 0,00 | −95,15 | 0,00 | −95,60 | 0,2491 | −1,7904 | |||
| ICFI / ICF International, Inc. | 0,00 | −96,42 | 0,00 | −96,97 | 0,2367 | −1,9752 | |||
| MEOH / Methanex Corporation | 0,00 | 0,00 | 0,2263 | 0,2263 | |||||
| HCC / Warrior Met Coal, Inc. | 0,00 | 0,00 | 0,2146 | 0,2146 | |||||
| SHOO / Steven Madden, Ltd. | 0,00 | −84,85 | 0,00 | −82,35 | 0,2113 | −0,1897 | |||
| CEIX / CONSOL Energy Inc. | 0,00 | 0,00 | 0,1725 | 0,1725 | |||||
| BKE / The Buckle, Inc. | 0,00 | −96,12 | 0,00 | −96,97 | 0,1718 | −1,3062 | |||
| SBLK / Star Bulk Carriers Corp. | 0,00 | 63,29 | 0,00 | 100,00 | 0,1705 | 0,1417 | |||
| WGO / Winnebago Industries, Inc. | 0,00 | −85,67 | 0,00 | −87,50 | 0,1678 | −0,2112 | |||
| FL / Foot Locker, Inc. | 0,00 | 82,69 | 0,00 | 100,00 | 0,1626 | 0,1345 | |||
| UPBD / Upbound Group, Inc. | 0,00 | −87,82 | 0,00 | −86,67 | 0,1453 | −0,1984 | |||
| EXPI / eXp World Holdings, Inc. | 0,00 | −84,98 | 0,00 | −92,86 | 0,1212 | −0,1963 | |||
| LPG / Dorian LPG Ltd. | 0,00 | 0,00 | 0,1093 | 0,1093 | |||||
| VET / Vermilion Energy Inc. | 0,00 | 0,00 | 0,1047 | 0,1047 | |||||
| WMK / Weis Markets, Inc. | 0,00 | −98,71 | 0,00 | −99,26 | 0,0997 | −2,9501 | |||
| VSH / Vishay Intertechnology, Inc. | 0,00 | −100,00 | 0,00 | −100,00 | −0,3495 | ||||
| WTS / Watts Water Technologies, Inc. | 0,00 | −100,00 | 0,00 | −100,00 | −0,3900 | ||||
| OXM / Oxford Industries, Inc. | 0,00 | −100,00 | 0,00 | −100,00 | −0,3410 | ||||
| DIOD / Diodes Incorporated | 0,00 | −100,00 | 0,00 | −100,00 | −0,3210 | ||||
| GMS / GMS Inc. | 0,00 | −100,00 | 0,00 | −100,00 | −0,3550 | ||||
| ACLS / Axcelis Technologies, Inc. | 0,00 | −100,00 | 0,00 | −100,00 | −0,3045 | ||||
| MAN / ManpowerGroup Inc. | 0,00 | −100,00 | 0,00 | −100,00 | −0,3701 |