Grundläggande statistik
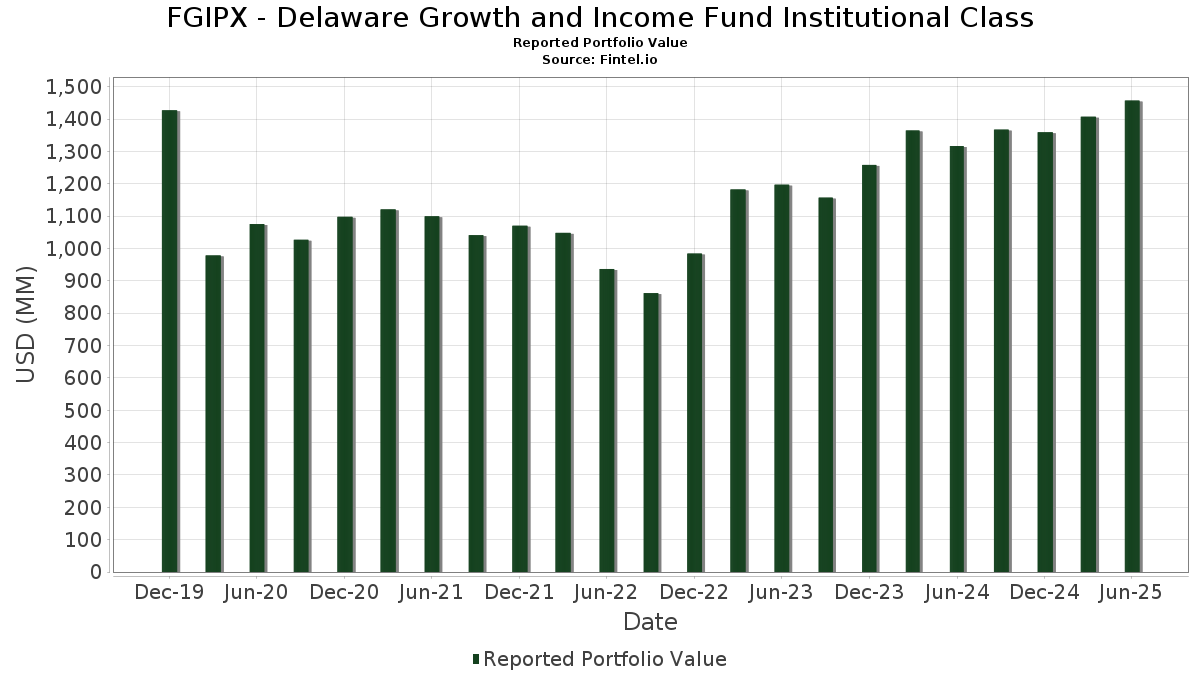
| Portföljvärde | $ 1 457 350 315 |
| Aktuella positioner | 58 |
Senaste innehav, resultat, förvaltat kapital (från 13F, 13D)
FGIPX - Delaware Growth and Income Fund Institutional Class har redovisat 58 totala innehav i sina senaste SEC-arkiveringar. Det senaste portföljvärdet beräknas vara $ 1 457 350 315 USD. Faktiskt förvaltade tillgångar (AUM) är detta värde plus likvida medel (som inte redovisas). FGIPX - Delaware Growth and Income Fund Institutional Classs största innehav är Cisco Systems, Inc. (US:CSCO) , Exxon Mobil Corporation (US:XOM) , Philip Morris International Inc. (US:PM) , Citigroup Inc. - Corporate Bond/Note (US:C) , and Gilead Sciences, Inc. (US:GILD) . FGIPX - Delaware Growth and Income Fund Institutional Classs nya positioner inkluderar Popular, Inc. (US:BPOP) , AppLovin Corporation (US:APP) , United Airlines Holdings, Inc. (US:UAL) , Janus Henderson Group plc (US:JHG) , and .
Största ökningarna detta kvartal
Vi använder förändringen i portföljallokeringen eftersom det är det mest meningsfulla måttet. Förändringar kan bero på transaktioner eller förändringar i aktiekurser.
| Värdepapper | Aktier (MM) |
Värde (MM$) |
Portfölj % av | ΔPortfölj % av |
|---|---|---|---|---|
| 0,29 | 32,23 | 2,2107 | 2,2107 | |
| 0,63 | 53,24 | 3,6522 | 1,9918 | |
| 0,01 | 45,81 | 3,1425 | 1,5142 | |
| 0,33 | 33,53 | 2,3003 | 1,2119 | |
| 0,47 | 18,09 | 1,2408 | 0,8642 | |
| 0,03 | 9,90 | 0,6793 | 0,6793 | |
| 0,13 | 33,94 | 2,3284 | 0,6545 | |
| 0,06 | 42,81 | 2,9365 | 0,6437 | |
| 1,03 | 71,41 | 4,8985 | 0,3871 | |
| 0,06 | 4,78 | 0,3277 | 0,3277 |
Största minskningarna detta kvartal
Vi använder förändringen i portföljallokeringen eftersom det är det mest meningsfulla måttet. Förändringar kan bero på transaktioner eller förändringar i aktiepriser.
| Värdepapper | Aktier (MM) |
Värde (MM$) |
Portfölj % av | ΔPortfölj % av |
|---|---|---|---|---|
| 0,59 | 63,49 | 4,3552 | −1,0659 | |
| 0,47 | 51,96 | 3,5646 | −1,0227 | |
| 0,92 | 42,63 | 2,9240 | −0,9308 | |
| 0,03 | 12,02 | 0,8244 | −0,9025 | |
| 0,33 | 60,36 | 4,1403 | −0,5421 | |
| 0,06 | 46,77 | 3,2081 | −0,5226 | |
| 0,22 | 19,91 | 1,3655 | −0,5142 | |
| 0,14 | 47,03 | 3,2261 | −0,4667 | |
| 0,41 | 32,20 | 2,2087 | −0,3845 | |
| 0,00 | 0,00 | −0,3545 |
13F- och fond arkiveringar
Denna blankett lämnades in den 2025-08-27 för rapporteringsperioden 2025-06-30. Klicka på länksymbolen för att se hela transaktionshistoriken.
Uppgradera för att låsa upp premiumdata och exportera till Excel![]() .
.
| Värdepapper | Typ | Genomsnittligt aktiepris | Aktier (MM) |
ΔAktier (%) |
ΔAktier (%) |
Värde ($MM) |
Portfölj (%) |
ΔPortfölj (%) |
|
|---|---|---|---|---|---|---|---|---|---|
| CSCO / Cisco Systems, Inc. | 1,03 | 0,00 | 71,41 | 12,43 | 4,8985 | 0,3871 | |||
| XOM / Exxon Mobil Corporation | 0,59 | −8,23 | 63,49 | −16,81 | 4,3552 | −1,0659 | |||
| PM / Philip Morris International Inc. | 0,33 | −20,21 | 60,36 | −8,44 | 4,1403 | −0,5421 | |||
| C / Citigroup Inc. - Corporate Bond/Note | 0,63 | 89,95 | 53,24 | 127,76 | 3,6522 | 1,9918 | |||
| GILD / Gilead Sciences, Inc. | 0,47 | −18,68 | 51,96 | −19,54 | 3,5646 | −1,0227 | |||
| CVS / CVS Health Corporation | 0,74 | −2,78 | 51,17 | −1,02 | 3,5098 | −0,1617 | |||
| CI / The Cigna Group | 0,14 | −9,97 | 47,03 | −9,54 | 3,2261 | −0,4667 | |||
| MCK / McKesson Corporation | 0,06 | −18,23 | 46,77 | −10,96 | 3,2081 | −0,5226 | |||
| BKNG / Booking Holdings Inc. | 0,01 | 59,02 | 45,81 | 99,84 | 3,1425 | 1,5142 | |||
| META / Meta Platforms, Inc. | 0,06 | 3,56 | 42,81 | 32,62 | 2,9365 | 0,6437 | |||
| BMY / Bristol-Myers Squibb Company | 0,92 | 3,48 | 42,63 | −21,46 | 2,9240 | −0,9308 | |||
| WFC / Wells Fargo & Company | 0,52 | 4,19 | 41,33 | 16,28 | 2,8351 | 0,3104 | |||
| PNC / The PNC Financial Services Group, Inc. | 0,21 | 8,52 | 39,75 | 15,09 | 2,7267 | 0,2736 | |||
| TJX / The TJX Companies, Inc. | 0,30 | 7,92 | 37,32 | 9,42 | 2,5599 | 0,1375 | |||
| VZ / Verizon Communications Inc. | 0,83 | 0,00 | 35,82 | −4,61 | 2,4572 | −0,2100 | |||
| T / AT&T Inc. | 1,22 | 0,00 | 35,43 | 2,33 | 2,4303 | −0,0287 | |||
| EVR / Evercore Inc. | 0,13 | 6,53 | 33,94 | 44,03 | 2,3284 | 0,6545 | |||
| UPS / United Parcel Service, Inc. | 0,33 | 138,46 | 33,53 | 118,84 | 2,3003 | 1,2119 | |||
| MET / MetLife, Inc. | 0,41 | 9,85 | 32,63 | 10,03 | 2,2384 | 0,1319 | |||
| MU / Micron Technology, Inc. | 0,26 | −33,17 | 32,53 | −5,20 | 2,2313 | −0,2058 | |||
| BPOP / Popular, Inc. | 0,29 | 32,23 | 2,2107 | 2,2107 | |||||
| MRK / Merck & Co., Inc. | 0,41 | 0,00 | 32,20 | −11,81 | 2,2087 | −0,3845 | |||
| CMCSA / Comcast Corporation | 0,83 | 0,00 | 29,79 | −3,28 | 2,0437 | −0,1442 | |||
| TFC / Truist Financial Corporation | 0,67 | −15,56 | 28,97 | −11,78 | 1,9872 | −0,3452 | |||
| MO / Altria Group, Inc. | 0,48 | 0,00 | 28,11 | −2,32 | 1,9281 | −0,1157 | |||
| GOOGL / Alphabet Inc. | 0,15 | −5,11 | 27,30 | 8,14 | 1,8725 | 0,0796 | |||
| OMF / OneMain Holdings, Inc. | 0,48 | 0,00 | 27,16 | 16,61 | 1,8631 | 0,2088 | |||
| LMT / Lockheed Martin Corporation | 0,05 | −5,57 | 24,78 | −2,10 | 1,7001 | −0,0980 | |||
| US21871X1090 / Corebridge Financial, Inc. | 0,62 | 0,00 | 22,12 | 12,45 | 1,5170 | 0,1201 | |||
| QCOM / QUALCOMM Incorporated | 0,13 | 0,59 | 20,94 | 4,29 | 1,4364 | 0,0103 | |||
| BK / The Bank of New York Mellon Corporation | 0,22 | −30,76 | 19,91 | −24,78 | 1,3655 | −0,5142 | |||
| MMM / 3M Company | 0,13 | −7,07 | 19,20 | −3,66 | 1,3171 | −0,0985 | |||
| ORI / Old Republic International Corporation | 0,47 | 248,08 | 18,09 | 241,15 | 1,2408 | 0,8642 | |||
| AIG / American International Group, Inc. | 0,21 | 0,00 | 18,04 | −1,55 | 1,2371 | −0,0640 | |||
| DDS / Dillard's, Inc. | 0,04 | 0,00 | 17,08 | 16,67 | 1,1713 | 0,1318 | |||
| IVZ / Invesco Ltd. | 1,00 | 10,97 | 15,73 | 15,36 | 1,0793 | 0,1106 | |||
| WU / The Western Union Company | 1,71 | 0,00 | 14,44 | −20,41 | 0,9903 | −0,2981 | |||
| FNF / Fidelity National Financial, Inc. | 0,24 | 0,00 | 13,70 | −13,86 | 0,9397 | −0,1899 | |||
| LRCX / Lam Research Corporation | 0,13 | 20,24 | 12,37 | 61,01 | 0,8483 | 0,3027 | |||
| MSI / Motorola Solutions, Inc. | 0,03 | −48,53 | 12,02 | −50,57 | 0,8244 | −0,9025 | |||
| TT / Trane Technologies plc | 0,03 | 17,07 | 11,92 | 51,98 | 0,8177 | 0,2606 | |||
| GM / General Motors Company | 0,24 | 0,00 | 11,86 | 4,63 | 0,8138 | 0,0085 | |||
| APP / AppLovin Corporation | 0,03 | 9,90 | 0,6793 | 0,6793 | |||||
| US61747C7074 / Morgan Stanley Institutional Liquidity Funds Government Portfolio, Institutional Class | 9,05 | 93,49 | 9,05 | 93,50 | 0,6208 | 0,2886 | |||
| TFDXX / Blackrock Liquidity Funds - BlackRock Liquidity Funds FedFund Portfolio Institutional Class | 9,05 | 93,49 | 9,05 | 93,50 | 0,6208 | 0,2886 | |||
| US38141W2733 / Goldman Sachs Financial Square Funds - Government Fund | 9,05 | 93,49 | 9,05 | 93,50 | 0,6208 | 0,2886 | |||
| FIGXX / Fidelity Colchester Street Trust - Fidelity Institutional Money Market Funds Government Portfolio Class I | 9,05 | 93,49 | 9,05 | 93,50 | 0,6208 | 0,2886 | |||
| FIX / Comfort Systems USA, Inc. | 0,02 | 0,00 | 8,90 | 66,34 | 0,6103 | 0,2304 | |||
| LEG / Leggett & Platt, Incorporated | 0,93 | 42,09 | 8,28 | 60,24 | 0,5678 | 0,2009 | |||
| EME / EMCOR Group, Inc. | 0,01 | 0,00 | 5,79 | 44,71 | 0,3972 | 0,1130 | |||
| SYF / Synchrony Financial | 0,09 | 0,00 | 5,78 | 26,08 | 0,3966 | 0,0709 | |||
| UAL / United Airlines Holdings, Inc. | 0,06 | 4,78 | 0,3277 | 0,3277 | |||||
| DAL / Delta Air Lines, Inc. | 0,09 | 0,00 | 4,37 | 12,79 | 0,2995 | 0,0246 | |||
| JHG / Janus Henderson Group plc | 0,11 | 4,27 | 0,2931 | 0,2931 | |||||
| LOW / Lowe's Companies, Inc. | 0,02 | −24,31 | 3,91 | −28,01 | 0,2682 | −0,1175 | |||
| BRK.B / Berkshire Hathaway Inc. | 0,01 | 0,00 | 3,77 | −8,80 | 0,2588 | −0,0350 | |||
| NWL / Newell Brands Inc. | 0,69 | 0,00 | 3,72 | −12,90 | 0,2552 | −0,0482 | |||
| FG / F&G Annuities & Life, Inc. | 0,02 | 0,00 | 0,79 | −11,30 | 0,0544 | −0,0091 | |||
| HON / Honeywell International Inc. | 0,00 | −100,00 | 0,00 | −100,00 | −0,3545 | ||||
| CIVI / Civitas Resources, Inc. | 0,00 | −100,00 | 0,00 | −100,00 | −0,2871 | ||||
| AVGO / Broadcom Inc. | 0,00 | −100,00 | 0,00 | −100,00 | −0,0096 |