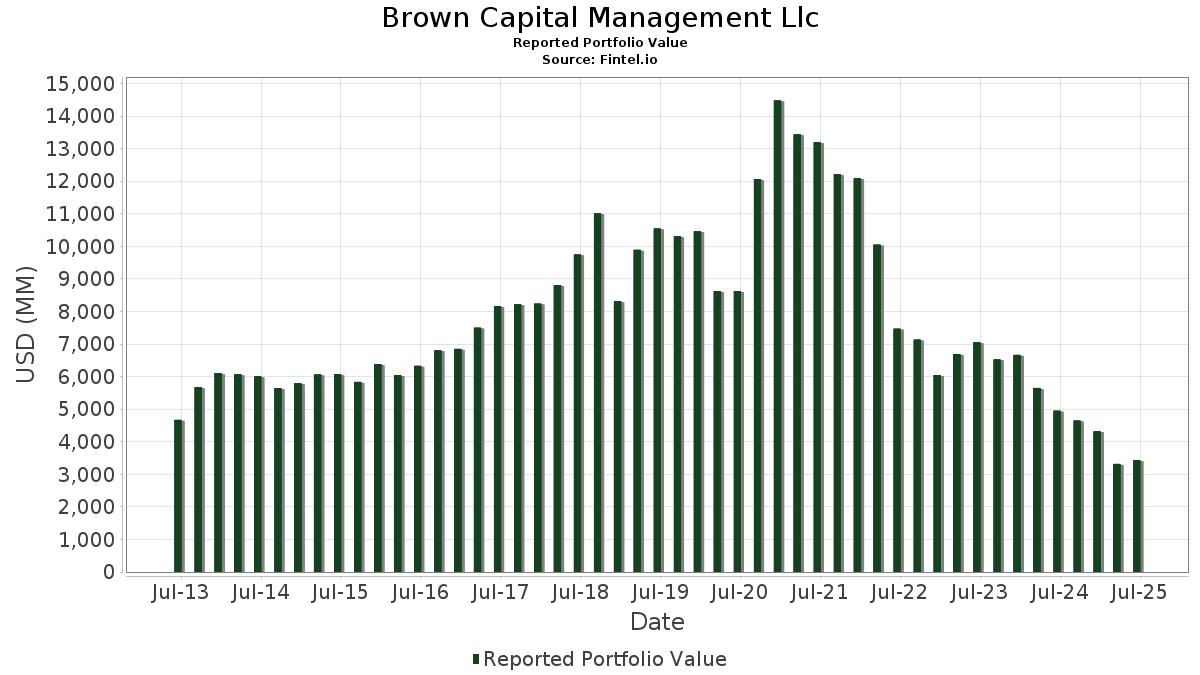
Grundläggande statistik
| Portföljvärde | $ 3 438 158 952 |
| Aktuella positioner | 83 |
Senaste innehav, resultat, förvaltat kapital (från 13F, 13D)
Brown Capital Management Llc har redovisat 83 totala innehav i sina senaste SEC-arkiveringar. Det senaste portföljvärdet beräknas vara $ 3 438 158 952 USD. Faktiskt förvaltade tillgångar (AUM) är detta värde plus likvida medel (som inte redovisas). Brown Capital Management Llcs största innehav är CyberArk Software Ltd. (US:CYBR) , Veeva Systems Inc. (US:VEEV) , Guidewire Software, Inc. (US:GWRE) , Datadog, Inc. (US:DDOG) , and Tyler Technologies, Inc. (US:TYL) . Brown Capital Management Llcs främsta industrier är "Home Furniture, Furnishings, And Equipment Stores" (sic 57) , "Petroleum Refining And Related Industries" (sic 29) , and "General Merchandise Stores" (sic 53) .
Största ökningarna detta kvartal
Vi använder förändringen i portföljallokeringen eftersom det är det mest meningsfulla måttet. Förändringar kan bero på transaktioner eller förändringar i aktiekurser.
| Värdepapper | Aktier (MM) |
Värde (MM$) |
Portfölj % av | ΔPortfölj % av |
|---|---|---|---|---|
| 0,59 | 242,05 | 7,0400 | 0,9720 | |
| 1,14 | 96,41 | 2,8041 | 0,8573 | |
| 0,45 | 60,49 | 1,7593 | 0,8100 | |
| 1,13 | 152,24 | 4,4279 | 0,7903 | |
| 1,43 | 50,47 | 1,4680 | 0,7664 | |
| 0,65 | 73,96 | 2,1513 | 0,7447 | |
| 2,94 | 99,46 | 2,8929 | 0,5544 | |
| 0,28 | 79,55 | 2,3137 | 0,4499 | |
| 6,56 | 58,39 | 1,6983 | 0,4228 | |
| 3,20 | 70,17 | 2,0409 | 0,3666 |
Största minskningarna detta kvartal
Vi använder förändringen i portföljallokeringen eftersom det är det mest meningsfulla måttet. Förändringar kan bero på transaktioner eller förändringar i aktiepriser.
| Värdepapper | Aktier (MM) |
Värde (MM$) |
Portfölj % av | ΔPortfölj % av |
|---|---|---|---|---|
| 1,57 | 80,96 | 2,3548 | −0,5936 | |
| 2,81 | 119,65 | 3,4801 | −0,3961 | |
| 0,24 | 141,92 | 4,1278 | −0,3668 | |
| 2,48 | 31,69 | 0,9216 | −0,3217 | |
| 0,28 | 99,84 | 2,9038 | −0,3168 | |
| 0,37 | 47,68 | 1,3869 | −0,3047 | |
| 1,12 | 14,55 | 0,4232 | −0,2978 | |
| 1,56 | 33,44 | 0,9726 | −0,2676 | |
| 1,70 | 96,37 | 2,8030 | −0,2098 | |
| 0,18 | 26,11 | 0,7595 | −0,2007 |
13D/G-arkiveringar
Detta är en lista över 13D- och 13G-arkiveringar som gjorts under det senaste året (om några). Klicka på länken för att se hela transaktionshistoriken. Gröna rader indikerar nya positioner. Röda rader indikerar stängda positioner.
| Fil Datum | Formulär | Värdepapper | Föregående aktier |
Aktuella aktier |
ΔAktier % | % Ägande |
% ΔÄgande | |
|---|---|---|---|---|---|---|---|---|
| 2025-08-13 | XMTR / Xometry, Inc. | 3 446 223 | 2 943 593 | −14,58 | 5,98 | −16,60 | ||
| 2025-08-13 | CYRX / Cryoport, Inc. | 4 458 774 | 3 798 962 | −14,80 | 7,58 | −15,96 | ||
| 2025-05-15 | CTKB / Cytek Biosciences, Inc. | 9 493 474 | 7 463 967 | −21,38 | 5,89 | −18,42 | ||
| 2025-05-15 | ENFN / Enfusion, Inc. | 7 873 643 | 5 143 042 | −34,68 | 5,43 | −35,74 | ||
| 2025-05-15 | INGN / Inogen, Inc. | 1 560 409 | 0 | −100,00 | 0,00 | −100,00 | ||
| 2025-05-15 | VCEL / Vericel Corporation | 3 235 731 | 3 235 731 | 0,00 | 6,56 | 0,00 | ||
| 2025-05-15 | OLO / Olo Inc. | 8 022 158 | 8 022 158 | 0,00 | 7,18 | 0,00 | ||
| 2025-05-15 | ERII / Energy Recovery, Inc. | 1 530 748 | 2 919 453 | 90,72 | 5,04 | 9,57 | ||
| 2025-05-15 | KIDS / OrthoPediatrics Corp. | 1 882 405 | 1 882 405 | 0,00 | 7,77 | 0,00 | ||
| 2025-05-15 | ALRM / Alarm.com Holdings, Inc. | 2 392 630 | 2 392 630 | 0,00 | 4,84 | 0,00 | ||
| 2024-11-14 | GKOS / Glaukos Corporation | 2 697 794 | 1 634 591 | −39,41 | 2,97 | −46,29 | ||
| 2024-11-14 | APPF / AppFolio, Inc. | 1 585 560 | 804 645 | −49,25 | 3,50 | −52,25 | ||
| 2024-11-14 | HLIO / Helios Technologies, Inc. | 3 114 144 | 1 813 404 | −41,77 | 5,46 | −42,04 |
13F- och fond arkiveringar
Denna blankett lämnades in den 2025-08-13 för rapporteringsperioden 2025-06-30. Klicka på länksymbolen för att se hela transaktionshistoriken.
Uppgradera för att låsa upp premiumdata och exportera till Excel![]() .
.
| Värdepapper | Typ | Genomsnittligt aktiepris | Aktier (MM) |
ΔAktier (%) |
ΔAktier (%) |
Värde ($MM) |
Portfölj (%) |
ΔPortfölj (%) |
|
|---|---|---|---|---|---|---|---|---|---|
| CYBR / CyberArk Software Ltd. | 0,59 | −0,12 | 242,05 | 20,23 | 7,0400 | 0,9720 | |||
| VEEV / Veeva Systems Inc. | 0,56 | −14,81 | 160,36 | 5,91 | 4,6642 | 0,1004 | |||
| GWRE / Guidewire Software, Inc. | 0,65 | −15,63 | 152,83 | 6,02 | 4,4452 | 0,1003 | |||
| DDOG / Datadog, Inc. | 1,13 | −6,84 | 152,24 | 26,14 | 4,4279 | 0,7903 | |||
| TYL / Tyler Technologies, Inc. | 0,24 | −6,67 | 141,92 | −4,83 | 4,1278 | −0,3668 | |||
| APPF / AppFolio, Inc. | 0,58 | −5,41 | 133,27 | −0,94 | 3,8763 | −0,1789 | |||
| MANH / Manhattan Associates, Inc. | 0,65 | −4,30 | 128,01 | 9,21 | 3,7231 | 0,1902 | |||
| RGEN / Repligen Corporation | 1,01 | 16,35 | 125,04 | 13,73 | 3,6367 | 0,3230 | |||
| VCEL / Vericel Corporation | 2,81 | −2,43 | 119,65 | −6,96 | 3,4801 | −0,3961 | |||
| GKOS / Glaukos Corporation | 1,14 | −4,48 | 117,66 | 0,24 | 3,4222 | −0,1156 | |||
| PAYC / Paycom Software, Inc. | 0,47 | −5,86 | 109,84 | −0,29 | 3,1946 | −0,1255 | |||
| QTWO / Q2 Holdings, Inc. | 1,15 | −7,52 | 107,97 | 8,17 | 3,1403 | 0,1319 | |||
| ANSS / ANSYS, Inc. | 0,28 | −15,78 | 99,84 | −6,56 | 2,9038 | −0,3168 | |||
| XMTR / Xometry, Inc. | 2,94 | −5,45 | 99,46 | 28,20 | 2,8929 | 0,5544 | |||
| CAMT / Camtek Ltd. | 1,14 | 3,49 | 96,41 | 49,27 | 2,8041 | 0,8573 | |||
| ALRM / Alarm.com Holdings, Inc. | 1,70 | −5,16 | 96,37 | −3,59 | 2,8030 | −0,2098 | |||
| TECH / Bio-Techne Corporation | 1,57 | −5,68 | 80,96 | −17,23 | 2,3548 | −0,5936 | |||
| FLUT / Flutter Entertainment plc | 0,28 | −0,26 | 79,55 | 28,65 | 2,3137 | 0,4499 | |||
| AGYS / Agilysys, Inc. | 0,65 | 0,29 | 73,96 | 58,49 | 2,1513 | 0,7447 | |||
| GLBE / Global-E Online Ltd. | 2,17 | 1,61 | 72,90 | −4,40 | 2,1203 | −0,1782 | |||
| CGNX / Cognex Corporation | 2,27 | −5,31 | 71,87 | 0,69 | 2,0904 | −0,0610 | |||
| CWAN / Clearwater Analytics Holdings, Inc. | 3,20 | 54,37 | 70,17 | 26,32 | 2,0409 | 0,3666 | |||
| MELI / MercadoLibre, Inc. | 0,02 | −9,14 | 63,67 | 21,73 | 1,8520 | 0,2753 | |||
| TMDX / TransMedics Group, Inc. | 0,45 | −3,58 | 60,49 | 92,06 | 1,7593 | 0,8100 | |||
| OLO / Olo Inc. | 6,56 | −6,36 | 58,39 | 37,98 | 1,6983 | 0,4228 | |||
| NCNO / nCino, Inc. | 2,06 | −5,53 | 57,61 | −3,81 | 1,6757 | −0,1296 | |||
| VERX / Vertex, Inc. | 1,43 | 114,85 | 50,47 | 116,84 | 1,4680 | 0,7664 | |||
| WK / Workiva Inc. | 0,70 | 0,94 | 48,05 | −8,98 | 1,3976 | −0,1936 | |||
| SHOP / Shopify Inc. | 0,42 | −1,87 | 47,96 | 18,66 | 1,3949 | 0,1767 | |||
| INSP / Inspire Medical Systems, Inc. | 0,37 | 4,29 | 47,68 | −15,04 | 1,3869 | −0,3047 | |||
| UFPT / UFP Technologies, Inc. | 0,17 | 11,41 | 41,71 | 34,86 | 1,2130 | 0,2809 | |||
| BMI / Badger Meter, Inc. | 0,16 | 15,77 | 40,09 | 49,06 | 1,1661 | 0,3554 | |||
| SPSC / SPS Commerce, Inc. | 0,26 | −2,06 | 35,56 | 0,42 | 1,0343 | −0,0331 | |||
| KIDS / OrthoPediatrics Corp. | 1,56 | −6,81 | 33,44 | −18,73 | 0,9726 | −0,2676 | |||
| DUOL / Duolingo, Inc. | 0,08 | 3,95 | 32,47 | 37,24 | 0,9444 | 0,2313 | |||
| MNDY / monday.com Ltd. | 0,10 | −1,47 | 32,08 | 27,42 | 0,9331 | 0,1742 | |||
| DV / DoubleVerify Holdings, Inc. | 2,13 | −5,10 | 31,85 | 6,25 | 0,9263 | 0,0229 | |||
| ERII / Energy Recovery, Inc. | 2,48 | −4,49 | 31,69 | −23,19 | 0,9216 | −0,3217 | |||
| CYRX / Cryoport, Inc. | 3,80 | −6,28 | 28,34 | 14,99 | 0,8243 | 0,0814 | |||
| ICLR / ICON Public Limited Company | 0,18 | −1,39 | 26,11 | −18,03 | 0,7595 | −0,2007 | |||
| CTKB / Cytek Biosciences, Inc. | 7,11 | −4,74 | 24,17 | −19,23 | 0,7031 | −0,1990 | |||
| RDVT / Red Violet, Inc. | 0,47 | 31,31 | 23,09 | 71,87 | 0,6716 | 0,2667 | |||
| TEAM / Atlassian Corporation | 0,11 | −1,57 | 22,09 | −5,80 | 0,6424 | −0,0643 | |||
| CHKP / Check Point Software Technologies Ltd. | 0,07 | −1,57 | 14,65 | −4,46 | 0,4260 | −0,0360 | |||
| RXST / RxSight, Inc. | 1,12 | 18,15 | 14,55 | −39,17 | 0,4232 | −0,2978 | |||
| TNDM / Tandem Diabetes Care, Inc. | 0,55 | −6,74 | 10,27 | −9,26 | 0,2988 | −0,0425 | |||
| PRO / PROS Holdings, Inc. | 0,53 | −14,88 | 8,26 | −29,95 | 0,2403 | −0,1152 | |||
| AAPL / Apple Inc. | 0,01 | −17,13 | 2,36 | −23,49 | 0,0687 | −0,0243 | |||
| MSFT / Microsoft Corporation | 0,00 | −58,60 | 2,12 | −45,15 | 0,0615 | −0,0547 | |||
| GOOGL / Alphabet Inc. | 0,01 | −23,15 | 2,00 | −12,43 | 0,0582 | −0,0107 | |||
| META / Meta Platforms, Inc. | 0,00 | −55,40 | 1,61 | −42,88 | 0,0468 | −0,0381 | |||
| AMZN / Amazon.com, Inc. | 0,01 | −33,97 | 1,52 | −23,85 | 0,0442 | −0,0160 | |||
| MA / Mastercard Incorporated | 0,00 | −20,86 | 0,99 | −18,87 | 0,0289 | −0,0080 | |||
| NVDA / NVIDIA Corporation | 0,01 | −40,78 | 0,96 | −13,72 | 0,0280 | −0,0056 | |||
| JPM / JPMorgan Chase & Co. | 0,00 | −16,70 | 0,67 | −1,47 | 0,0196 | −0,0010 | |||
| HD / The Home Depot, Inc. | 0,00 | −71,90 | 0,51 | −71,91 | 0,0149 | −0,0400 | |||
| PWR / Quanta Services, Inc. | 0,00 | −14,76 | 0,50 | 26,77 | 0,0146 | 0,0027 | |||
| CMG / Chipotle Mexican Grill, Inc. | 0,01 | −34,90 | 0,47 | −27,22 | 0,0136 | −0,0058 | |||
| HUBS / HubSpot, Inc. | 0,00 | −33,05 | 0,44 | −34,86 | 0,0129 | −0,0076 | |||
| FAST / Fastenal Company | 0,01 | 71,16 | 0,41 | −7,38 | 0,0121 | −0,0014 | |||
| ORCL / Oracle Corporation | 0,00 | −53,82 | 0,40 | −27,86 | 0,0118 | −0,0051 | |||
| FI / Fiserv, Inc. | 0,00 | −29,21 | 0,40 | −44,69 | 0,0117 | −0,0102 | |||
| TROW / T. Rowe Price Group, Inc. | 0,00 | −64,01 | 0,39 | −62,20 | 0,0114 | −0,0199 | |||
| ECL / Ecolab Inc. | 0,00 | −64,63 | 0,38 | −62,45 | 0,0112 | −0,0196 | |||
| PODD / Insulet Corporation | 0,00 | −39,13 | 0,36 | −27,11 | 0,0106 | −0,0045 | |||
| ADP / Automatic Data Processing, Inc. | 0,00 | −74,98 | 0,35 | −74,77 | 0,0103 | −0,0318 | |||
| SBUX / Starbucks Corporation | 0,00 | −13,65 | 0,31 | −19,43 | 0,0091 | −0,0026 | |||
| ADBE / Adobe Inc. | 0,00 | −26,64 | 0,31 | −26,09 | 0,0089 | −0,0036 | |||
| DRI / Darden Restaurants, Inc. | 0,00 | −7,64 | 0,30 | −2,88 | 0,0088 | −0,0006 | |||
| ADSK / Autodesk, Inc. | 0,00 | −35,38 | 0,29 | −23,73 | 0,0083 | −0,0030 | |||
| WEC / WEC Energy Group, Inc. | 0,00 | −69,20 | 0,27 | −70,54 | 0,0078 | −0,0197 | |||
| MTB / M&T Bank Corporation | 0,00 | −7,89 | 0,25 | 0,00 | 0,0074 | −0,0003 | |||
| PAYX / Paychex, Inc. | 0,00 | −14,53 | 0,25 | −19,49 | 0,0073 | −0,0021 | |||
| PEP / PepsiCo, Inc. | 0,00 | −66,55 | 0,24 | −70,63 | 0,0071 | −0,0178 | |||
| TJX / The TJX Companies, Inc. | 0,00 | −7,24 | 0,24 | −5,95 | 0,0069 | −0,0007 | |||
| CRM / Salesforce, Inc. | 0,00 | −31,39 | 0,23 | −30,45 | 0,0068 | −0,0033 | |||
| MCD / McDonald's Corporation | 0,00 | −77,12 | 0,23 | −78,68 | 0,0067 | −0,0257 | |||
| SYY / Sysco Corporation | 0,00 | −63,65 | 0,23 | −63,30 | 0,0067 | −0,0122 | |||
| PG / The Procter & Gamble Company | 0,00 | −71,38 | 0,22 | −73,25 | 0,0063 | −0,0182 | |||
| HRB / H&R Block, Inc. | 0,00 | −6,54 | 0,21 | −6,96 | 0,0063 | −0,0007 | |||
| SNA / Snap-on Incorporated | 0,00 | −9,57 | 0,21 | −16,80 | 0,0061 | −0,0015 | |||
| TXN / Texas Instruments Incorporated | 0,00 | 0,20 | 0,0059 | 0,0059 | |||||
| APD / Air Products and Chemicals, Inc. | 0,00 | −10,20 | 0,20 | −14,35 | 0,0059 | −0,0012 | |||
| PM / Philip Morris International Inc. | 0,00 | −100,00 | 0,00 | 0,0000 | |||||
| MS / Morgan Stanley | 0,00 | −100,00 | 0,00 | 0,0000 | |||||
| BOH / Bank of Hawaii Corporation | 0,00 | −100,00 | 0,00 | 0,0000 | |||||
| BR / Broadridge Financial Solutions, Inc. | 0,00 | −100,00 | 0,00 | 0,0000 | |||||
| YORW / The York Water Company | 0,00 | −100,00 | 0,00 | 0,0000 | |||||
| ITW / Illinois Tool Works Inc. | 0,00 | −100,00 | 0,00 | 0,0000 | |||||
| SCHW / The Charles Schwab Corporation | 0,00 | −100,00 | 0,00 | 0,0000 | |||||
| VICR / Vicor Corporation | 0,00 | −100,00 | 0,00 | 0,0000 | |||||
| GWW / W.W. Grainger, Inc. | 0,00 | −100,00 | 0,00 | 0,0000 | |||||
| UPS / United Parcel Service, Inc. | 0,00 | −100,00 | 0,00 | 0,0000 | |||||
| UNH / UnitedHealth Group Incorporated | 0,00 | −100,00 | 0,00 | 0,0000 | |||||
| FICO / Fair Isaac Corporation | 0,00 | −100,00 | 0,00 | 0,0000 | |||||
| EW / Edwards Lifesciences Corporation | 0,00 | −100,00 | 0,00 | 0,0000 | |||||
| MRK / Merck & Co., Inc. | 0,00 | −100,00 | 0,00 | 0,0000 | |||||
| CRL / Charles River Laboratories International, Inc. | 0,00 | −100,00 | 0,00 | 0,0000 | |||||
| TGT / Target Corporation | 0,00 | −100,00 | 0,00 | 0,0000 | |||||
| TSCO / Tractor Supply Company | 0,00 | −100,00 | 0,00 | 0,0000 | |||||
| HLIO / Helios Technologies, Inc. | 0,00 | −100,00 | 0,00 | 0,0000 | |||||
| ENFN / Enfusion, Inc. | 0,00 | −100,00 | 0,00 | 0,0000 | |||||
| ABBV / AbbVie Inc. | 0,00 | −100,00 | 0,00 | 0,0000 | |||||
| JNJ / Johnson & Johnson | 0,00 | −100,00 | 0,00 | 0,0000 | |||||
| DKS / DICK'S Sporting Goods, Inc. | 0,00 | −100,00 | 0,00 | 0,0000 | |||||
| ABT / Abbott Laboratories | 0,00 | −100,00 | 0,00 | 0,0000 |