Grundläggande statistik
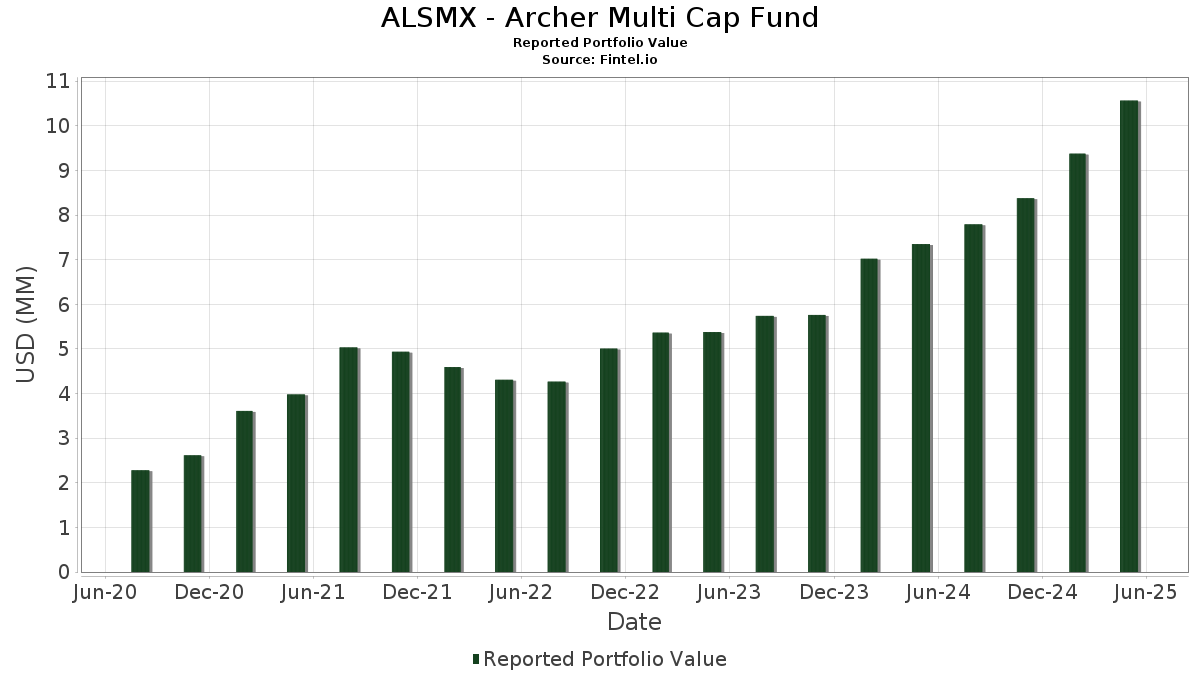
| Portföljvärde | $ 10 565 012 |
| Aktuella positioner | 76 |
Senaste innehav, resultat, förvaltat kapital (från 13F, 13D)
ALSMX - Archer Multi Cap Fund har redovisat 76 totala innehav i sina senaste SEC-arkiveringar. Det senaste portföljvärdet beräknas vara $ 10 565 012 USD. Faktiskt förvaltade tillgångar (AUM) är detta värde plus likvida medel (som inte redovisas). ALSMX - Archer Multi Cap Funds största innehav är Morgan Stanley Institutional Liquidity Funds - Treasury Portfolio (US:US61747C5821) , Meta Platforms, Inc. (US:META) , InterDigital, Inc. (US:IDCC) , Netflix, Inc. (US:NFLX) , and Alphabet Inc. (US:GOOG) .
Största ökningarna detta kvartal
Vi använder förändringen i portföljallokeringen eftersom det är det mest meningsfulla måttet. Förändringar kan bero på transaktioner eller förändringar i aktiekurser.
| Värdepapper | Aktier (MM) |
Värde (MM$) |
Portfölj % av | ΔPortfölj % av |
|---|---|---|---|---|
| 0,82 | 0,82 | 7,7900 | 1,3500 | |
| 0,00 | 0,21 | 1,9700 | 0,8600 | |
| 0,00 | 0,22 | 2,1000 | 0,8000 | |
| 0,00 | 0,21 | 2,0000 | 0,6900 | |
| 0,00 | 0,18 | 1,7400 | 0,5300 | |
| 0,00 | 0,14 | 1,2900 | 0,4900 | |
| 0,00 | 0,18 | 1,6600 | 0,4600 | |
| 0,01 | 0,16 | 1,5500 | 0,3900 | |
| 0,00 | 0,22 | 2,1200 | 0,3700 | |
| 0,00 | 0,16 | 1,4700 | 0,3400 |
Största minskningarna detta kvartal
Vi använder förändringen i portföljallokeringen eftersom det är det mest meningsfulla måttet. Förändringar kan bero på transaktioner eller förändringar i aktiepriser.
| Värdepapper | Aktier (MM) |
Värde (MM$) |
Portfölj % av | ΔPortfölj % av |
|---|---|---|---|---|
| 0,00 | 0,14 | 1,3500 | −0,4800 | |
| 0,00 | 0,13 | 1,2500 | −0,4500 | |
| 0,00 | 0,11 | 1,0000 | −0,4100 | |
| 0,00 | 0,08 | 0,7800 | −0,4100 | |
| 0,01 | 0,09 | 0,8400 | −0,3900 | |
| 0,00 | 0,15 | 1,4400 | −0,3200 | |
| 0,00 | 0,09 | 0,8800 | −0,3100 | |
| 0,00 | 0,09 | 0,8400 | −0,2400 | |
| 0,00 | 0,09 | 0,8400 | −0,2400 | |
| 0,00 | 0,12 | 1,1600 | −0,2300 |
13F- och fond arkiveringar
Denna blankett lämnades in den 2025-07-30 för rapporteringsperioden 2025-05-31. Klicka på länksymbolen för att se hela transaktionshistoriken.
Uppgradera för att låsa upp premiumdata och exportera till Excel![]() .
.
| Värdepapper | Typ | Genomsnittligt aktiepris | Aktier (MM) |
ΔAktier (%) |
ΔAktier (%) |
Värde ($MM) |
Portfölj (%) |
ΔPortfölj (%) |
|
|---|---|---|---|---|---|---|---|---|---|
| US61747C5821 / Morgan Stanley Institutional Liquidity Funds - Treasury Portfolio | 0,82 | 36,33 | 0,82 | 36,26 | 7,7900 | 1,3500 | |||
| META / Meta Platforms, Inc. | 0,00 | 40,65 | 0,22 | 36,59 | 2,1200 | 0,3700 | |||
| IDCC / InterDigital, Inc. | 0,00 | 79,12 | 0,22 | 82,64 | 2,1000 | 0,8000 | |||
| NFLX / Netflix, Inc. | 0,00 | 40,00 | 0,21 | 72,95 | 2,0000 | 0,6900 | |||
| GOOG / Alphabet Inc. | 0,00 | 99,50 | 0,21 | 100,97 | 1,9700 | 0,8600 | |||
| COOP / Mr. Cooper Group Inc. | 0,00 | 0,00 | 0,18 | 15,00 | 1,7500 | 0,0400 | |||
| BMI / Badger Meter, Inc. | 0,00 | 37,04 | 0,18 | 61,95 | 1,7400 | 0,5300 | |||
| MMSI / Merit Medical Systems, Inc. | 0,00 | 26,67 | 0,18 | 17,65 | 1,7100 | 0,0800 | |||
| IBKR / Interactive Brokers Group, Inc. | 0,00 | 0,00 | 0,18 | 2,89 | 1,6900 | −0,1600 | |||
| AL / Air Lease Corporation | 0,00 | 29,79 | 0,18 | 56,25 | 1,6600 | 0,4600 | |||
| RBA / RB Global, Inc. | 0,00 | 31,75 | 0,17 | 35,94 | 1,6500 | 0,2700 | |||
| BRK.B / Berkshire Hathaway Inc. | 0,00 | 42,74 | 0,17 | 40,00 | 1,5900 | 0,3100 | |||
| JPM / JPMorgan Chase & Co. | 0,00 | 0,00 | 0,17 | 0,00 | 1,5700 | −0,2000 | |||
| CTRE / CareTrust REIT, Inc. | 0,01 | 35,71 | 0,16 | 50,93 | 1,5500 | 0,3900 | |||
| ABBV / AbbVie Inc. | 0,00 | 30,96 | 0,16 | 16,30 | 1,4900 | 0,0500 | |||
| CSL / Carlisle Companies Incorporated | 0,00 | 32,26 | 0,16 | 47,62 | 1,4700 | 0,3400 | |||
| FSS / Federal Signal Corporation | 0,00 | 0,00 | 0,15 | 15,79 | 1,4600 | 0,0400 | |||
| EXE / Expand Energy Corporation | 0,00 | 0,00 | 0,15 | 16,79 | 1,4600 | 0,0600 | |||
| WMT / Walmart Inc. | 0,00 | 24,00 | 0,15 | 24,39 | 1,4500 | 0,1400 | |||
| GPI / Group 1 Automotive, Inc. | 0,00 | 0,00 | 0,15 | −7,88 | 1,4400 | −0,3200 | |||
| DY / Dycom Industries, Inc. | 0,00 | 0,00 | 0,15 | 40,57 | 1,4100 | 0,2700 | |||
| XOM / Exxon Mobil Corporation | 0,00 | 37,99 | 0,15 | 26,50 | 1,4100 | 0,1600 | |||
| WSO / Watsco, Inc. | 0,00 | 42,55 | 0,15 | 25,42 | 1,4100 | 0,1500 | |||
| EAT / Brinker International, Inc. | 0,00 | 0,00 | 0,15 | 4,29 | 1,3900 | −0,1000 | |||
| TRNO / Terreno Realty Corporation | 0,00 | 0,00 | 0,14 | −16,96 | 1,3500 | −0,4800 | |||
| BURL / Burlington Stores, Inc. | 0,00 | 49,63 | 0,14 | 37,00 | 1,3000 | 0,2300 | |||
| MANH / Manhattan Associates, Inc. | 0,00 | 70,59 | 0,14 | 81,33 | 1,2900 | 0,4900 | |||
| USFD / US Foods Holding Corp. | 0,00 | 0,00 | 0,13 | 10,74 | 1,2700 | −0,0300 | |||
| ACIW / ACI Worldwide, Inc. | 0,00 | 31,82 | 0,13 | 6,35 | 1,2700 | −0,0800 | |||
| WSM / Williams-Sonoma, Inc. | 0,00 | 0,00 | 0,13 | −16,98 | 1,2500 | −0,4500 | |||
| V / Visa Inc. | 0,00 | 0,00 | 0,13 | 0,76 | 1,2500 | −0,1500 | |||
| PSTG / Pure Storage, Inc. | 0,00 | 0,00 | 0,13 | 2,34 | 1,2400 | −0,1300 | |||
| COST / Costco Wholesale Corporation | 0,00 | 0,00 | 0,13 | −0,76 | 1,2300 | −0,1700 | |||
| CASY / Casey's General Stores, Inc. | 0,00 | 0,00 | 0,13 | 5,00 | 1,2000 | −0,0800 | |||
| MA / Mastercard Incorporated | 0,00 | 0,00 | 0,13 | 1,63 | 1,1900 | −0,1300 | |||
| AWI / Armstrong World Industries, Inc. | 0,00 | 0,00 | 0,12 | 1,64 | 1,1800 | −0,1300 | |||
| RS / Reliance, Inc. | 0,00 | 0,00 | 0,12 | −1,59 | 1,1800 | −0,1700 | |||
| MSFT / Microsoft Corporation | 0,00 | 0,00 | 0,12 | 15,89 | 1,1800 | 0,0400 | |||
| JNJ / Johnson & Johnson | 0,00 | 0,00 | 0,12 | −6,15 | 1,1600 | −0,2300 | |||
| AVGO / Broadcom Inc. | 0,00 | 0,00 | 0,12 | 21,43 | 1,1300 | 0,0800 | |||
| FIX / Comfort Systems USA, Inc. | 0,00 | 0,00 | 0,12 | 32,22 | 1,1300 | 0,1600 | |||
| ETSY / Etsy, Inc. | 0,00 | 0,00 | 0,12 | 8,18 | 1,1300 | −0,0400 | |||
| PG / The Procter & Gamble Company | 0,00 | 3,55 | 0,12 | 0,85 | 1,1300 | −0,1200 | |||
| EPRT / Essential Properties Realty Trust, Inc. | 0,00 | 0,00 | 0,12 | −0,84 | 1,1200 | −0,1500 | |||
| FLEX / Flex Ltd. | 0,00 | 0,00 | 0,12 | 11,32 | 1,1200 | −0,0100 | |||
| ACM / AECOM | 0,00 | 0,00 | 0,12 | 10,28 | 1,1200 | −0,0300 | |||
| EME / EMCOR Group, Inc. | 0,00 | 0,00 | 0,12 | 14,71 | 1,1200 | 0,0300 | |||
| BCPC / Balchem Corporation | 0,00 | 0,00 | 0,12 | −4,13 | 1,1100 | −0,1900 | |||
| NVDA / NVIDIA Corporation | 0,00 | 0,00 | 0,12 | 8,41 | 1,1000 | −0,0500 | |||
| BAC / Bank of America Corporation | 0,00 | 0,00 | 0,11 | −4,20 | 1,0900 | −0,1900 | |||
| DT / Dynatrace, Inc. | 0,00 | 0,00 | 0,11 | −5,08 | 1,0600 | −0,2100 | |||
| SHAK / Shake Shack Inc. | 0,00 | 0,00 | 0,11 | 19,35 | 1,0600 | 0,0600 | |||
| DOCU / DocuSign, Inc. | 0,00 | 0,00 | 0,11 | 6,80 | 1,0500 | −0,0600 | |||
| HD / The Home Depot, Inc. | 0,00 | 0,00 | 0,11 | −6,90 | 1,0300 | −0,2200 | |||
| ZWS / Zurn Elkay Water Solutions Corporation | 0,00 | 0,00 | 0,11 | 1,89 | 1,0300 | −0,1000 | |||
| AMZN / Amazon.com, Inc. | 0,00 | 0,00 | 0,11 | −3,60 | 1,0200 | −0,1700 | |||
| MOGA / Moog, Inc. - Class A | 0,00 | 0,00 | 0,11 | 8,16 | 1,0100 | −0,0400 | |||
| LLY / Eli Lilly and Company | 0,00 | 0,00 | 0,11 | −19,70 | 1,0000 | −0,4100 | |||
| RPM / RPM International Inc. | 0,00 | 0,00 | 0,11 | −7,89 | 1,0000 | −0,2200 | |||
| GOOGL / Alphabet Inc. | 0,00 | 0,00 | 0,10 | 0,97 | 0,9900 | −0,1100 | |||
| UTHR / United Therapeutics Corporation | 0,00 | 0,00 | 0,10 | −0,96 | 0,9800 | −0,1300 | |||
| UNH / UnitedHealth Group Incorporated | 0,00 | 43,86 | 0,10 | −8,33 | 0,9400 | −0,2100 | |||
| TSLA / Tesla, Inc. | 0,00 | 0,00 | 0,10 | 18,07 | 0,9300 | 0,0400 | |||
| XPO / XPO, Inc. | 0,00 | 0,00 | 0,10 | −7,69 | 0,9200 | −0,1900 | |||
| MARA / MARA Holdings, Inc. | 0,01 | 0,00 | 0,10 | 2,13 | 0,9100 | −0,1000 | |||
| AAPL / Apple Inc. | 0,00 | 0,00 | 0,09 | −17,12 | 0,8800 | −0,3100 | |||
| MAC / The Macerich Company | 0,01 | 0,00 | 0,09 | −9,80 | 0,8700 | −0,2300 | |||
| CSW / CSW Industrials, Inc. | 0,00 | 0,00 | 0,09 | 0,00 | 0,8700 | −0,1100 | |||
| COHR / Coherent Corp. | 0,00 | 0,00 | 0,09 | 0,00 | 0,8600 | −0,1000 | |||
| CRM / Salesforce, Inc. | 0,00 | 0,00 | 0,09 | −10,89 | 0,8500 | −0,2300 | |||
| AVTR / Avantor, Inc. | 0,01 | 0,00 | 0,09 | −22,61 | 0,8400 | −0,3900 | |||
| MTH / Meritage Homes Corporation | 0,00 | 0,00 | 0,09 | −11,88 | 0,8400 | −0,2400 | |||
| OC / Owens Corning | 0,00 | 0,00 | 0,09 | −12,87 | 0,8400 | −0,2400 | |||
| INSP / Inspire Medical Systems, Inc. | 0,00 | 0,00 | 0,08 | −26,13 | 0,7800 | −0,4100 | |||
| ILMN / Illumina, Inc. | 0,00 | 0,00 | 0,07 | −8,00 | 0,6600 | −0,1400 | |||
| SMTC / Semtech Corporation | 0,00 | 0,00 | 0,07 | −1,43 | 0,6500 | −0,1000 |