Grundläggande statistik
| Institutionella ägare | 228 total, 225 long only, 0 short only, 3 long/short - change of 10,10% MRQ |
| Genomsnittlig portföljallokering | 0.1563 % - change of −38,36% MRQ |
| Institutionella aktier (lång) | 2 123 434 (ex 13D/G) - change of 0,06MM shares 2,86% MRQ |
| Institutionellt värde (lång) | $ 510 549 USD ($1000) |
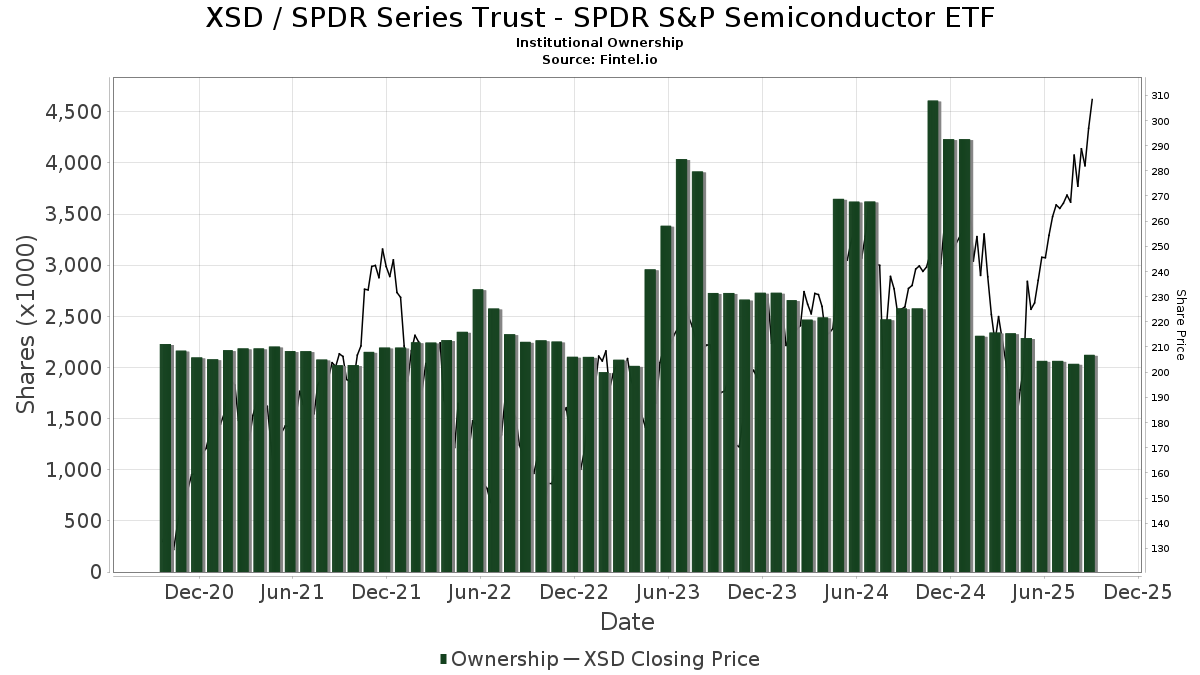
Institutionellt ägande och aktieägare
SPDR Series Trust - SPDR S&P Semiconductor ETF (US:XSD) har 228 Institutionella ägare och aktieägare som har lämnat in 13D/G- eller 13F-formulär till Securities Exchange Commission (SEC). Dessa institut innehar totalt 2,123,434 aktier. Största aktieägare inkluderar Morgan Stanley, LPL Financial LLC, Bank Of America Corp /de/, Ameriprise Financial Inc, Wells Fargo & Company/mn, Bnp Paribas Arbitrage, Sa, Pnc Financial Services Group, Inc., CoreCap Advisors, LLC, UBS Group AG, and Goldman Sachs Group Inc .
SPDR Series Trust - SPDR S&P Semiconductor ETF (ARCA:XSD) Institutionell ägarstruktur visar institutioners och fonders nuvarande positioner i företaget, samt de senaste förändringarna i positionernas storlek. Större aktieägare kan vara enskilda investerare, fonder, hedgefonder eller institutioner. Bilaga 13D visar att investeraren äger (eller ägde) mer än 5% av företaget och avser (eller avsåg) att aktivt eftersträva en förändring av affärsstrategin. Schedule 13G indikerar en passiv investering på över 5%.
The share price as of September 17, 2025 is 308,33 / share. Previously, on September 17, 2024, the share price was 226,68 / share. This represents an increase of 36,02% over that period.
Fondsentimentets poäng
Fondsentimentet poängen(fka Ägarackumulation-poäng) visar vilka aktier som är mest köpta av fonder. Det är resultatet av en sofistikerad kvantitativ flerfaktormodell som identifierar företag med de högsta nivåerna av institutionell ackumulering. Poängsättningsmodellen använder en kombination av den totala ökningen av redovisade ägare, förändringarna i portföljallokeringarna för dessa ägare och andra mått. Siffran sträcker sig från 0 till 100, där högre siffror indikerar en högre nivå av ackumulering i förhållande till sina konkurrenter, och 50 är genomsnittet.
Uppdateringsfrekvens: Dagligen
Se Ownership Explorer, som innehåller en lista över de högst rankade företagen.
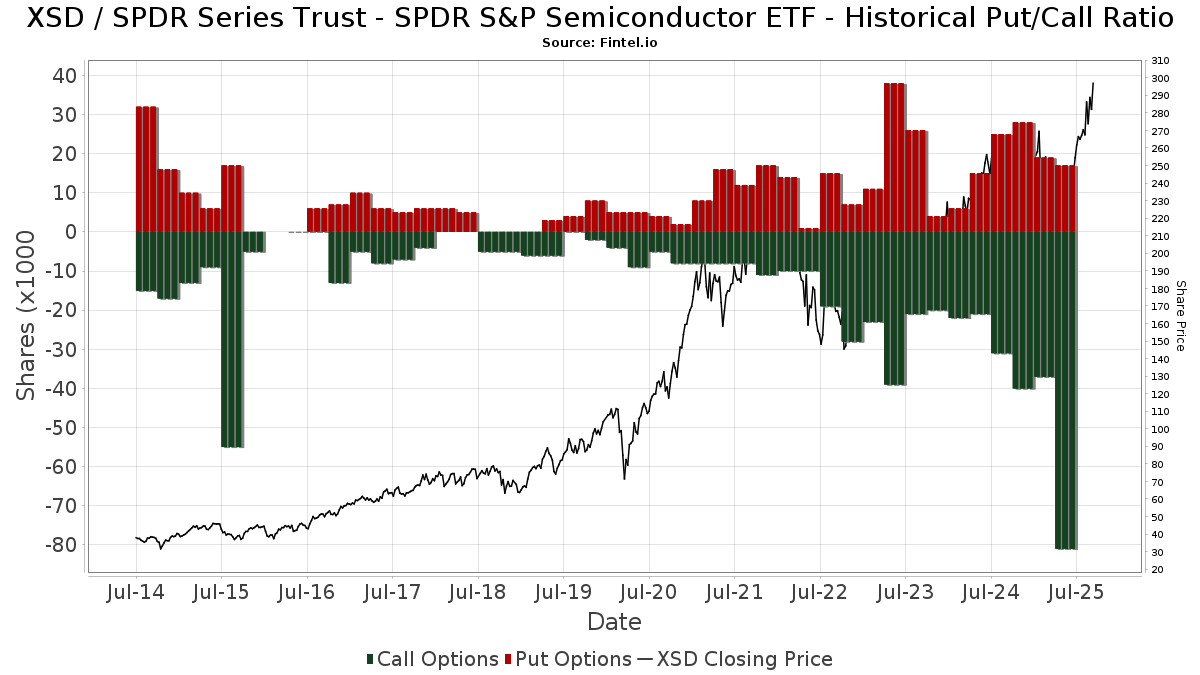
Institutionell sälj/köp-kvot
Förutom att rapportera vanliga eget kapital- och skuldemissioner måste institutioner med mer än 100MM tillgångar under förvaltning också avslöja sina innehav av sälj- och köpoptioner. Eftersom säljoptioner i allmänhet indikerar ett negativt sentiment och köpoptioner indikerar ett positivt sentiment, kan vi få en uppfattning om det övergripande institutionella sentimentet genom att plotta förhållandet mellan säljoptioner och köpoptioner. Diagrammet till höger visar det historiska förhållandet mellan sälj- och köpoptioner för detta instrument.
Genom att använda sälj/köp-kvoten som en indikator på aktieägarnas sentiment undviker man en av de största bristerna med att använda det totala institutionella ägandet, nämligen att en betydande del av de förvaltade tillgångarna investeras passivt för att följa index. Passivt förvaltade fonder köper vanligtvis inte optioner, så indikatorn för sälj/köp-kvoten ger en bättre bild av stämningen i aktivt förvaltade fonder.
13F- och NPORT-arkiveringar
Detaljer om 13F-arkiveringar är gratis. Detaljer om NP-arkiveringar kräver ett premiummedlemskap. Gröna rader indikerar nya positioner. Röda rader indikerar stängda positioner. Klicka på länk symbolen för att se hela transaktionshistoriken.
Uppgradera
för att låsa upp premiumdata och exportera till Excel ![]() .
.
| Fil Datum | Källa | Investerare | Typ | Genomsnittligt pris (beräknat) |
Aktier | Δ Aktier (%) |
Rapporterat värde (1000 USD) |
Δ Värde (%) |
Portföljallokering (%) |
|
|---|---|---|---|---|---|---|---|---|---|---|
| 2025-08-12 | 13F | Steward Partners Investment Advisory, Llc | 3 981 | 23,86 | 1 021 | 58,29 | ||||
| 2025-07-17 | 13F | Fifth Third Securities, Inc. | 3 271 | 15,18 | 839 | 47,19 | ||||
| 2025-07-25 | 13F | Apollon Wealth Management, LLC | 4 131 | 0,07 | 1 060 | 27,90 | ||||
| 2025-08-12 | 13F | Cowa, Llc | 0 | −100,00 | 0 | |||||
| 2025-07-02 | 13F | Central Pacific Bank - Trust Division | 6 | 0,00 | 2 | 0,00 | ||||
| 2025-07-21 | 13F | DHJJ Financial Advisors, Ltd. | 2 | 0,00 | 1 | |||||
| 2025-08-12 | 13F | Putnam Fl Investment Management Co | 1 650 | −1,49 | 423 | 25,89 | ||||
| 2025-04-15 | 13F | Collier Financial | 404 | 0,00 | 81 | −19,00 | ||||
| 2025-07-29 | 13F | Sigma Investment Counselors Inc | 807 | 207 | ||||||
| 2025-08-11 | 13F | Empowered Funds, LLC | 0 | −100,00 | 0 | −100,00 | ||||
| 2025-08-12 | 13F | Guerra Pan Advisors, Llc | 1 218 | 0,00 | 312 | 27,87 | ||||
| 2025-07-24 | 13F | Game Plan Financial Advisors, LLC | 860 | 0,00 | 221 | 27,91 | ||||
| 2025-08-14 | 13F | Qube Research & Technologies Ltd | 318 | 0,00 | 82 | 28,57 | ||||
| 2025-08-14 | 13F | Ancora Advisors, LLC | 300 | 0,00 | 77 | 26,67 | ||||
| 2025-05-09 | 13F | Financial Connections Group, Inc. | 0 | −100,00 | 0 | |||||
| 2025-08-06 | 13F | AE Wealth Management LLC | 285 | −11,49 | 73 | 14,06 | ||||
| 2025-08-12 | 13F | PSI Advisors, LLC | 0 | −100,00 | 0 | |||||
| 2025-08-06 | 13F | Grey Fox Wealth Advisors, LLC | 897 | 230 | ||||||
| 2025-07-29 | 13F | Stratos Wealth Partners, LTD. | 2 475 | 635 | ||||||
| 2025-08-06 | 13F | Stonebridge Financial Planning Group, LLC | 1 500 | −16,67 | 385 | 6,37 | ||||
| 2025-08-14 | 13F | Mercer Global Advisors Inc /adv | 1 857 | −3,88 | 476 | 23,00 | ||||
| 2025-04-28 | 13F | Smart Money Group LLC | 0 | −100,00 | 0 | |||||
| 2025-05-14 | 13F | Lionshead Wealth Management, LLC | 0 | −100,00 | 0 | |||||
| 2025-07-21 | 13F | Ameritas Advisory Services, LLC | 204 | 52 | ||||||
| 2025-05-05 | 13F | Transce3nd, LLC | 0 | −100,00 | 0 | |||||
| 2025-08-01 | 13F | Ashton Thomas Private Wealth, LLC | 1 059 | 0,00 | 272 | 27,83 | ||||
| 2025-07-14 | 13F | Painted Porch Advisors LLC | 2 | 0,00 | 1 | |||||
| 2025-08-11 | 13F | Rothschild Investment Llc | 3 | 0,00 | 1 | |||||
| 2025-08-05 | 13F | Tsfg, Llc | 101 | 0,00 | 0 | |||||
| 2025-08-14 | 13F | Benjamin Edwards Inc | 1 644 | 0,06 | 422 | 27,96 | ||||
| 2025-07-21 | 13F | Crews Bank & Trust | 50 | 0,00 | 13 | 20,00 | ||||
| 2025-08-06 | 13F | Modera Wealth Management, LLC | 1 436 | 0,00 | 368 | 27,78 | ||||
| 2025-08-14 | 13F | Coastal Bridge Advisors, LLC | 1 170 | −9,65 | 300 | 15,38 | ||||
| 2025-07-24 | 13F | Rice Partnership, LLC | 90 | 0,00 | 23 | 27,78 | ||||
| 2025-07-21 | 13F | Ameriflex Group, Inc. | 9 | 0,00 | 2 | 100,00 | ||||
| 2025-08-13 | 13F | Providence Capital Advisors, LLC | 5 | 1 | ||||||
| 2025-08-12 | 13F | Harbor Advisory Corp /ma/ | 7 556 | −4,22 | 1 938 | 22,43 | ||||
| 2025-07-18 | 13F | Truist Financial Corp | 12 146 | 8,44 | 3 116 | 38,57 | ||||
| 2025-07-28 | 13F | Harbour Investments, Inc. | 414 | −26,60 | 106 | −6,19 | ||||
| 2025-08-08 | 13F | Larson Financial Group LLC | 140 | 36 | ||||||
| 2025-08-14 | 13F | Bnp Paribas Arbitrage, Sa | 75 597 | 47,85 | 19 391 | 88,90 | ||||
| 2025-05-13 | 13F | Mill Creek Capital Advisors, LLC | 0 | −100,00 | 0 | −100,00 | ||||
| 2025-07-29 | 13F | Stephens Inc /ar/ | 1 152 | 296 | ||||||
| 2025-08-06 | 13F | Atlantic Union Bankshares Corp | 753 | 193 | ||||||
| 2025-08-01 | 13F | Biltmore Family Office, LLC | 1 650 | 0,00 | 423 | 27,79 | ||||
| 2025-08-14 | 13F | Royal Bank Of Canada | 34 250 | −4,82 | 8 786 | 21,61 | ||||
| 2025-07-15 | 13F | World Equity Group, Inc. | 900 | 231 | ||||||
| 2025-07-24 | 13F | IFP Advisors, Inc | 264 | 17,86 | 68 | 52,27 | ||||
| 2025-08-14 | 13F | Bank Of America Corp /de/ | 86 623 | −1,38 | 22 220 | 25,99 | ||||
| 2025-08-14 | 13F | Goldman Sachs Group Inc | 50 336 | −24,16 | 12 912 | −3,11 | ||||
| 2025-08-08 | 13F | Avantax Advisory Services, Inc. | 5 562 | 28,51 | 1 427 | 64,10 | ||||
| 2025-04-23 | 13F | Oppenheimer & Co Inc | 0 | −100,00 | 0 | −100,00 | ||||
| 2025-08-14 | 13F | D. E. Shaw & Co., Inc. | 2 570 | 0,00 | 659 | 27,96 | ||||
| 2025-08-14 | 13F | Fort Point Capital Partners LLC | 5 756 | 7,49 | 1 477 | 37,30 | ||||
| 2025-07-25 | 13F | Cwm, Llc | 383 | 15,71 | 0 | |||||
| 2025-07-10 | 13F | Global Financial Private Client, LLC | 3 039 | −0,46 | 780 | 27,29 | ||||
| 2025-08-04 | 13F | Flagship Harbor Advisors, Llc | 888 | 228 | ||||||
| 2025-08-14 | 13F | Peapack Gladstone Financial Corp | 2 000 | 0,00 | 1 | |||||
| 2025-08-15 | 13F | Kestra Advisory Services, LLC | 3 035 | −50,71 | 778 | −37,06 | ||||
| 2025-07-22 | 13F | Beacon Financial Advisory LLC | 2 334 | −21,86 | 599 | −0,17 | ||||
| 2025-07-14 | 13F | GAMMA Investing LLC | 3 | 0,00 | 1 | |||||
| 2025-08-13 | 13F | Twin Peaks Wealth Advisors, LLC | 32 | 9 | ||||||
| 2025-07-30 | 13F | Princeton Global Asset Management LLC | 97 | 0,00 | 25 | 26,32 | ||||
| 2025-08-06 | 13F | Golden State Wealth Management, LLC | 543 | −5,07 | 139 | 21,93 | ||||
| 2025-08-18 | 13F | Hollencrest Capital Management | 116 | 0,00 | 30 | 26,09 | ||||
| 2025-08-14 | 13F | Comerica Bank | 287 | 0,00 | 74 | 28,07 | ||||
| 2025-07-02 | 13F | HBW Advisory Services LLC | 0 | −100,00 | 0 | |||||
| 2025-08-14 | 13F | Colony Group, LLC | 3 420 | 7,92 | 878 | 37,89 | ||||
| 2025-07-28 | 13F | Copia Wealth Management | 90 | 0,00 | 23 | 27,78 | ||||
| 2025-08-01 | 13F | Bessemer Group Inc | 56 | −85,96 | 0 | |||||
| 2025-04-14 | 13F | Henrickson Nauta Wealth Advisors, Inc. | 0 | −100,00 | 0 | |||||
| 2025-07-17 | 13F | Hanson & Doremus Investment Management | 29 | 0,00 | 0 | |||||
| 2025-08-26 | 13F/A | Thrivent Financial For Lutherans | 1 029 | −88,06 | 0 | −100,00 | ||||
| 2025-08-14 | 13F | Mariner, LLC | 8 223 | 12,34 | 2 109 | 43,57 | ||||
| 2025-04-29 | 13F | Hm Payson & Co | 17 | 3 | ||||||
| 2025-07-23 | 13F | Beaumont Asset Management, L.L.C. | 11 563 | 0,71 | 2 966 | 28,63 | ||||
| 2025-07-31 | 13F | Brinker Capital Investments, LLC | 0 | −100,00 | 0 | −100,00 | ||||
| 2025-08-06 | 13F | First Horizon Advisors, Inc. | 20 | 5 | ||||||
| 2025-08-11 | 13F | TD Waterhouse Canada Inc. | 50 | 0,00 | 13 | 20,00 | ||||
| 2025-08-13 | 13F | Jones Financial Companies Lllp | 3 212 | 33,17 | 823 | 68,79 | ||||
| 2025-08-05 | 13F | Simplex Trading, Llc | 0 | −100,00 | 0 | |||||
| 2025-08-01 | 13F | Jericho Financial, Llp | 1 255 | 4,93 | 322 | 33,75 | ||||
| 2025-08-11 | 13F | Aptus Capital Advisors, LLC | 248 | 12,22 | 64 | 43,18 | ||||
| 2025-05-14 | 13F | TD Capital Management LLC | 0 | −100,00 | 0 | |||||
| 2025-07-22 | 13F | Chemung Canal Trust Co | 1 871 | −79,26 | 480 | −73,55 | ||||
| 2025-07-30 | 13F | Bogart Wealth, LLC | 447 | 28,82 | 115 | 65,22 | ||||
| 2025-08-14 | 13F/A | Barclays Plc | 250 | 0,00 | 0 | |||||
| 2025-07-10 | 13F | Atticus Wealth Management, Llc | 1 | 0,00 | 0 | |||||
| 2025-08-12 | 13F | Wood Tarver Financial Group, LLC | 539 | 0,00 | 0 | −100,00 | ||||
| 2025-08-11 | 13F | Capital Square, LLC | 1 177 | 312 | ||||||
| 2025-07-29 | 13F | International Assets Investment Management, Llc | 1 950 | −0,91 | 500 | 26,58 | ||||
| 2025-08-14 | 13F | Guardian Wealth Advisors, Llc / Nc | 248 | 19,23 | 64 | 53,66 | ||||
| 2025-08-14 | 13F | Hrt Financial Lp | 0 | −100,00 | 0 | |||||
| 2025-08-14 | 13F | Money Concepts Capital Corp | 12 096 | −23,19 | 3 103 | −1,87 | ||||
| 2025-08-12 | 13F | Jpmorgan Chase & Co | 2 425 | 41,65 | 622 | 81,34 | ||||
| 2025-08-01 | 13F | Gwn Securities Inc. | 1 892 | 489 | ||||||
| 2025-08-13 | 13F | Consultiva Wealth Management, Corp. | 83 | 0,00 | 21 | 31,25 | ||||
| 2025-08-13 | 13F | Baird Financial Group, Inc. | 8 454 | −51,95 | 2 169 | −38,62 | ||||
| 2025-05-02 | 13F | SeaBridge Investment Advisors LLC | 0 | −100,00 | 0 | |||||
| 2025-08-07 | 13F | Allworth Financial LP | 50 | 0,00 | 13 | 33,33 | ||||
| 2025-03-21 | 13F | Prostatis Group LLC | 0 | −100,00 | 0 | |||||
| 2025-08-13 | 13F | EverSource Wealth Advisors, LLC | 41 | 0,00 | 11 | 25,00 | ||||
| 2025-08-14 | 13F | GWM Advisors LLC | 317 | 0,00 | 81 | 28,57 | ||||
| 2025-08-15 | 13F | Tower Research Capital LLC (TRC) | 14 151 | −6,47 | 3 630 | 19,49 | ||||
| 2025-05-13 | 13F | Intrepid Financial Planning Group LLC | 0 | −100,00 | 0 | −100,00 | ||||
| 2025-04-30 | 13F | M&t Bank Corp | 0 | −100,00 | 0 | −100,00 | ||||
| 2025-08-13 | 13F | Flow Traders U.s. Llc | 5 258 | 1 | ||||||
| 2025-08-14 | 13F | Ameriprise Financial Inc | 79 799 | −1,45 | 20 486 | 26,14 | ||||
| 2025-08-11 | 13F | Morling Financial Advisors, LLC | 52 | 13 | ||||||
| 2025-07-29 | 13F | BKD Wealth Advisors, LLC | 0 | −100,00 | 0 | |||||
| 2025-08-12 | 13F | Argent Trust Co | 2 300 | 0,00 | 590 | 27,77 | ||||
| 2025-07-30 | 13F | First Interstate Bank | 29 163 | −0,69 | 7 481 | 26,87 | ||||
| 2025-08-14 | 13F | Millennium Management Llc | 37 987 | 9 744 | ||||||
| 2025-08-01 | 13F | Envestnet Asset Management Inc | 34 533 | 70,05 | 8 858 | 117,27 | ||||
| 2025-08-11 | 13F | Private Advisor Group, LLC | 1 576 | −2,17 | 404 | 25,08 | ||||
| 2025-08-05 | 13F | Bank Of Montreal /can/ | 10 | −97,10 | 3 | −97,10 | ||||
| 2025-08-18 | 13F/A | National Bank Of Canada /fi/ | 49 | 600,00 | 13 | 1 100,00 | ||||
| 2025-04-24 | 13F | Wingate Wealth Advisors, Inc. | 0 | −100,00 | 0 | |||||
| 2025-08-14 | 13F | Jane Street Group, Llc | 1 185 | −81,66 | 304 | −76,62 | ||||
| 2025-08-14 | 13F | Millennium Management Llc | Call | 25 000 | 6 413 | |||||
| 2025-08-14 | 13F | Stifel Financial Corp | 19 936 | 0,54 | 5 114 | 28,46 | ||||
| 2025-08-04 | 13F | Creative Financial Designs Inc /adv | 35 | 0,00 | 9 | 28,57 | ||||
| 2025-05-07 | 13F | Mb, Levis & Associates, Llc | 0 | −100,00 | 0 | −100,00 | ||||
| 2025-08-13 | 13F | Gateway Wealth Partners, LLC | 1 043 | 0,00 | 268 | 27,75 | ||||
| 2025-08-05 | 13F | Plante Moran Financial Advisors, LLC | 129 | 0,00 | 33 | 32,00 | ||||
| 2025-04-17 | 13F | Atlas Financial Advisors, Inc. | 1 068 | 2,50 | 265 | 6,00 | ||||
| 2025-07-14 | 13F | Armstrong Advisory Group, Inc | 41 | 0,00 | 11 | 0,00 | ||||
| 2025-08-04 | 13F | Pensionmark Financial Group, Llc | 1 476 | 40,97 | 378 | 80,00 | ||||
| 2025-08-06 | 13F | Tradewinds, LLC. | 0 | −100,00 | 0 | |||||
| 2025-08-11 | 13F | SFI Advisors, LLC | 3 645 | −78,53 | 935 | −72,59 | ||||
| 2025-08-14 | 13F | Federation des caisses Desjardins du Quebec | 40 | 0,00 | 10 | 25,00 | ||||
| 2025-08-18 | 13F | Geneos Wealth Management Inc. | 188 | −3,09 | 48 | 26,32 | ||||
| 2025-07-09 | 13F | Bulwark Capital Corp | 161 | 41 | ||||||
| 2025-08-19 | 13F | Advisory Services Network, LLC | 3 442 | −4,50 | 913 | 26,28 | ||||
| 2025-07-08 | 13F | Parallel Advisors, LLC | 211 | −19,16 | 54 | 3,85 | ||||
| 2025-07-11 | 13F | Farther Finance Advisors, LLC | 959 | −7,88 | 246 | 17,22 | ||||
| 2025-07-18 | 13F | SOA Wealth Advisors, LLC. | 1 771 | 0,11 | 454 | 27,89 | ||||
| 2025-07-25 | 13F | M3 Advisory Group, LLC | 1 885 | −8,36 | 483 | 17,23 | ||||
| 2025-07-17 | 13F | Patton Albertson Miller Group, Llc | 3 468 | 0,00 | 890 | 27,73 | ||||
| 2025-07-14 | 13F | UMA Financial Services, Inc. | 88 | 0,00 | 23 | 29,41 | ||||
| 2025-08-13 | 13F | Russell Investments Group, Ltd. | 458 | 0,00 | 118 | 28,57 | ||||
| 2025-08-06 | 13F | Commonwealth Equity Services, Llc | 24 894 | −6,82 | 6 | 20,00 | ||||
| 2025-07-23 | NP | CHPS - Xtrackers Semiconductor Select Equity ETF | 10 | 2 | ||||||
| 2025-05-14 | 13F | Legend Financial Advisors, Inc. | 0 | −100,00 | 0 | |||||
| 2025-07-24 | 13F | Blair William & Co/il | 2 793 | 0,43 | 716 | 28,32 | ||||
| 2025-05-12 | 13F | Sandy Spring Bank | 753 | 0,00 | 151 | −19,25 | ||||
| 2025-08-13 | 13F | Renaissance Technologies Llc | 0 | −100,00 | 0 | |||||
| 2025-07-17 | 13F | Chatham Capital Group, Inc. | 5 617 | 0,00 | 1 441 | 27,77 | ||||
| 2025-08-08 | 13F | Kaizen Financial Strategies | 2 000 | −3,61 | 513 | 23,32 | ||||
| 2025-07-31 | 13F | Conservest Capital Advisors, Inc. | 2 430 | 623 | ||||||
| 2025-08-08 | 13F | Emerald Investment Partners, Llc | 11 | 3 | ||||||
| 2025-08-12 | 13F | Agp Franklin, Llc | 1 982 | 0,00 | 508 | 43,91 | ||||
| 2025-07-22 | 13F | Merit Financial Group, LLC | 5 747 | 14,21 | 1 474 | 45,94 | ||||
| 2025-08-06 | 13F | Soltis Investment Advisors LLC | 2 400 | −1,36 | 616 | 26,02 | ||||
| 2025-08-14 | 13F | Glen Eagle Advisors, LLC | 8 | 0,00 | 2 | 100,00 | ||||
| 2025-07-29 | NP | MSSS - Monarch Select Subsector Index ETF | 41 835 | −6,11 | 9 251 | −8,41 | ||||
| 2025-07-22 | 13F | Global Assets Advisory, LLC | 2 332 | −80,65 | 598 | −73,42 | ||||
| 2025-08-14 | 13F | UBS Group AG | 62 612 | 33,38 | 16 061 | 70,42 | ||||
| 2025-07-07 | 13F | Thurston, Springer, Miller, Herd & Titak, Inc. | 4 928 | 1 264 | ||||||
| 2025-08-15 | 13F | Morgan Stanley | 246 868 | 30,82 | 63 324 | 67,13 | ||||
| 2025-08-14 | 13F | Wells Fargo & Company/mn | 77 159 | 0,28 | 19 792 | 28,12 | ||||
| 2025-08-14 | 13F | CoreCap Advisors, LLC | 64 823 | 220,48 | 16 628 | 309,53 | ||||
| 2025-08-12 | 13F | Richard W. Paul & Associates, LLC | 92 | 0,00 | 24 | 27,78 | ||||
| 2025-07-24 | 13F | Us Bancorp \de\ | 1 163 | 0,09 | 298 | 27,90 | ||||
| 2025-07-30 | 13F | Crewe Advisors LLC | 0 | −100,00 | 0 | |||||
| 2025-08-08 | 13F | Creative Planning | 3 169 | 2,06 | 813 | 30,34 | ||||
| 2025-05-12 | 13F | Atlas Capital Advisors Llc | 0 | −100,00 | 0 | |||||
| 2025-08-12 | 13F | Manchester Capital Management LLC | 1 750 | 0,00 | 449 | 27,64 | ||||
| 2025-07-21 | 13F | Jmac Enterprises Llc | 23 792 | 13,61 | 6 103 | 45,15 | ||||
| 2025-08-08 | 13F | Glassman Wealth Services | 0 | −100,00 | 0 | −100,00 | ||||
| 2025-08-11 | 13F | Tidemark, LLC | 34 | −52,11 | 9 | −42,86 | ||||
| 2025-08-04 | 13F | Kovack Advisors, Inc. | 1 097 | −5,92 | 281 | 20,09 | ||||
| 2025-07-17 | 13F | Janney Montgomery Scott LLC | 19 321 | 1,05 | 5 | 33,33 | ||||
| 2025-08-05 | 13F | Huntington National Bank | 114 | 276,67 | ||||||
| 2025-07-31 | 13F | Hobart Private Capital, LLC | 38 616 | −14,15 | 9 905 | 9,69 | ||||
| 2025-04-25 | 13F | WASHINGTON TRUST Co | 0 | −100,00 | 0 | −100,00 | ||||
| 2025-05-28 | NP | THRIVENT SERIES FUND INC - Thrivent All Cap Portfolio Class A | 8 615 | 42,07 | 1 730 | 14,81 | ||||
| 2025-07-01 | 13F | Harbor Investment Advisory, Llc | 1 352 | −6,89 | 347 | 18,90 | ||||
| 2025-07-08 | 13F | Juncture Wealth Strategies, Llc | 1 466 | 18,32 | 376 | 51,61 | ||||
| 2025-08-11 | 13F | Compass Capital Corp /ma/ /adv | 0 | −100,00 | 0 | |||||
| 2025-07-16 | 13F | Arkansas Financial Group, Inc. | 4 448 | −0,43 | 1 172 | 50,26 | ||||
| 2025-04-30 | 13F | Round Rock Advisors, LLC | 0 | −100,00 | 0 | |||||
| 2025-07-18 | 13F | McGuire Investment Group, LLC | 41 905 | 1,14 | 10 749 | 29,21 | ||||
| 2025-07-29 | 13F | Chicago Partners Investment Group LLC | 4 033 | 0,02 | 1 077 | 32,47 | ||||
| 2025-04-29 | 13F | U.S. Capital Wealth Advisors, LLC | 0 | −100,00 | 0 | |||||
| 2025-08-12 | 13F | BlackRock, Inc. | 9 218 | −0,18 | 2 365 | 27,51 | ||||
| 2025-08-12 | 13F | Deutsche Bank Ag\ | 10 | 0,00 | 3 | 0,00 | ||||
| 2025-08-07 | 13F | McClarren Financial Advisors, Inc. | 0 | −100,00 | 0 | |||||
| 2025-08-13 | 13F/A | StoneX Group Inc. | 1 495 | 19,98 | 331 | 27,41 | ||||
| 2025-07-02 | 13F | Capital Market Strategies LLC | 1 087 | 0,00 | 279 | 27,52 | ||||
| 2025-08-13 | 13F | Safe Harbor Fiduciary, LLC | 0 | −100,00 | 0 | |||||
| 2025-08-01 | 13F | Belvedere Trading LLC | 0 | −100,00 | 0 | −100,00 | ||||
| 2025-08-11 | 13F | Citigroup Inc | 5 159 | −2,48 | 1 323 | 24,58 | ||||
| 2025-07-08 | 13F | Nbc Securities, Inc. | 335 | 3,72 | 0 | |||||
| 2025-07-22 | 13F | Wealthcare Advisory Partners LLC | 1 159 | 297 | ||||||
| 2025-08-14 | 13F | Sunbelt Securities, Inc. | 50 | −54,55 | 12 | −45,45 | ||||
| 2025-09-04 | 13F/A | Advisor Group Holdings, Inc. | 33 800 | 3,64 | 8 678 | 32,45 | ||||
| 2025-08-14 | 13F | Pennington Partners & Co., Llc | 937 | 240 | ||||||
| 2025-08-15 | 13F | CI Private Wealth, LLC | 4 172 | 28,92 | 1 070 | 64,87 | ||||
| 2025-07-22 | 13F | Valley National Advisers Inc | 105 | 0,00 | 0 | |||||
| 2025-08-14 | 13F | Fmr Llc | 1 077 | −15,79 | 276 | 7,81 | ||||
| 2025-04-28 | 13F | Mutual Advisors, LLC | 0 | −100,00 | 0 | −100,00 | ||||
| 2025-08-14 | 13F | Quantinno Capital Management LP | 2 308 | 592 | ||||||
| 2025-05-13 | 13F | Ground Swell Capital, LLC | 0 | −100,00 | 0 | −100,00 | ||||
| 2025-07-10 | 13F | Sovran Advisors, LLC | 2 623 | −3,60 | 691 | 47,02 | ||||
| 2025-08-12 | 13F | Marshall & Sterling Wealth Advisors Inc. | 249 | −4,96 | 64 | 21,15 | ||||
| 2025-08-12 | 13F | MAI Capital Management | 150 | 0,00 | 39 | 26,67 | ||||
| 2025-05-12 | 13F | Waterloo Capital, L.P. | 0 | −100,00 | 0 | |||||
| 2025-08-08 | 13F | Pnc Financial Services Group, Inc. | 67 337 | −9,18 | 17 273 | 16,04 | ||||
| 2025-07-30 | 13F | Forum Financial Management, LP | 1 041 | 267 | ||||||
| 2025-07-14 | 13F | Park Avenue Securities Llc | 929 | 0 | ||||||
| 2025-08-01 | 13F | Vision Financial Markets Llc | 117 | 0,00 | 30 | 26,09 | ||||
| 2025-04-11 | 13F | Affinity Wealth Management Llc | 0 | −100,00 | 0 | |||||
| 2025-08-14 | 13F | Gerber Kawasaki Wealth & Investment Management | 6 264 | −17,60 | 1 607 | 5,24 | ||||
| 2025-07-23 | 13F | Prime Capital Investment Advisors, LLC | 3 055 | −0,16 | 784 | 27,52 | ||||
| 2025-08-13 | 13F | Cresset Asset Management, LLC | 911 | 234 | ||||||
| 2025-08-04 | 13F | Assetmark, Inc | 104 | 4,00 | 27 | 30,00 | ||||
| 2025-08-13 | 13F | Beacon Pointe Advisors, LLC | 918 | 236 | ||||||
| 2025-08-11 | 13F | Aspen Investment Management Inc | 1 034 | 0,00 | 0 | |||||
| 2025-07-22 | 13F | Kessler Investment Group, LLC | 2 | 0,00 | 1 | |||||
| 2025-05-06 | 13F | Jackson, Grant Investment Advisers, Inc. | 0 | −100,00 | 0 | |||||
| 2025-08-07 | 13F | Rathbone Brothers plc | 2 568 | 0,00 | 659 | 27,77 | ||||
| 2025-07-31 | 13F | Sharper & Granite LLC | 4 770 | 23,42 | 1 249 | 61,03 | ||||
| 2025-08-14 | 13F | Sandler Capital Management | 9 000 | 2 309 | ||||||
| 2025-07-10 | 13F | Wealth Enhancement Advisory Services, Llc | 3 524 | 57,32 | 934 | 108,02 | ||||
| 2025-08-07 | 13F | Parkside Financial Bank & Trust | 88 | 23 | ||||||
| 2025-05-02 | 13F | Signaturefd, Llc | 0 | −100,00 | 0 | |||||
| 2025-07-15 | 13F | Yarbrough Capital, LLC | 10 498 | −48,19 | 2 693 | −33,82 | ||||
| 2025-08-12 | 13F | Park Square Financial Group, LLC | 1 | 0 | ||||||
| 2025-08-08 | 13F | Kingsview Wealth Management, LLC | 47 618 | −18,89 | 12 214 | 3,63 | ||||
| 2025-08-19 | 13F | National Asset Management, Inc. | 0 | −100,00 | 0 | −100,00 | ||||
| 2025-08-04 | 13F | Spire Wealth Management | 285 | −45,71 | 73 | −31,43 | ||||
| 2025-07-18 | 13F | Vicus Capital | 897 | 230 | ||||||
| 2025-08-11 | 13F | HighTower Advisors, LLC | 14 611 | 0,21 | 3 748 | 28,02 | ||||
| 2025-08-12 | 13F | SRS Capital Advisors, Inc. | 5 | 0,00 | 1 | 0,00 | ||||
| 2025-04-28 | 13F | Strategic Financial Concepts, LLC | 0 | −100,00 | 0 | −100,00 | ||||
| 2025-05-13 | 13F | Adams Wealth Management | 37 115 | 6,94 | 7 452 | −13,59 | ||||
| 2025-07-25 | 13F | Hazlett, Burt & Watson, Inc. | 0 | −100,00 | 0 | |||||
| 2025-08-11 | 13F | Principal Securities, Inc. | 673 | 173 | ||||||
| 2025-08-12 | 13F | Global Retirement Partners, LLC | 958 | 2,24 | 246 | 5,60 | ||||
| 2025-07-23 | 13F | Kingswood Wealth Advisors, Llc | 1 150 | −24,49 | 295 | −3,59 | ||||
| 2025-08-12 | 13F | Proequities, Inc. | 0 | 0 | ||||||
| 2025-07-15 | 13F | North Star Investment Management Corp. | 550 | 18,53 | 141 | 51,61 | ||||
| 2025-05-06 | 13F | Hamilton Point Investment Advisors, LLC | 0 | −100,00 | 0 | −100,00 | ||||
| 2025-05-13 | 13F | CacheTech Inc. | 37 115 | 6,94 | 7 452 | −13,59 | ||||
| 2025-08-14 | 13F | Synovus Financial Corp | 1 719 | 441 | ||||||
| 2025-05-14 | 13F | Snowden Capital Advisors LLC | 0 | −100,00 | 0 | |||||
| 2025-08-14 | 13F | Susquehanna International Group, Llp | Put | 11 100 | 13,27 | 2 847 | 44,74 | |||
| 2025-08-14 | 13F | Susquehanna International Group, Llp | 11 984 | 34,12 | 3 074 | 71,44 | ||||
| 2025-08-14 | 13F | Susquehanna International Group, Llp | Call | 42 600 | 48,43 | 10 927 | 89,64 | |||
| 2025-04-14 | 13F | Regent Peak Wealth Advisors LLC | 3 525 | 0,00 | 708 | −19,20 | ||||
| 2025-08-13 | 13F | Northwestern Mutual Wealth Management Co | 3 449 | −24,92 | 885 | −4,12 | ||||
| 2025-08-14 | 13F | MGB Wealth Management, LLC | 32 042 | −1,57 | 8 218 | 25,72 | ||||
| 2025-04-02 | 13F | Marcum Wealth, LLC | 1 040 | 0,00 | 209 | −19,38 | ||||
| 2025-08-19 | 13F | Newbridge Financial Services Group, Inc. | 709 | −9,22 | 182 | 16,03 | ||||
| 2025-08-29 | 13F | Centaurus Financial, Inc. | 4 287 | 75,41 | 1 | |||||
| 2025-07-31 | 13F | Cambridge Investment Research Advisors, Inc. | 15 007 | 4,73 | 4 | 50,00 | ||||
| 2025-07-29 | 13F | Private Trust Co Na | 154 | 2,67 | 40 | 30,00 | ||||
| 2025-08-13 | 13F | Northern Trust Corp | 1 007 | 0,00 | 258 | 27,72 | ||||
| 2025-08-12 | 13F | LPL Financial LLC | 215 028 | −0,10 | 55 157 | 27,63 | ||||
| 2025-08-08 | 13F | Cetera Investment Advisers | 48 939 | 8,15 | 12 553 | 38,19 | ||||
| 2025-08-14 | 13F | Mml Investors Services, Llc | 28 822 | −0,42 | 7 | 40,00 | ||||
| 2025-08-12 | 13F | Archer Investment Corp | 28 | 0,00 | 7 | 40,00 | ||||
| 2025-08-08 | 13F | Hartland & Co., LLC | 25 | 0,00 | 6 | 20,00 | ||||
| 2025-07-15 | 13F | Cranbrook Wealth Management, LLC | 5 | 0,00 | 1 | 0,00 | ||||
| 2025-07-09 | 13F | Bank of New Hampshire | 722 | −28,16 | 185 | −7,96 | ||||
| 2025-07-30 | 13F | Sonata Capital Group Inc | 1 750 | 0,00 | 0 | |||||
| 2025-08-01 | 13F | Belvedere Trading LLC | Call | 5 000 | 138,10 | 1 283 | 204,51 | |||
| 2025-08-01 | 13F | Belvedere Trading LLC | Put | 100 | 0,00 | 26 | 25,00 | |||
| 2025-08-12 | 13F | Laurel Wealth Advisors LLC | 2 566 | 25 560,00 | 0 | −100,00 | ||||
| 2025-08-14 | 13F | Clark Capital Management Group, Inc. | 8 876 | 2 277 | ||||||
| 2025-04-28 | 13F | Financial Advocates Investment Management | 0 | −100,00 | 0 | |||||
| 2025-07-29 | 13F | Harbor Asset Planning, Inc. | 87 | 22 | ||||||
| 2025-08-11 | 13F | Wealthspire Advisors, LLC | 1 096 | 281 | ||||||
| 2025-08-08 | 13F | Gts Securities Llc | 0 | −100,00 | 0 | |||||
| 2025-08-12 | 13F | Concentrum Wealth Management | 1 129 | 290 | ||||||
| 2025-08-14 | 13F | IHT Wealth Management, LLC | 4 918 | −2,98 | 1 262 | 23,99 | ||||
| 2025-08-14 | 13F | Raymond James Financial Inc | 42 810 | −9,98 | 10 981 | 15,01 | ||||
| 2025-07-22 | 13F | Grimes & Company, Inc. | 6 936 | 1 779 | ||||||
| 2025-07-29 | 13F | Dale Q Rice Investment Management Ltd | 10 632 | −51,99 | 2 818 | −36,62 | ||||
| 2025-08-14 | 13F | EP Wealth Advisors, Inc. | 3 335 | −9,82 | 855 | 15,23 | ||||
| 2025-08-14 | 13F | Citadel Advisors Llc | Call | 8 900 | 34,85 | 2 283 | 72,23 | |||
| 2025-08-08 | 13F | Foundations Investment Advisors, LLC | 0 | −100,00 | 0 | −100,00 | ||||
| 2025-08-14 | 13F | Citadel Advisors Llc | 18 359 | 0,56 | 4 709 | 28,49 | ||||
| 2025-08-14 | 13F | Citadel Advisors Llc | Put | 6 300 | −35,05 | 1 616 | −17,00 |
Other Listings
| MX:XSD |