Grundläggande statistik
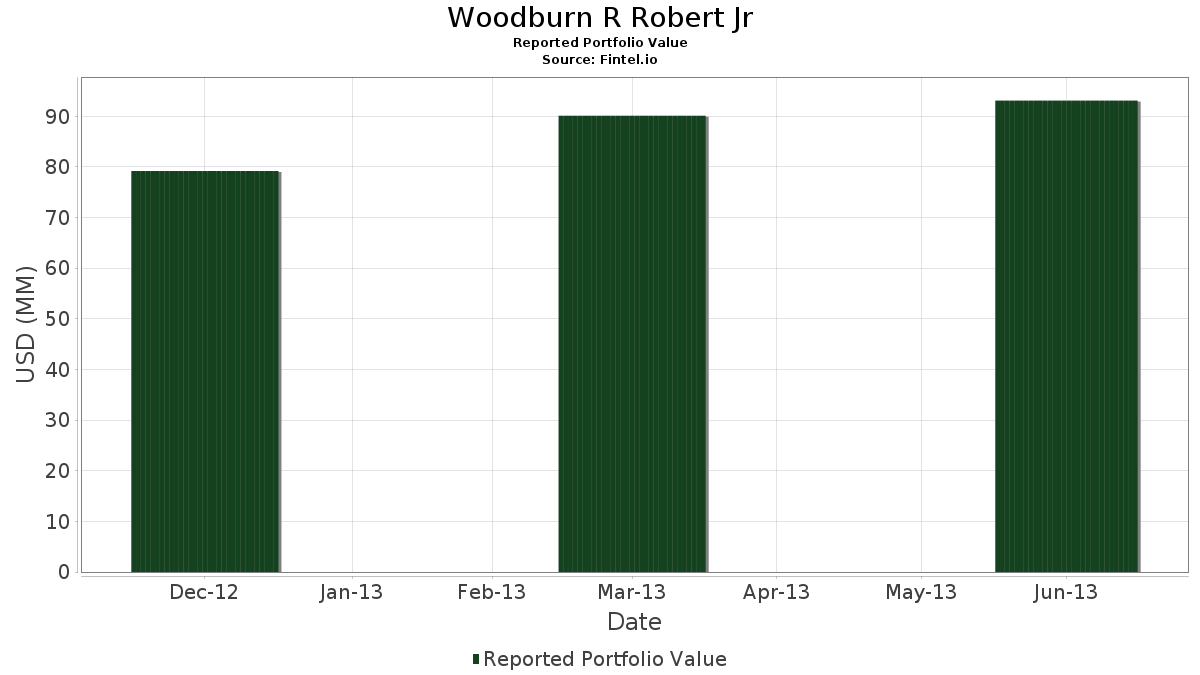
| Portföljvärde | $ 93 101 000 |
| Aktuella positioner | 78 |
Senaste innehav, resultat, förvaltat kapital (från 13F, 13D)
Woodburn R Robert Jr har redovisat 78 totala innehav i sina senaste SEC-arkiveringar. Det senaste portföljvärdet beräknas vara $ 93 101 000 USD. Faktiskt förvaltade tillgångar (AUM) är detta värde plus likvida medel (som inte redovisas). Woodburn R Robert Jrs största innehav är Mac-gray Corp (US:TUC) , Exxon Mobil Corporation (US:XOM) , Johnson & Johnson (US:JNJ) , The Procter & Gamble Company (US:PG) , and Automatic Data Processing, Inc. (US:ADP) . Woodburn R Robert Jrs nya positioner inkluderar Apple Inc. (US:AAPL) , Global X Funds - Global X Emerging Markets Great Consumer ETF (US:EMC) , Roche Holding AG - Depositary Receipt (Common Stock) (US:RHHBY) , .
Största ökningarna detta kvartal
Vi använder förändringen i portföljallokeringen eftersom det är det mest meningsfulla måttet. Förändringar kan bero på transaktioner eller förändringar i aktiekurser.
| Värdepapper | Aktier (MM) |
Värde (MM$) |
Portfölj % av | ΔPortfölj % av |
|---|---|---|---|---|
| 1,13 | 16,11 | 17,3016 | 1,1891 | |
| 0,02 | 0,80 | 0,8550 | 0,8550 | |
| 0,01 | 0,78 | 0,8421 | 0,8421 | |
| 0,01 | 0,61 | 0,6541 | 0,6541 | |
| 0,00 | 0,47 | 0,5005 | 0,5005 | |
| 0,02 | 0,38 | 0,4071 | 0,4071 | |
| 0,00 | 0,33 | 0,3491 | 0,3491 | |
| 0,01 | 0,32 | 0,3469 | 0,3469 | |
| 0,00 | 0,28 | 0,3040 | 0,3040 | |
| 0,04 | 1,08 | 1,1568 | 0,2979 |
Största minskningarna detta kvartal
Vi använder förändringen i portföljallokeringen eftersom det är det mest meningsfulla måttet. Förändringar kan bero på transaktioner eller förändringar i aktiepriser.
| Värdepapper | Aktier (MM) |
Värde (MM$) |
Portfölj % av | ΔPortfölj % av |
|---|---|---|---|---|
| 0,02 | 0,77 | 0,8228 | −0,6343 | |
| 0,14 | 12,88 | 13,8355 | −0,3971 | |
| 0,00 | 0,00 | −0,3629 | ||
| 0,00 | 0,20 | 0,2127 | −0,3522 | |
| 0,05 | 3,60 | 3,8668 | −0,2826 | |
| 0,00 | 0,00 | −0,2741 | ||
| 0,01 | 0,85 | 0,9162 | −0,2712 | |
| 0,00 | 0,00 | −0,2575 | ||
| 0,00 | 0,00 | −0,2464 | ||
| 0,00 | 0,00 | −0,2308 |
13F- och fond arkiveringar
Denna blankett lämnades in den 2013-08-19 för rapporteringsperioden 2013-06-30. Klicka på länksymbolen för att se hela transaktionshistoriken.
Uppgradera för att låsa upp premiumdata och exportera till Excel![]() .
.
| Värdepapper | Typ | Genomsnittligt aktiepris | Aktier (MM) |
ΔAktier (%) |
ΔAktier (%) |
Värde ($MM) |
Portfölj (%) |
ΔPortfölj (%) |
|
|---|---|---|---|---|---|---|---|---|---|
| TUC / Mac-gray Corp | 1,13 | 0,00 | 16,11 | 10,94 | 17,3016 | 1,1891 | |||
| XOM / Exxon Mobil Corporation | 0,14 | 0,17 | 12,88 | 0,44 | 13,8355 | −0,3971 | |||
| JNJ / Johnson & Johnson | 0,06 | −1,27 | 5,54 | 3,98 | 5,9505 | 0,0378 | |||
| PG / The Procter & Gamble Company | 0,05 | −3,63 | 3,60 | −3,72 | 3,8668 | −0,2826 | |||
| ADP / Automatic Data Processing, Inc. | 0,04 | 8,66 | 2,71 | 15,07 | 2,9119 | 0,2973 | |||
| PEP / PepsiCo, Inc. | 0,03 | 1,31 | 2,15 | 4,73 | 2,3061 | 0,0311 | |||
| SPTM / SPDR Series Trust - SPDR Portfolio S&P 1500 Composite Stock Market ETF | 0,02 | 0,00 | 2,04 | 2,20 | 2,1944 | −0,0240 | |||
| VTI / Vanguard Index Funds - Vanguard Total Stock Market ETF | 0,02 | 0,00 | 1,92 | 2,07 | 2,0655 | −0,0253 | |||
| GE / General Electric Company | 0,08 | −0,37 | 1,89 | −0,05 | 2,0322 | −0,0686 | |||
| WMT / Walmart Inc. | 0,02 | −2,10 | 1,74 | −2,52 | 1,8668 | −0,1119 | |||
| EMR / Emerson Electric Co. | 0,03 | 2,08 | 1,74 | −0,34 | 1,8668 | −0,0686 | |||
| MSFT / Microsoft Corporation | 0,05 | −1,13 | 1,58 | 19,47 | 1,7003 | 0,2299 | |||
| INTC / Intel Corporation | 0,06 | −0,79 | 1,57 | 10,08 | 1,6885 | 0,1038 | |||
| MDT / Medtronic plc | 0,03 | −0,36 | 1,44 | 9,25 | 1,5478 | 0,0840 | |||
| FISV / Fiserv, Inc. | 0,02 | 2,05 | 1,41 | 1,51 | 1,5188 | −0,0271 | |||
| SLB / Schlumberger Limited | 0,02 | 13,17 | 1,36 | 8,29 | 1,4586 | 0,0670 | |||
| CVX / Chevron Corporation | 0,01 | 19,65 | 1,17 | 19,13 | 1,2578 | 0,1669 | |||
| MMM / 3M Company | 0,01 | 1,42 | 1,17 | 4,28 | 1,2567 | 0,0116 | |||
| QCOM / QUALCOMM Incorporated | 0,02 | 7,08 | 1,11 | −2,29 | 1,1901 | −0,0684 | |||
| SPY / SPDR S&P 500 ETF | 0,01 | −4,90 | 1,09 | −2,59 | 1,1718 | −0,0711 | |||
| CSCO / Cisco Systems, Inc. | 0,04 | 19,44 | 1,08 | 39,15 | 1,1568 | 0,2979 | |||
| ABT / Abbott Laboratories | 0,03 | 4,93 | 0,96 | 3,65 | 1,0365 | 0,0033 | |||
| XLNX / Xilinx, Inc. | 0,02 | 0,00 | 0,96 | 3,88 | 1,0354 | 0,0056 | |||
| IVV / iShares Trust - iShares Core S&P 500 ETF | 0,01 | −22,06 | 0,85 | −20,28 | 0,9162 | −0,2712 | |||
| SYY / Sysco Corporation | 0,02 | 0,00 | 0,85 | −2,87 | 0,9087 | −0,0579 | |||
| STT / State Street Corporation | 0,01 | 0,00 | 0,82 | 10,35 | 0,8818 | 0,0562 | |||
| HD / The Home Depot, Inc. | 0,01 | −15,35 | 0,81 | −6,13 | 0,8711 | −0,0877 | |||
| ABBV / AbbVie Inc. | 0,02 | −12,69 | 0,80 | −11,56 | 0,8550 | 0,8550 | |||
| ROK / Rockwell Automation, Inc. | 0,01 | 68,93 | 0,78 | 62,66 | 0,8421 | 0,8421 | |||
| BP / BP p.l.c. - Depositary Receipt (Common Stock) | 0,02 | −5,06 | 0,78 | −6,34 | 0,8410 | −0,0867 | |||
| CVS / CVS Health Corporation | 0,01 | 45,88 | 0,78 | 51,75 | 0,8378 | 0,2674 | |||
| AEPFX / Europacific Growth Fund - EuroPacific Growth Fund, Class F-2 | 0,02 | −41,25 | 0,77 | −41,66 | 0,8228 | −0,6343 | |||
| RTX / RTX Corporation | 0,01 | 4,61 | 0,74 | 3,95 | 0,7916 | 0,0048 | |||
| SYK / Stryker Corporation | 0,01 | −4,33 | 0,71 | −5,18 | 0,7669 | −0,0687 | |||
| GIS / General Mills, Inc. | 0,01 | 0,00 | 0,67 | −1,47 | 0,7196 | −0,0350 | |||
| WAG / | 0,01 | −0,90 | 0,64 | −8,26 | 0,6917 | −0,0873 | |||
| MA / Mastercard Incorporated | 0,00 | 16,00 | 0,62 | 22,95 | 0,6616 | 0,1057 | |||
| GSK / GSK plc - Depositary Receipt (Common Stock) | 0,01 | 48,47 | 0,61 | 58,18 | 0,6541 | 0,6541 | |||
| NSRGY / Nestlé S.A. - Depositary Receipt (Common Stock) | 0,01 | 27,48 | 0,61 | 15,78 | 0,6541 | 0,0704 | |||
| NVS / Novartis AG - Depositary Receipt (Common Stock) | 0,01 | 35,74 | 0,61 | 34,67 | 0,6509 | 0,1515 | |||
| TGT / Target Corporation | 0,01 | 0,00 | 0,55 | 0,55 | 0,5865 | −0,0161 | |||
| VNQ / Vanguard Specialized Funds - Vanguard Real Estate ETF | 0,01 | 0,00 | 0,54 | −2,54 | 0,5779 | −0,0347 | |||
| PFE / Pfizer Inc. | 0,02 | 0,00 | 0,54 | −2,90 | 0,5757 | −0,0369 | |||
| AMGN / Amgen Inc. | 0,01 | 0,00 | 0,53 | −3,82 | 0,5682 | −0,0422 | |||
| KMB / Kimberly-Clark Corporation | 0,01 | 0,00 | 0,52 | −0,77 | 0,5532 | −0,0228 | |||
| JCI / Johnson Controls International plc | 0,01 | 23,19 | 0,50 | 25,69 | 0,5413 | 0,0963 | |||
| USB / U.S. Bancorp | 0,01 | 0,00 | 0,49 | 6,55 | 0,5242 | 0,0159 | |||
| US0325111070 / Anadarko Petroleum Corp. | 0,01 | −16,79 | 0,47 | −18,24 | 0,5102 | −0,1346 | |||
| AAPL / Apple Inc. | 0,00 | 0,47 | 0,5005 | 0,5005 | |||||
| APD / Air Products and Chemicals, Inc. | 0,01 | 0,00 | 0,47 | 4,97 | 0,4995 | 0,0078 | |||
| KO / The Coca-Cola Company | 0,01 | 0,00 | 0,42 | −0,93 | 0,4554 | −0,0196 | |||
| DYAX / Dyax Corp. | 0,11 | 0,00 | 0,40 | −20,52 | 0,4243 | −0,1273 | |||
| VWO / Vanguard International Equity Index Funds - Vanguard FTSE Emerging Markets ETF | 0,01 | 0,00 | 0,39 | −9,49 | 0,4200 | −0,0594 | |||
| BMY / Bristol-Myers Squibb Company | 0,01 | 0,00 | 0,38 | 8,57 | 0,4082 | 0,0197 | |||
| EMC / Global X Funds - Global X Emerging Markets Great Consumer ETF | 0,02 | 0,38 | 0,4071 | 0,4071 | |||||
| VANGUARD TOTAL STOCK MARKET IN / Equity Mutual Fu (922908488) | 0,01 | 0,37 | 0,0000 | ||||||
| SIAL / Sigma-Aldrich Corporation | 0,00 | −12,62 | 0,36 | −9,65 | 0,3920 | −0,0563 | |||
| GLW / Corning Incorporated | 0,02 | 6,58 | 0,35 | 13,82 | 0,3716 | 0,0343 | |||
| MRK / Merck & Co., Inc. | 0,01 | 0,00 | 0,34 | 5,20 | 0,3695 | 0,0066 | |||
| TMO / Thermo Fisher Scientific Inc. | 0,00 | −22,00 | 0,33 | −13,61 | 0,3545 | −0,0695 | |||
| ILMN / Illumina, Inc. | 0,00 | 0,00 | 0,33 | 38,89 | 0,3491 | 0,3491 | |||
| ATR / AptarGroup, Inc. | 0,01 | 14,26 | 0,32 | 9,86 | 0,3469 | 0,3469 | |||
| CL / Colgate-Palmolive Company | 0,01 | 102,78 | 0,31 | −1,57 | 0,3373 | −0,0167 | |||
| FIS / Fidelity National Information Services, Inc. | 0,01 | 0,00 | 0,31 | 8,28 | 0,3373 | 0,0154 | |||
| PNC / The PNC Financial Services Group, Inc. | 0,00 | 0,00 | 0,30 | 9,96 | 0,3201 | 0,0193 | |||
| DIS / The Walt Disney Company | 0,00 | 0,00 | 0,29 | 11,11 | 0,3115 | 0,0218 | |||
| 61166W101 / Monsanto Co. | 0,00 | 8,12 | 0,28 | 1,07 | 0,3040 | 0,3040 | |||
| NUE / Nucor Corporation | 0,01 | 0,00 | 0,28 | −6,10 | 0,2975 | −0,0299 | |||
| BA / The Boeing Company | 0,00 | 0,00 | 0,26 | 19,07 | 0,2750 | 0,0364 | |||
| AKAM / Akamai Technologies, Inc. | 0,01 | 0,00 | 0,25 | 20,67 | 0,2696 | 0,0388 | |||
| RHHBY / Roche Holding AG - Depositary Receipt (Common Stock) | 0,00 | 0,25 | 0,2664 | 0,2664 | |||||
| BHI / Baker Hughes Inc. | 0,00 | −7,55 | 0,23 | −8,13 | 0,2427 | −0,0303 | |||
| DBC / Invesco DB Commodity Index Tracking Fund | 0,01 | 0,00 | 0,23 | −8,16 | 0,2417 | −0,0302 | |||
| ADI / Analog Devices, Inc. | 0,01 | 0,00 | 0,23 | −3,02 | 0,2417 | −0,0158 | |||
| CHD / Church & Dwight Co., Inc. | 0,00 | 0,00 | 0,22 | −4,39 | 0,2342 | 0,2342 | |||
| IBM / International Business Machines Corporation | 0,00 | −56,63 | 0,20 | −61,10 | 0,2127 | −0,3522 | |||
| GOOGL / Alphabet Inc. | 0,00 | 0,00 | 0,19 | 10,98 | 0,2062 | 0,2062 | |||
| CB / Chubb Limited | 0,00 | 0,00 | 0,17 | −3,43 | 0,1815 | 0,1815 | |||
| SPGI / S&P Global Inc. | 0,00 | −100,00 | 0,00 | −100,00 | −0,2308 | ||||
| STO / Statoil ASA | 0,00 | −100,00 | 0,00 | −100,00 | −0,2741 | ||||
| TEVA / Teva Pharmaceutical Industries Limited - Depositary Receipt (Common Stock) | 0,00 | −100,00 | 0,00 | −100,00 | −0,2575 | ||||
| RDS.A / Shell Plc - ADR (Representing Ordinary Shares - Class A) | 0,00 | −100,00 | 0,00 | −100,00 | −0,2464 | ||||
| T / AT&T Inc. | 0,00 | −100,00 | 0,00 | −100,00 | 0,0000 | 0,0000 | |||
| NSC / Norfolk Southern Corporation | 0,00 | −100,00 | 0,00 | −100,00 | −0,3629 |