Grundläggande statistik
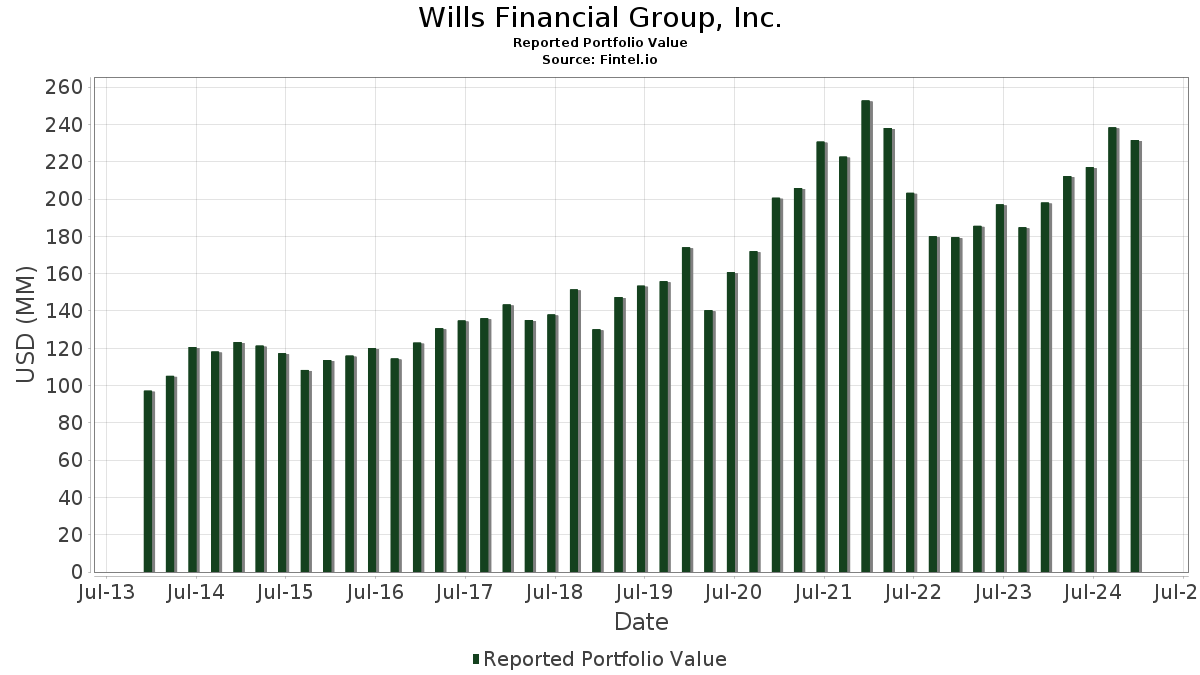
| Portföljvärde | $ 231 605 629 |
| Aktuella positioner | 65 |
Senaste innehav, resultat, förvaltat kapital (från 13F, 13D)
Wills Financial Group, Inc. har redovisat 65 totala innehav i sina senaste SEC-arkiveringar. Det senaste portföljvärdet beräknas vara $ 231 605 629 USD. Faktiskt förvaltade tillgångar (AUM) är detta värde plus likvida medel (som inte redovisas). Wills Financial Group, Inc.s största innehav är Berkshire Hathaway Inc. (US:BRK.B) , Apple Inc. (US:AAPL) , Microsoft Corporation (US:MSFT) , Lockheed Martin Corporation (US:LMT) , and Danaher Corporation (US:DHR) . Wills Financial Group, Inc.s nya positioner inkluderar Oaktree Specialty Lending Corporation (US:OCSL) , Tesla, Inc. (US:TSLA) , .
Största ökningarna detta kvartal
Vi använder förändringen i portföljallokeringen eftersom det är det mest meningsfulla måttet. Förändringar kan bero på transaktioner eller förändringar i aktiekurser.
| Värdepapper | Aktier (MM) |
Värde (MM$) |
Portfölj % av | ΔPortfölj % av |
|---|---|---|---|---|
| 0,17 | 2,54 | 1,0985 | 1,0985 | |
| 0,01 | 3,49 | 1,5077 | 0,7964 | |
| 0,04 | 8,20 | 3,5394 | 0,7742 | |
| 0,07 | 17,41 | 7,5163 | 0,6208 | |
| 0,04 | 8,17 | 3,5254 | 0,5236 | |
| 0,01 | 4,26 | 1,8379 | 0,5210 | |
| 0,02 | 4,54 | 1,9583 | 0,4893 | |
| 0,02 | 4,04 | 1,7451 | 0,3332 | |
| 0,28 | 5,99 | 2,5867 | 0,2362 | |
| 0,04 | 3,16 | 1,3636 | 0,2281 |
Största minskningarna detta kvartal
Vi använder förändringen i portföljallokeringen eftersom det är det mest meningsfulla måttet. Förändringar kan bero på transaktioner eller förändringar i aktiepriser.
| Värdepapper | Aktier (MM) |
Värde (MM$) |
Portfölj % av | ΔPortfölj % av |
|---|---|---|---|---|
| 0,02 | 10,29 | 4,4421 | −1,1997 | |
| 0,02 | 1,46 | 0,6309 | −0,6899 | |
| 0,04 | 9,59 | 4,1426 | −0,6643 | |
| 0,04 | 17,15 | 7,4029 | −0,5968 | |
| 0,04 | 3,47 | 1,4995 | −0,3853 | |
| 0,08 | 4,43 | 1,9131 | −0,3737 | |
| 0,05 | 7,55 | 3,2600 | −0,2468 | |
| 0,06 | 4,80 | 2,0739 | −0,2384 | |
| 0,07 | 2,68 | 1,1592 | −0,2261 | |
| 0,02 | 3,49 | 1,5054 | −0,1580 |
13F- och fond arkiveringar
Denna blankett lämnades in den 2025-02-14 för rapporteringsperioden 2024-12-31. Klicka på länksymbolen för att se hela transaktionshistoriken.
Uppgradera för att låsa upp premiumdata och exportera till Excel![]() .
.
| Värdepapper | Typ | Genomsnittligt aktiepris | Aktier (MM) |
ΔAktier (%) |
ΔAktier (%) |
Värde ($MM) |
Portfölj (%) |
ΔPortfölj (%) |
|
|---|---|---|---|---|---|---|---|---|---|
| BRK.B / Berkshire Hathaway Inc. | 0,05 | −0,89 | 21,23 | −2,39 | 9,1675 | 0,0432 | |||
| AAPL / Apple Inc. | 0,07 | −1,47 | 17,41 | 5,89 | 7,5163 | 0,6208 | |||
| MSFT / Microsoft Corporation | 0,04 | −8,22 | 17,15 | −10,10 | 7,4029 | −0,5968 | |||
| LMT / Lockheed Martin Corporation | 0,02 | −7,99 | 10,29 | −23,51 | 4,4421 | −1,1997 | |||
| DHR / Danaher Corporation | 0,04 | 1,40 | 9,59 | −16,28 | 4,1426 | −0,6643 | |||
| PANW / Palo Alto Networks, Inc. | 0,05 | 77,13 | 9,08 | −5,70 | 3,9187 | −0,1185 | |||
| PG / The Procter & Gamble Company | 0,05 | −0,05 | 8,44 | −3,26 | 3,6447 | −0,0152 | |||
| AMZN / Amazon.com, Inc. | 0,04 | 5,61 | 8,20 | 24,35 | 3,5394 | 0,7742 | |||
| GOOGL / Alphabet Inc. | 0,04 | −0,04 | 8,17 | 14,10 | 3,5254 | 0,5236 | |||
| PEP / PepsiCo, Inc. | 0,05 | 1,00 | 7,55 | −9,69 | 3,2600 | −0,2468 | |||
| KVUE / Kenvue Inc. | 0,28 | 15,83 | 5,99 | 6,91 | 2,5867 | 0,2362 | |||
| CVX / Chevron Corporation | 0,04 | 4,91 | 5,77 | 3,18 | 2,4934 | 0,1458 | |||
| UNP / Union Pacific Corporation | 0,03 | 1,82 | 5,74 | −5,79 | 2,4780 | −0,0776 | |||
| WTRG / Essential Utilities, Inc. | 0,16 | −2,64 | 5,69 | −8,32 | 2,4587 | −0,1467 | |||
| IAU / iShares Gold Trust | 0,11 | 0,07 | 5,67 | −0,30 | 2,4468 | 0,0624 | |||
| GEHC / GE HealthCare Technologies Inc. | 0,06 | 4,60 | 4,80 | −12,86 | 2,0739 | −0,2384 | |||
| SHW / The Sherwin-Williams Company | 0,01 | 1,80 | 4,63 | −9,33 | 1,9977 | −0,1426 | |||
| SPGI / S&P Global Inc. | 0,01 | 1,42 | 4,54 | −2,24 | 1,9594 | 0,0126 | |||
| AVGO / Broadcom Inc. | 0,02 | −3,64 | 4,54 | 29,50 | 1,9583 | 0,4893 | |||
| FERG / Ferguson Enterprises Inc. | 0,03 | 24,84 | 4,50 | 9,15 | 1,9417 | 0,2131 | |||
| D / Dominion Energy, Inc. | 0,08 | −12,80 | 4,43 | −18,73 | 1,9131 | −0,3737 | |||
| ACN / Accenture plc | 0,01 | 36,23 | 4,26 | 35,58 | 1,8379 | 0,5210 | |||
| JPM / JPMorgan Chase & Co. | 0,02 | 5,62 | 4,04 | 20,05 | 1,7451 | 0,3332 | |||
| CF / CF Industries Holdings, Inc. | 0,04 | 4,37 | 3,67 | 3,79 | 1,5829 | 0,1012 | |||
| V / Visa Inc. | 0,01 | 79,16 | 3,49 | 105,96 | 1,5077 | 0,7964 | |||
| ZTS / Zoetis Inc. | 0,02 | 5,43 | 3,49 | −12,08 | 1,5054 | −0,1580 | |||
| MRK / Merck & Co., Inc. | 0,03 | 15,99 | 3,48 | 1,61 | 1,5027 | 0,0659 | |||
| COP / ConocoPhillips | 0,04 | −17,95 | 3,47 | −22,72 | 1,4995 | −0,3853 | |||
| SO / The Southern Company | 0,04 | 27,81 | 3,16 | 16,70 | 1,3636 | 0,2281 | |||
| VZ / Verizon Communications Inc. | 0,07 | −8,71 | 2,68 | −18,72 | 1,1592 | −0,2261 | |||
| OCSL / Oaktree Specialty Lending Corporation | 0,17 | 2,54 | 1,0985 | 1,0985 | |||||
| NEE.PRN / NextEra Energy Capital Holdings, Inc. - Corporate Bond/Note | 0,03 | 4,36 | 2,45 | −11,50 | 1,0567 | −0,1032 | |||
| SCHD / Schwab Strategic Trust - Schwab U.S. Dividend Equity ETF | 0,06 | 206,47 | 1,61 | −0,98 | 0,6950 | 0,0134 | |||
| NOC / Northrop Grumman Corporation | 0,00 | −2,96 | 1,60 | −13,80 | 0,6907 | −0,0876 | |||
| NSC / Norfolk Southern Corporation | 0,01 | −0,11 | 1,47 | −5,70 | 0,6363 | −0,0190 | |||
| NKE / NIKE, Inc. | 0,02 | −45,79 | 1,46 | −53,60 | 0,6309 | −0,6899 | |||
| MKC / McCormick & Company, Incorporated | 0,02 | −11,27 | 1,31 | −17,78 | 0,5671 | −0,1031 | |||
| GOOG / Alphabet Inc. | 0,00 | 0,00 | 0,94 | 13,94 | 0,4062 | 0,0598 | |||
| ALB / Albemarle Corporation | 0,01 | −16,77 | 0,92 | −24,36 | 0,3955 | −0,1124 | |||
| TXN / Texas Instruments Incorporated | 0,00 | 9,84 | 0,91 | −0,22 | 0,3921 | 0,0100 | |||
| CME / CME Group Inc. | 0,00 | 0,03 | 0,82 | 5,24 | 0,3561 | 0,0275 | |||
| XOM / Exxon Mobil Corporation | 0,01 | 0,05 | 0,80 | −8,18 | 0,3445 | −0,0200 | |||
| JNJ / Johnson & Johnson | 0,01 | −5,58 | 0,79 | −15,83 | 0,3402 | −0,0520 | |||
| DUK / Duke Energy Corporation | 0,01 | −0,55 | 0,74 | −7,04 | 0,3196 | −0,0145 | |||
| BX / Blackstone Inc. | 0,00 | 47,49 | 0,73 | 66,21 | 0,3147 | 0,1306 | |||
| TMO / Thermo Fisher Scientific Inc. | 0,00 | −2,58 | 0,71 | −18,08 | 0,3053 | −0,0568 | |||
| HD / The Home Depot, Inc. | 0,00 | 0,06 | 0,66 | −3,94 | 0,2846 | −0,0032 | |||
| KO / The Coca-Cola Company | 0,01 | 0,26 | 0,64 | −13,13 | 0,2772 | −0,0328 | |||
| RDVY / First Trust Exchange-Traded Fund VI - First Trust Rising Dividend Achievers ETF | 0,01 | 83,43 | 0,49 | 82,90 | 0,2128 | 0,1000 | |||
| NVDA / NVIDIA Corporation | 0,00 | 0,24 | 0,46 | 10,71 | 0,1968 | 0,0243 | |||
| PM / Philip Morris International Inc. | 0,00 | 5,78 | 0,44 | 4,76 | 0,1903 | 0,0140 | |||
| LOW / Lowe's Companies, Inc. | 0,00 | 0,00 | 0,43 | −8,88 | 0,1865 | −0,0123 | |||
| IVV / iShares Trust - iShares Core S&P 500 ETF | 0,00 | 3,31 | 0,37 | 5,46 | 0,1589 | 0,0125 | |||
| JEPI / J.P. Morgan Exchange-Traded Fund Trust - JPMorgan Equity Premium Income ETF | 0,01 | 54,89 | 0,35 | 49,79 | 0,1522 | 0,0535 | |||
| RTX / RTX Corporation | 0,00 | −2,94 | 0,32 | −7,43 | 0,1401 | −0,0067 | |||
| VB / Vanguard Index Funds - Vanguard Small-Cap ETF | 0,00 | 0,00 | 0,31 | 1,30 | 0,1345 | 0,0055 | |||
| MCK / McKesson Corporation | 0,00 | 0,00 | 0,28 | 14,98 | 0,1230 | 0,0193 | |||
| PFE / Pfizer Inc. | 0,01 | −21,24 | 0,28 | −27,79 | 0,1203 | −0,0416 | |||
| TSLA / Tesla, Inc. | 0,00 | 0,27 | 0,1147 | 0,1147 | |||||
| MKL / Markel Group Inc. | 0,00 | 0,00 | 0,25 | 10,36 | 0,1058 | 0,0124 | |||
| ISRG / Intuitive Surgical, Inc. | 0,00 | 0,00 | 0,23 | 5,88 | 0,1014 | 0,0087 | |||
| MCD / McDonald's Corporation | 0,00 | 0,00 | 0,22 | −4,68 | 0,0970 | −0,0020 | |||
| BKLC / BNY Mellon ETF Trust - BNY Mellon US Large Cap Core Equity ETF | 0,00 | −21,31 | 0,22 | −19,42 | 0,0968 | −0,0200 | |||
| HII / Huntington Ingalls Industries, Inc. | 0,00 | 2,20 | 0,22 | −27,00 | 0,0947 | −0,0312 | |||
| PNC / The PNC Financial Services Group, Inc. | 0,00 | 0,00 | 0,21 | 4,46 | 0,0914 | 0,0063 | |||
| ZBRA / Zebra Technologies Corporation | 0,00 | −100,00 | 0,00 | −100,00 | −0,1445 | ||||
| SWK / Stanley Black & Decker, Inc. | 0,00 | −100,00 | 0,00 | 0,0000 |