Grundläggande statistik
| Portföljvärde | $ 1 543 438 |
| Aktuella positioner | 107 |
Senaste innehav, resultat, förvaltat kapital (från 13F, 13D)
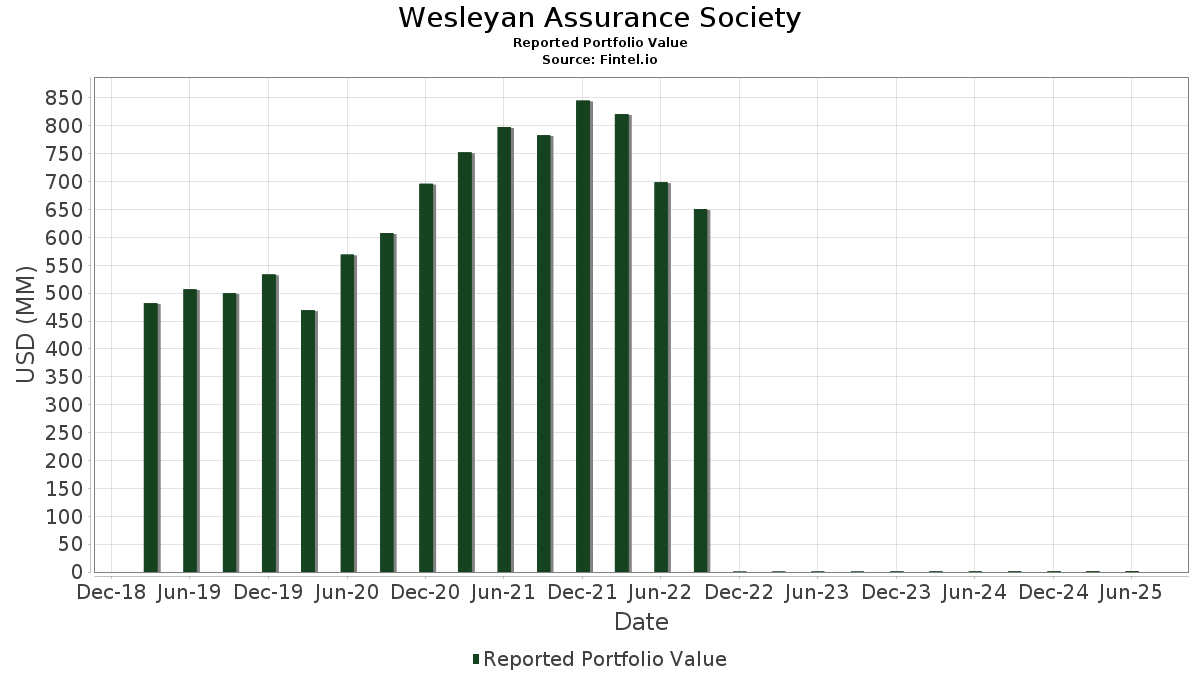
Wesleyan Assurance Society har redovisat 107 totala innehav i sina senaste SEC-arkiveringar. Det senaste portföljvärdet beräknas vara $ 1 543 438 USD. Faktiskt förvaltade tillgångar (AUM) är detta värde plus likvida medel (som inte redovisas). Wesleyan Assurance Societys största innehav är Microsoft Corporation (US:MSFT) , Ferguson Enterprises Inc. (US:FERG) , Alphabet Inc. (US:GOOGL) , Meta Platforms, Inc. (US:META) , and NVIDIA Corporation (US:NVDA) . Wesleyan Assurance Societys nya positioner inkluderar Amrize AG (US:AMRZ) , Amcor plc (US:AMCR) , .
Största ökningarna detta kvartal
Vi använder förändringen i portföljallokeringen eftersom det är det mest meningsfulla måttet. Förändringar kan bero på transaktioner eller förändringar i aktiekurser.
| Värdepapper | Aktier (MM) |
Värde (MM$) |
Portfölj % av | ΔPortfölj % av |
|---|---|---|---|---|
| 0,26 | 0,13 | 8,5120 | 1,1478 | |
| 0,50 | 0,11 | 7,0739 | 1,1036 | |
| 0,46 | 0,07 | 4,6560 | 0,9691 | |
| 0,23 | 0,05 | 3,3034 | 0,7109 | |
| 0,14 | 0,03 | 1,9224 | 0,5113 | |
| 0,10 | 0,07 | 4,8040 | 0,4928 | |
| 0,01 | 0,01 | 0,5300 | 0,3766 | |
| 0,54 | 0,10 | 6,2069 | 0,2999 | |
| 0,28 | 0,01 | 0,7608 | 0,2178 | |
| 0,38 | 0,02 | 1,0668 | 0,2085 |
Största minskningarna detta kvartal
Vi använder förändringen i portföljallokeringen eftersom det är det mest meningsfulla måttet. Förändringar kan bero på transaktioner eller förändringar i aktiepriser.
| Värdepapper | Aktier (MM) |
Värde (MM$) |
Portfölj % av | ΔPortfölj % av |
|---|---|---|---|---|
| 0,06 | 0,02 | 1,2435 | −1,1521 | |
| 0,34 | 0,07 | 4,5655 | −1,1074 | |
| 0,06 | 0,01 | 0,6865 | −0,3617 | |
| 0,08 | 0,02 | 1,1608 | −0,3255 | |
| 0,13 | 0,02 | 1,3198 | −0,2878 | |
| 0,04 | 0,04 | 2,4728 | −0,2217 | |
| 0,32 | 0,02 | 1,3815 | −0,2136 | |
| 0,07 | 0,02 | 1,5235 | −0,2108 | |
| 0,14 | 0,01 | 0,6989 | −0,2105 | |
| 0,06 | 0,01 | 0,3590 | −0,1978 |
13F- och fond arkiveringar
Denna blankett lämnades in den 2025-08-01 för rapporteringsperioden 2025-06-30. Klicka på länksymbolen för att se hela transaktionshistoriken.
Uppgradera för att låsa upp premiumdata och exportera till Excel![]() .
.
| Värdepapper | Typ | Genomsnittligt aktiepris | Aktier (MM) |
ΔAktier (%) |
ΔAktier (%) |
Värde ($MM) |
Portfölj (%) |
ΔPortfölj (%) |
|
|---|---|---|---|---|---|---|---|---|---|
| MSFT / Microsoft Corporation | 0,26 | 0,01 | 0,13 | 32,32 | 8,5120 | 1,1478 | |||
| FERG / Ferguson Enterprises Inc. | 0,50 | 0,00 | 0,11 | 36,25 | 7,0739 | 1,1036 | |||
| GOOGL / Alphabet Inc. | 0,54 | 5,76 | 0,10 | 20,25 | 6,2069 | 0,2999 | |||
| META / Meta Platforms, Inc. | 0,10 | −0,16 | 0,07 | 29,82 | 4,8040 | 0,4928 | |||
| NVDA / NVIDIA Corporation | 0,46 | −0,16 | 0,07 | 44,90 | 4,6560 | 0,9691 | |||
| AAPL / Apple Inc. | 0,34 | 0,00 | 0,07 | −7,89 | 4,5655 | −1,1074 | |||
| AMZN / Amazon.com, Inc. | 0,23 | 26,81 | 0,05 | 47,06 | 3,3034 | 0,7109 | |||
| JPM / JPMorgan Chase & Co. | 0,15 | 0,00 | 0,04 | 20,00 | 2,7518 | 0,0791 | |||
| CAT / Caterpillar Inc. | 0,10 | 0,00 | 0,04 | 15,15 | 2,5237 | 0,0619 | |||
| GWW / W.W. Grainger, Inc. | 0,04 | 0,00 | 0,04 | 5,56 | 2,4728 | −0,2217 | |||
| 1BKNG / Booking Holdings Inc. | 0,01 | −0,04 | 0,03 | 25,00 | 1,9933 | 0,1717 | |||
| ORCL / Oracle Corporation | 0,14 | 0,00 | 0,03 | 61,11 | 1,9224 | 0,5113 | |||
| DIS / The Walt Disney Company | 0,22 | −0,19 | 0,03 | 23,81 | 1,7460 | 0,1476 | |||
| URI / United Rentals, Inc. | 0,04 | 0,00 | 0,03 | 18,18 | 1,7203 | 0,0804 | |||
| C / Citigroup Inc. | 0,31 | 0,00 | 0,03 | 19,05 | 1,6816 | 0,0713 | |||
| BAC / Bank of America Corporation | 0,50 | 0,00 | 0,02 | 15,00 | 1,5392 | −0,0207 | |||
| V / Visa Inc. | 0,07 | −0,44 | 0,02 | 0,00 | 1,5235 | −0,2108 | |||
| MDLZ / Mondelez International, Inc. | 0,32 | 0,00 | 0,02 | 0,00 | 1,3815 | −0,2136 | |||
| PG / The Procter & Gamble Company | 0,13 | 0,79 | 0,02 | −4,76 | 1,3198 | −0,2878 | |||
| MA / Mastercard Incorporated | 0,04 | −0,22 | 0,02 | 5,26 | 1,3169 | −0,1604 | |||
| ADBE / Adobe Inc. | 0,05 | 0,00 | 0,02 | 5,26 | 1,3049 | −0,1797 | |||
| AXP / American Express Company | 0,06 | 0,00 | 0,02 | 18,75 | 1,2878 | 0,0404 | |||
| UNH / UnitedHealth Group Incorporated | 0,06 | 0,00 | 0,02 | −40,62 | 1,2435 | −1,1521 | |||
| MMC / Marsh & McLennan Companies, Inc. | 0,08 | 0,00 | 0,02 | −10,53 | 1,1608 | −0,3255 | |||
| RTX / RTX Corporation | 0,11 | 0,00 | 0,02 | 6,67 | 1,0865 | −0,0443 | |||
| FCX / Freeport-McMoRan Inc. | 0,38 | 24,59 | 0,02 | 45,45 | 1,0668 | 0,2085 | |||
| EMR / Emerson Electric Co. | 0,11 | 0,00 | 0,01 | 16,67 | 0,9584 | 0,0535 | |||
| KO / The Coca-Cola Company | 0,21 | −0,31 | 0,01 | 0,00 | 0,9514 | −0,1578 | |||
| WMT / Walmart Inc. | 0,15 | 0,00 | 0,01 | 16,67 | 0,9262 | −0,0287 | |||
| HD / The Home Depot, Inc. | 0,04 | 0,00 | 0,01 | 0,00 | 0,9168 | −0,1348 | |||
| VZ / Verizon Communications Inc. | 0,32 | 0,00 | 0,01 | −7,14 | 0,9039 | −0,1839 | |||
| BA / The Boeing Company | 0,07 | 0,00 | 0,01 | 18,18 | 0,9024 | 0,0590 | |||
| MMM / 3M Company | 0,09 | 0,00 | 0,01 | 8,33 | 0,8446 | −0,0913 | |||
| CL / Colgate-Palmolive Company | 0,14 | −0,20 | 0,01 | −7,69 | 0,8401 | −0,1562 | |||
| BRKR / Bruker Corporation | 0,28 | 62,86 | 0,01 | 57,14 | 0,7608 | 0,2178 | |||
| JNJ / Johnson & Johnson | 0,08 | 0,00 | 0,01 | −8,33 | 0,7496 | −0,1853 | |||
| SIG / Signet Jewelers Limited | 0,14 | 0,00 | 0,01 | 37,50 | 0,7277 | 0,1184 | |||
| PYPL / PayPal Holdings, Inc. | 0,15 | 4,90 | 0,01 | 22,22 | 0,7214 | 0,0287 | |||
| MRK / Merck & Co., Inc. | 0,14 | 0,00 | 0,01 | −16,67 | 0,6989 | −0,2105 | |||
| BDX / Becton, Dickinson and Company | 0,06 | −0,06 | 0,01 | −28,57 | 0,6865 | −0,3617 | |||
| RL / Ralph Lauren Corporation | 0,04 | 0,00 | 0,01 | 25,00 | 0,6838 | 0,0524 | |||
| HON / Honeywell International Inc. | 0,04 | 0,00 | 0,01 | 11,11 | 0,6721 | −0,0292 | |||
| TJX / The TJX Companies, Inc. | 0,08 | 0,00 | 0,01 | 11,11 | 0,6500 | −0,0855 | |||
| RCL / Royal Caribbean Cruises Ltd. | 0,03 | 0,00 | 0,01 | 50,00 | 0,6332 | 0,1558 | |||
| MU / Micron Technology, Inc. | 0,08 | 0,00 | 0,01 | 50,00 | 0,6233 | 0,1189 | |||
| FLR / Fluor Corporation | 0,17 | 0,00 | 0,01 | 33,33 | 0,5812 | 0,1156 | |||
| PEP / PepsiCo, Inc. | 0,06 | 0,00 | 0,01 | −11,11 | 0,5474 | −0,1660 | |||
| LLY / Eli Lilly and Company | 0,01 | 320,00 | 0,01 | 300,00 | 0,5300 | 0,3766 | |||
| LMT / Lockheed Martin Corporation | 0,02 | 0,00 | 0,01 | 0,00 | 0,5099 | −0,0543 | |||
| DPZ / Domino's Pizza, Inc. | 0,02 | 0,00 | 0,01 | 0,00 | 0,5031 | −0,0850 | |||
| CSCO / Cisco Systems, Inc. | 0,11 | 0,00 | 0,01 | 16,67 | 0,4971 | −0,0104 | |||
| YUMC / Yum China Holdings, Inc. | 0,17 | 0,00 | 0,01 | −12,50 | 0,4881 | −0,1646 | |||
| YUM / Yum! Brands, Inc. | 0,05 | 0,00 | 0,01 | 0,00 | 0,4598 | −0,1008 | |||
| WFC / Wells Fargo & Company | 0,09 | 0,00 | 0,01 | 0,00 | 0,4487 | −0,0130 | |||
| CARR / Carrier Global Corporation | 0,09 | 0,00 | 0,01 | 20,00 | 0,4369 | 0,0024 | |||
| CTSH / Cognizant Technology Solutions Corporation | 0,09 | 0,00 | 0,01 | 0,00 | 0,4322 | −0,0539 | |||
| EA / Electronic Arts Inc. | 0,04 | 0,00 | 0,01 | 20,00 | 0,4292 | −0,0166 | |||
| AA / Alcoa Corporation | 0,20 | 0,00 | 0,01 | −16,67 | 0,3851 | −0,0718 | |||
| DD / DuPont de Nemours, Inc. | 0,08 | 0,00 | 0,01 | −16,67 | 0,3753 | −0,0939 | |||
| NKE / NIKE, Inc. | 0,08 | 0,00 | 0,01 | 0,00 | 0,3669 | −0,0096 | |||
| IP / International Paper Company | 0,12 | 0,00 | 0,01 | −16,67 | 0,3633 | −0,1067 | |||
| JXN / Jackson Financial Inc. | 0,06 | −30,23 | 0,01 | −28,57 | 0,3590 | −0,1978 | |||
| ADSK / Autodesk, Inc. | 0,02 | 0,00 | 0,01 | 25,00 | 0,3584 | 0,0105 | |||
| ADP / Automatic Data Processing, Inc. | 0,02 | 0,00 | 0,01 | 0,00 | 0,3514 | −0,0483 | |||
| 0HAV / Agilent Technologies, Inc. | 0,04 | 90,21 | 0,01 | 150,00 | 0,3416 | 0,1373 | |||
| XYL / Xylem Inc. | 0,04 | 0,00 | 0,01 | 25,00 | 0,3389 | −0,0202 | |||
| CMCSA / Comcast Corporation | 0,12 | 0,00 | 0,00 | 0,00 | 0,2796 | −0,0522 | |||
| PFE / Pfizer Inc. | 0,18 | 0,00 | 0,00 | 0,00 | 0,2755 | −0,0550 | |||
| SBUX / Starbucks Corporation | 0,05 | 0,00 | 0,00 | 0,00 | 0,2716 | −0,0620 | |||
| SYK / Stryker Corporation | 0,01 | 0,00 | 0,00 | 33,33 | 0,2716 | −0,0218 | |||
| IVZ / Invesco Ltd. | 0,26 | −30,77 | 0,00 | −20,00 | 0,2638 | −0,1567 | |||
| CHKP / Check Point Software Technologies Ltd. | 0,02 | 0,00 | 0,00 | 0,00 | 0,2508 | −0,0457 | |||
| WAZ / Waters Corporation | 0,01 | 0,00 | 0,00 | −25,00 | 0,2489 | −0,0522 | |||
| OTIS / Otis Worldwide Corporation | 0,04 | 0,00 | 0,00 | 0,00 | 0,2443 | −0,0480 | |||
| BALL / Ball Corporation | 0,06 | 0,00 | 0,00 | 0,00 | 0,2264 | −0,0148 | |||
| T / AT&T Inc. | 0,12 | 0,00 | 0,00 | 0,00 | 0,2248 | −0,0277 | |||
| WM / Waste Management, Inc. | 0,02 | 0,00 | 0,00 | 0,00 | 0,2237 | −0,0360 | |||
| KMB / Kimberly-Clark Corporation | 0,03 | 0,00 | 0,00 | 0,00 | 0,2194 | −0,0585 | |||
| INTC / Intel Corporation | 0,14 | 0,00 | 0,00 | 0,00 | 0,2088 | −0,0343 | |||
| IFF / International Flavors & Fragrances Inc. | 0,04 | 0,00 | 0,00 | 0,00 | 0,1983 | −0,0418 | |||
| TMO / Thermo Fisher Scientific Inc. | 0,01 | 0,00 | 0,00 | −33,33 | 0,1863 | −0,0762 | |||
| BMY / Bristol-Myers Squibb Company | 0,06 | 0,00 | 0,00 | −33,33 | 0,1784 | −0,0915 | |||
| TRV / The Travelers Companies, Inc. | 0,01 | 0,00 | 0,00 | 0,00 | 0,1688 | −0,0227 | |||
| FOXA / Fox Corporation | 0,04 | 0,00 | 0,00 | 0,00 | 0,1609 | −0,0257 | |||
| AMRZ / Amrize AG | 0,05 | 0,00 | 0,1518 | 0,1518 | |||||
| CTVA / Corteva, Inc. | 0,03 | 0,00 | 0,00 | 100,00 | 0,1473 | 0,0045 | |||
| FAST / Fastenal Company | 0,05 | 100,00 | 0,00 | 100,00 | 0,1339 | −0,0080 | |||
| KHC / The Kraft Heinz Company | 0,07 | 0,00 | 0,00 | −50,00 | 0,1248 | −0,0440 | |||
| AMCR / Amcor plc | 0,21 | 0,00 | 0,1239 | 0,1239 | |||||
| EL / The Estée Lauder Companies Inc. | 0,02 | 0,00 | 0,00 | 0,00 | 0,1236 | 0,0077 | |||
| TII / Texas Instruments Incorporated | 0,01 | 0,00 | 0,00 | 0,00 | 0,1217 | 0,0007 | |||
| NFLX / Netflix, Inc. | 0,00 | 24,00 | 0,00 | 0,1076 | 0,0592 | ||||
| GCPD / General Electric Company | 0,01 | 0,00 | 0,00 | 0,00 | 0,1075 | 0,0114 | |||
| TGT / Target Corporation | 0,02 | 0,00 | 0,00 | 0,00 | 0,1055 | −0,0225 | |||
| SOLV / Solventum Corporation | 0,02 | 0,00 | 0,00 | 0,00 | 0,1053 | −0,0158 | |||
| WBA / Walgreens Boots Alliance, Inc. | 0,12 | 0,00 | 0,00 | 0,00 | 0,0917 | −0,0108 | |||
| GEV / GE Vernova Inc. | 0,00 | 0,00 | 0,00 | 0,0895 | 0,0302 | ||||
| KVUE / Kenvue Inc. | 0,06 | 0,00 | 0,00 | 0,00 | 0,0799 | −0,0252 | |||
| SABR / Sabre Corporation | 0,25 | 0,00 | 0,00 | 0,0510 | −0,0011 | ||||
| DOW / Dow Inc. | 0,03 | 0,00 | 0,00 | 0,0468 | −0,0241 | ||||
| MASI / Masimo Corporation | 0,00 | 0,00 | 0,00 | 0,0278 | −0,0037 | ||||
| GEHC / GE HealthCare Technologies Inc. | 0,00 | 0,00 | 0,00 | 0,0171 | −0,0042 | ||||
| SCHW / The Charles Schwab Corporation | 0,00 | 0,00 | 0,00 | 0,0074 | 0,0001 | ||||
| MELI / MercadoLibre, Inc. | 0,00 | 0,00 | 0,00 | 0,0059 | 0,0008 | ||||
| AABA / Altaba Inc | 0,17 | 0,00 | 0,00 | 0,0051 | −0,0033 | ||||
| KDP / Keurig Dr Pepper Inc. | 0,00 | 0,00 | 0,00 | 0,0032 | −0,0006 | ||||
| EMBC / Embecta Corp. | 0,00 | 0,00 | 0,00 | 0,0006 | −0,0003 | ||||
| CME / CME Group Inc. | 0,00 | −100,00 | 0,00 | 0,0000 | |||||
| CZOO / Cazoo Group Ltd | 0,00 | 0,00 | 0,00 | 0,0000 | 0,0000 |