Grundläggande statistik
| Portföljvärde | $ 994 303 |
| Aktuella positioner | 146 |
Senaste innehav, resultat, förvaltat kapital (från 13F, 13D)
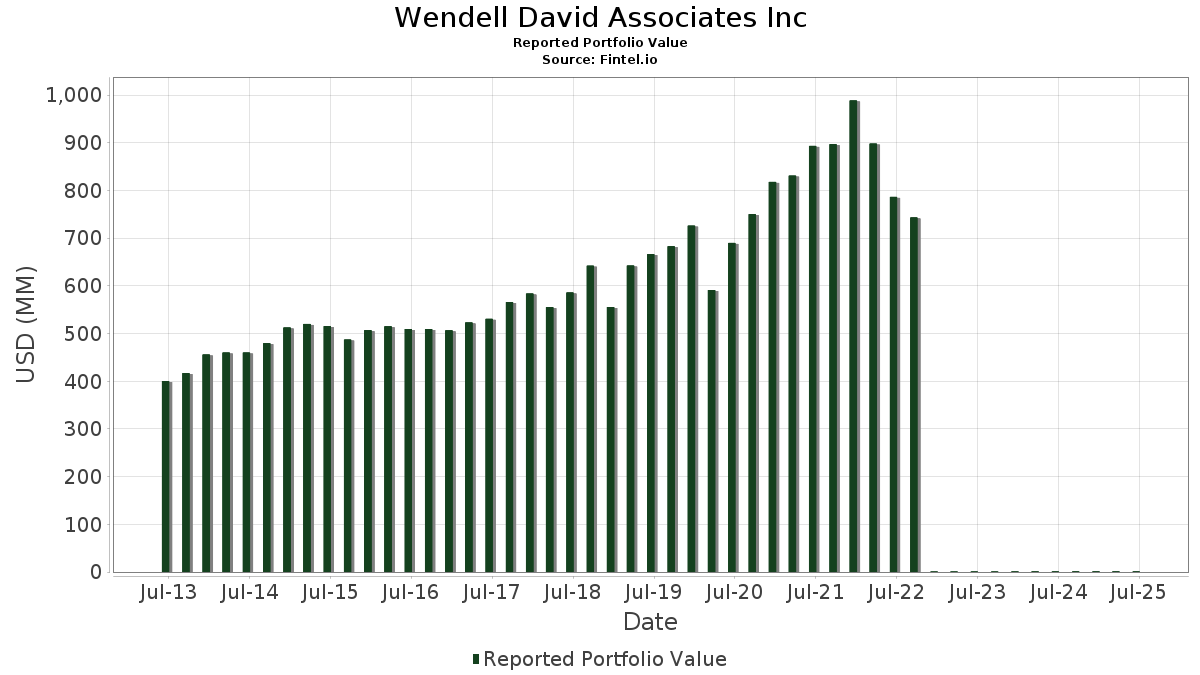
Wendell David Associates Inc har redovisat 146 totala innehav i sina senaste SEC-arkiveringar. Det senaste portföljvärdet beräknas vara $ 994 303 USD. Faktiskt förvaltade tillgångar (AUM) är detta värde plus likvida medel (som inte redovisas). Wendell David Associates Incs största innehav är Microsoft Corporation (US:MSFT) , Mastercard Incorporated (US:MA) , Apple Inc. (US:AAPL) , Automatic Data Processing, Inc. (US:ADP) , and The TJX Companies, Inc. (US:TJX) .
Största ökningarna detta kvartal
Vi använder förändringen i portföljallokeringen eftersom det är det mest meningsfulla måttet. Förändringar kan bero på transaktioner eller förändringar i aktiekurser.
| Värdepapper | Aktier (MM) |
Värde (MM$) |
Portfölj % av | ΔPortfölj % av |
|---|---|---|---|---|
| MSFT / Microsoft Corporation | 0,13 | 0,07 | 6,6933 | 1,6356 |
| INTU / Intuit Inc. | 0,04 | 0,03 | 3,1620 | 0,7095 |
| GOOGL / Alphabet Inc. | 0,12 | 0,02 | 2,0825 | 0,2866 |
| SYK / Stryker Corporation | 0,11 | 0,04 | 4,5203 | 0,1961 |
| MPC / Marathon Petroleum Corporation | 0,08 | 0,01 | 1,2799 | 0,1672 |
| IDXX / IDEXX Laboratories, Inc. | 0,01 | 0,01 | 0,7094 | 0,1575 |
| APH / Amphenol Corporation | 0,04 | 0,00 | 0,4098 | 0,1560 |
| VEEV / Veeva Systems Inc. | 0,02 | 0,01 | 0,5616 | 0,1486 |
| DE / Deere & Company | 0,01 | 0,00 | 0,4063 | 0,1035 |
| AMZN / Amazon.com, Inc. | 0,04 | 0,01 | 0,8609 | 0,0980 |
Största minskningarna detta kvartal
Vi använder förändringen i portföljallokeringen eftersom det är det mest meningsfulla måttet. Förändringar kan bero på transaktioner eller förändringar i aktiepriser.
| Värdepapper | Aktier (MM) |
Värde (MM$) |
Portfölj % av | ΔPortfölj % av |
|---|---|---|---|---|
| AAPL / Apple Inc. | 0,27 | 0,06 | 5,5831 | −0,9031 |
| FI / Fiserv, Inc. | 0,13 | 0,02 | 2,2976 | −0,6575 |
| CHD / Church & Dwight Co., Inc. | 0,16 | 0,02 | 1,5583 | −0,2824 |
| LLY / Eli Lilly and Company | 0,04 | 0,03 | 3,2657 | −0,2716 |
| ABBV / AbbVie Inc. | 0,10 | 0,02 | 1,8624 | −0,2672 |
| DHR / Danaher Corporation | 0,05 | 0,01 | 1,0298 | −0,2475 |
| WSO.B / Watsco, Inc. | 0,03 | 0,01 | 1,4245 | −0,2029 |
| PEP / PepsiCo, Inc. | 0,08 | 0,01 | 1,0363 | −0,1808 |
| BFB / Brown-Forman Corp. - Class B | 0,10 | 0,00 | 0,2738 | −0,1727 |
| MKC.V / McCormick & Company, Incorporated | 0,16 | 0,01 | 1,2113 | −0,1498 |
13F- och fond arkiveringar
Denna blankett lämnades in den 2025-07-29 för rapporteringsperioden 2025-06-30. Klicka på länksymbolen för att se hela transaktionshistoriken.
Uppgradera för att låsa upp premiumdata och exportera till Excel![]() .
.
| Värdepapper | Typ | Genomsnittligt aktiepris | Aktier (MM) |
ΔAktier (%) |
ΔAktier (%) |
Värde ($MM) |
Portfölj (%) |
ΔPortfölj (%) |
|
|---|---|---|---|---|---|---|---|---|---|
| MSFT / Microsoft Corporation | 0,13 | −0,92 | 0,07 | 32,00 | 6,6933 | 1,6356 | |||
| MA / Mastercard Incorporated | 0,12 | −2,31 | 0,06 | 0,00 | 6,5000 | 0,0611 | |||
| AAPL / Apple Inc. | 0,27 | −7,55 | 0,06 | −15,38 | 5,5831 | −0,9031 | |||
| ADP / Automatic Data Processing, Inc. | 0,18 | −0,83 | 0,06 | 0,00 | 5,5817 | 0,0500 | |||
| TJX / The TJX Companies, Inc. | 0,38 | −1,96 | 0,05 | 0,00 | 4,7269 | 0,0093 | |||
| SYK / Stryker Corporation | 0,11 | −2,42 | 0,04 | 2,33 | 4,5203 | 0,1961 | |||
| LLY / Eli Lilly and Company | 0,04 | −2,96 | 0,03 | −8,57 | 3,2657 | −0,2716 | |||
| INTU / Intuit Inc. | 0,04 | −0,29 | 0,03 | 29,17 | 3,1620 | 0,7095 | |||
| ABT / Abbott Laboratories | 0,22 | −1,13 | 0,03 | 0,00 | 2,9796 | 0,0636 | |||
| BR / Broadridge Financial Solutions, Inc. | 0,10 | −1,45 | 0,02 | 0,00 | 2,4670 | −0,0106 | |||
| FI / Fiserv, Inc. | 0,13 | −1,20 | 0,02 | −24,14 | 2,2976 | −0,6575 | |||
| MCD / McDonald's Corporation | 0,07 | −0,57 | 0,02 | −8,70 | 2,1818 | −0,1458 | |||
| GOOGL / Alphabet Inc. | 0,12 | 0,95 | 0,02 | 17,65 | 2,0825 | 0,2866 | |||
| ECL / Ecolab Inc. | 0,07 | −2,74 | 0,02 | 5,56 | 1,9209 | 0,0772 | |||
| ABBV / AbbVie Inc. | 0,10 | −2,07 | 0,02 | −14,29 | 1,8624 | −0,2672 | |||
| NEE / NextEra Energy, Inc. | 0,25 | −2,06 | 0,02 | 0,00 | 1,7333 | −0,0596 | |||
| COST / Costco Wholesale Corporation | 0,02 | −6,02 | 0,02 | 0,00 | 1,6808 | −0,0143 | |||
| JNJ / Johnson & Johnson | 0,10 | −1,43 | 0,02 | −11,76 | 1,5951 | −0,1479 | |||
| CHD / Church & Dwight Co., Inc. | 0,16 | −3,80 | 0,02 | −16,67 | 1,5583 | −0,2824 | |||
| GJR / Strats Trust For Procter & Gambel Security - Preferred Security | 0,09 | 0,03 | 0,01 | −6,67 | 1,4800 | −0,0901 | |||
| WSO.B / Watsco, Inc. | 0,03 | −0,05 | 0,01 | −12,50 | 1,4245 | −0,2029 | |||
| MPC / Marathon Petroleum Corporation | 0,08 | 0,09 | 0,01 | 9,09 | 1,2799 | 0,1672 | |||
| KO / The Coca-Cola Company | 0,17 | −1,68 | 0,01 | 0,00 | 1,2309 | −0,0264 | |||
| MKC.V / McCormick & Company, Incorporated | 0,16 | −4,15 | 0,01 | −7,69 | 1,2113 | −0,1498 | |||
| FDS / FactSet Research Systems Inc. | 0,02 | −5,01 | 0,01 | −9,09 | 1,1011 | −0,0678 | |||
| PEP / PepsiCo, Inc. | 0,08 | −4,07 | 0,01 | −16,67 | 1,0363 | −0,1808 | |||
| DHR / Danaher Corporation | 0,05 | −16,99 | 0,01 | −16,67 | 1,0298 | −0,2475 | |||
| XOM / Exxon Mobil Corporation | 0,09 | −4,08 | 0,01 | −9,09 | 1,0193 | −0,1438 | |||
| NKE / NIKE, Inc. | 0,14 | −7,32 | 0,01 | 0,00 | 0,9859 | 0,0428 | |||
| HD / The Home Depot, Inc. | 0,03 | −6,92 | 0,01 | −10,00 | 0,9601 | −0,0628 | |||
| AMZN / Amazon.com, Inc. | 0,04 | −2,91 | 0,01 | 14,29 | 0,8609 | 0,0980 | |||
| ACN / Accenture plc | 0,03 | −0,09 | 0,01 | 0,00 | 0,8290 | −0,0304 | |||
| WMT / Walmart Inc. | 0,08 | −6,16 | 0,01 | 14,29 | 0,8240 | 0,0418 | |||
| SHW / The Sherwin-Williams Company | 0,02 | 0,00 | 0,01 | −12,50 | 0,7997 | −0,0071 | |||
| AMT / American Tower Corporation | 0,04 | −1,35 | 0,01 | 0,00 | 0,7895 | 0,0078 | |||
| CL / Colgate-Palmolive Company | 0,08 | −1,57 | 0,01 | 0,00 | 0,7111 | −0,0277 | |||
| IDXX / IDEXX Laboratories, Inc. | 0,01 | −0,15 | 0,01 | 40,00 | 0,7094 | 0,1575 | |||
| V / Visa Inc. | 0,02 | −0,38 | 0,01 | 0,00 | 0,7019 | 0,0119 | |||
| BRK.B / Berkshire Hathaway Inc. | 0,01 | 3,51 | 0,01 | −14,29 | 0,6979 | −0,0355 | |||
| RTX / RTX Corporation | 0,05 | 0,00 | 0,01 | 20,00 | 0,6630 | 0,0663 | |||
| VEEV / Veeva Systems Inc. | 0,02 | 8,52 | 0,01 | 25,00 | 0,5616 | 0,1486 | |||
| QCOM / QUALCOMM Incorporated | 0,03 | −0,25 | 0,01 | 0,00 | 0,5566 | 0,0227 | |||
| ORLY / O'Reilly Automotive, Inc. | 0,06 | 1 390,19 | 0,01 | 0,00 | 0,5161 | −0,0300 | |||
| AJG / Arthur J. Gallagher & Co. | 0,02 | 6,39 | 0,01 | 0,00 | 0,5129 | −0,0029 | |||
| NVO / Novo Nordisk A/S - Depositary Receipt (Common Stock) | 0,07 | −5,18 | 0,01 | 0,00 | 0,5054 | −0,0265 | |||
| SYY / Sysco Corporation | 0,06 | −0,37 | 0,00 | 0,00 | 0,4623 | 0,0062 | |||
| GWW / W.W. Grainger, Inc. | 0,00 | 0,00 | 0,00 | 0,00 | 0,4514 | 0,0262 | |||
| APD / Air Products and Chemicals, Inc. | 0,02 | −0,64 | 0,00 | 0,00 | 0,4477 | −0,0197 | |||
| EMR / Emerson Electric Co. | 0,03 | 0,51 | 0,00 | 33,33 | 0,4472 | 0,0842 | |||
| LOW / Lowe's Companies, Inc. | 0,02 | 0,00 | 0,00 | 0,00 | 0,4378 | −0,0188 | |||
| MRK / Merck & Co., Inc. | 0,05 | 0,00 | 0,00 | 0,00 | 0,4372 | −0,0546 | |||
| APH / Amphenol Corporation | 0,04 | 6,42 | 0,00 | 100,00 | 0,4098 | 0,1560 | |||
| DE / Deere & Company | 0,01 | 22,87 | 0,00 | 33,33 | 0,4063 | 0,1035 | |||
| PAYX / Paychex, Inc. | 0,03 | −9,94 | 0,00 | −25,00 | 0,3995 | −0,0672 | |||
| IUI1 / Intuitive Surgical, Inc. | 0,01 | 0,00 | 0,00 | 0,00 | 0,3976 | 0,0381 | |||
| ITW / Illinois Tool Works Inc. | 0,01 | −0,71 | 0,00 | 0,00 | 0,3662 | −0,0008 | |||
| CASY / Casey's General Stores, Inc. | 0,01 | 1,75 | 0,00 | 50,00 | 0,3579 | 0,0611 | |||
| EQIX / Equinix, Inc. | 0,00 | 1,02 | 0,00 | 0,00 | 0,3501 | −0,0023 | |||
| LMT / Lockheed Martin Corporation | 0,01 | −0,57 | 0,00 | 0,00 | 0,3413 | 0,0128 | |||
| ADI / Analog Devices, Inc. | 0,01 | 0,00 | 0,00 | 50,00 | 0,3315 | 0,0529 | |||
| FAST / Fastenal Company | 0,08 | 100,00 | 0,00 | 0,00 | 0,3312 | 0,0279 | |||
| HON / Honeywell International Inc. | 0,01 | −4,14 | 0,00 | 0,00 | 0,3284 | 0,0194 | |||
| CSCO / Cisco Systems, Inc. | 0,05 | −10,07 | 0,00 | 0,00 | 0,3238 | 0,0061 | |||
| AMGN / Amgen Inc. | 0,01 | −0,19 | 0,00 | 0,00 | 0,3050 | −0,0333 | |||
| BCPC / Balchem Corporation | 0,02 | 0,00 | 0,00 | 0,00 | 0,2743 | −0,0094 | |||
| BFB / Brown-Forman Corp. - Class B | 0,10 | −23,28 | 0,00 | −50,00 | 0,2738 | −0,1727 | |||
| IBM / International Business Machines Corporation | 0,01 | 0,00 | 0,00 | 0,00 | 0,2448 | 0,0400 | |||
| UNP / Union Pacific Corporation | 0,01 | −1,40 | 0,00 | 0,00 | 0,2440 | −0,0081 | |||
| BDX / Becton, Dickinson and Company | 0,01 | −3,36 | 0,00 | −33,33 | 0,2364 | −0,0863 | |||
| NVDA / NVIDIA Corporation | 0,01 | −4,53 | 0,00 | 100,00 | 0,2275 | 0,0654 | |||
| PM / Philip Morris International Inc. | 0,01 | 0,00 | 0,00 | 100,00 | 0,2044 | 0,0277 | |||
| PFF / iShares Trust - iShares Preferred and Income Securities ETF | 0,06 | 0,00 | 0,00 | 0,00 | 0,1951 | 0,0012 | |||
| DKS / DICK'S Sporting Goods, Inc. | 0,01 | 1,99 | 0,00 | 0,00 | 0,1732 | 0,0016 | |||
| HEI / HEICO Corporation | 0,01 | −0,29 | 0,00 | 0,00 | 0,1725 | 0,0327 | |||
| VZ / Verizon Communications Inc. | 0,04 | −2,63 | 0,00 | 0,00 | 0,1679 | −0,0114 | |||
| GILD / Gilead Sciences, Inc. | 0,01 | 0,00 | 0,00 | 0,00 | 0,1499 | −0,0004 | |||
| PPG / PPG Industries, Inc. | 0,01 | 0,00 | 0,00 | 0,00 | 0,1425 | 0,0066 | |||
| PFE / Pfizer Inc. | 0,06 | −3,09 | 0,00 | 0,00 | 0,1391 | −0,0097 | |||
| JKHY / Jack Henry & Associates, Inc. | 0,01 | 0,00 | 0,00 | 0,00 | 0,1345 | −0,0007 | |||
| MMMCL / 3M Company | 0,01 | 0,00 | 0,00 | 0,00 | 0,1307 | 0,0056 | |||
| CARR / Carrier Global Corporation | 0,02 | −0,58 | 0,00 | 0,00 | 0,1259 | 0,0171 | |||
| VLTO / Veralto Corporation | 0,01 | −0,88 | 0,00 | 0,00 | 0,1195 | 0,0040 | |||
| SBUX / Starbucks Corporation | 0,01 | −5,52 | 0,00 | 0,00 | 0,1182 | −0,0147 | |||
| COP / ConocoPhillips | 0,01 | 0,77 | 0,00 | 0,00 | 0,1177 | −0,0179 | |||
| JPM / JPMorgan Chase & Co. | 0,00 | 0,00 | 0,00 | 0,1167 | 0,0188 | ||||
| K / Kellanova | 0,01 | 0,00 | 0,00 | 0,00 | 0,1127 | −0,0033 | |||
| CVX / Chevron Corporation | 0,01 | 0,00 | 0,00 | 0,00 | 0,1119 | −0,0178 | |||
| TMO / Thermo Fisher Scientific Inc. | 0,00 | −9,40 | 0,00 | 0,00 | 0,1093 | −0,0375 | |||
| EXPD / Expeditors International of Washington, Inc. | 0,01 | 2,11 | 0,00 | 0,00 | 0,1038 | −0,0024 | |||
| NSC / Norfolk Southern Corporation | 0,00 | 0,00 | 0,00 | 0,1036 | 0,0085 | ||||
| NOC / Northrop Grumman Corporation | 0,00 | 0,00 | 0,00 | −100,00 | 0,0992 | −0,0015 | |||
| DIS / The Walt Disney Company | 0,01 | −0,89 | 0,00 | 0,0975 | 0,0198 | ||||
| BAC / Bank of America Corporation | 0,02 | 0,00 | 0,00 | 0,0971 | 0,0121 | ||||
| ORCL / Oracle Corporation | 0,00 | 0,00 | 0,00 | 0,0970 | 0,0354 | ||||
| ULTA / Ulta Beauty, Inc. | 0,00 | 0,00 | 0,00 | 0,0967 | 0,0215 | ||||
| ZTS / Zoetis Inc. | 0,01 | −3,43 | 0,00 | 0,0905 | −0,0077 | ||||
| HSY / The Hershey Company | 0,01 | 0,00 | 0,00 | 0,0867 | −0,0020 | ||||
| BMY / Bristol-Myers Squibb Company | 0,02 | −5,16 | 0,00 | −100,00 | 0,0867 | −0,0328 | |||
| EW / Edwards Lifesciences Corporation | 0,01 | −40,65 | 0,00 | −100,00 | 0,0836 | −0,0458 | |||
| CI / The Cigna Group | 0,00 | 24,44 | 0,00 | 0,0770 | 0,0159 | ||||
| SNPS / Synopsys, Inc. | 0,00 | 32,68 | 0,00 | 0,0764 | 0,0286 | ||||
| PANW / Palo Alto Networks, Inc. | 0,00 | −2,31 | 0,00 | 0,0740 | 0,0114 | ||||
| BRK.A / Berkshire Hathaway Inc. | 0,00 | 0,00 | 0,00 | 0,0733 | −0,0063 | ||||
| HPQ / HP Inc. | 0,03 | 0,00 | 0,00 | 0,0682 | −0,0083 | ||||
| TRMB / Trimble Inc. | 0,01 | −0,88 | 0,00 | 0,0665 | 0,0090 | ||||
| ROST / Ross Stores, Inc. | 0,01 | 0,00 | 0,00 | 0,0656 | 0,0004 | ||||
| GE / General Electric Company | 0,00 | 0,00 | 0,00 | 0,0644 | 0,0147 | ||||
| T / AT&T Inc. | 0,02 | 0,00 | 0,00 | 0,0636 | 0,0019 | ||||
| GOOG / Alphabet Inc. | 0,00 | 2,70 | 0,00 | 0,0591 | 0,0088 | ||||
| ALCO / Alico, Inc. | 0,02 | 0,00 | 0,00 | 0,0587 | 0,0056 | ||||
| WSM / Williams-Sonoma, Inc. | 0,00 | 0,00 | 0,00 | 0,0575 | 0,0024 | ||||
| CAT / Caterpillar Inc. | 0,00 | 0,00 | 0,00 | 0,0563 | 0,0088 | ||||
| DRI / Darden Restaurants, Inc. | 0,00 | 0,00 | 0,00 | 0,0548 | 0,0030 | ||||
| OTIS / Otis Worldwide Corporation | 0,01 | −0,91 | 0,00 | 0,0542 | −0,0024 | ||||
| FBIN / Fortune Brands Innovations, Inc. | 0,01 | 0,00 | 0,00 | 0,0536 | −0,0093 | ||||
| FLO / Flowers Foods, Inc. | 0,03 | 0,00 | 0,00 | 0,0535 | −0,0097 | ||||
| TSCO / Tractor Supply Company | 0,01 | −1,25 | 0,00 | 0,0526 | −0,0026 | ||||
| LIN / Linde plc | 0,00 | −1,82 | 0,00 | 0,0508 | −0,0001 | ||||
| RBC / RBC Bearings Incorporated | 0,00 | 0,00 | 0,00 | 0,0499 | 0,0085 | ||||
| RHHBY / Roche Holding AG - Depositary Receipt (Common Stock) | 0,01 | 0,00 | 0,00 | 0,0496 | −0,0001 | ||||
| MDLZ / Mondelez International, Inc. | 0,01 | 0,00 | 0,00 | 0,0478 | 0,0001 | ||||
| DUK / Duke Energy Corporation | 0,00 | 1,87 | 0,00 | 0,0460 | −0,0003 | ||||
| CTAS / Cintas Corporation | 0,00 | 3,81 | 0,00 | 0,0458 | 0,0055 | ||||
| CSX / CSX Corporation | 0,01 | −0,79 | 0,00 | 0,0438 | 0,0042 | ||||
| EOG / EOG Resources, Inc. | 0,00 | −25,79 | 0,00 | 0,0415 | −0,0180 | ||||
| INGR / Ingredion Incorporated | 0,00 | 0,00 | 0,00 | 0,0409 | 0,0004 | ||||
| ALL / The Allstate Corporation | 0,00 | 0,00 | 0,00 | 0,0405 | −0,0008 | ||||
| GPC / Genuine Parts Company | 0,00 | 1,54 | 0,00 | 0,0403 | 0,0016 | ||||
| LHX / L3Harris Technologies, Inc. | 0,00 | 0,00 | 0,00 | 0,0402 | 0,0069 | ||||
| TMUS / T-Mobile US, Inc. | 0,00 | 0,00 | 0,00 | 0,0396 | −0,0044 | ||||
| HPE / Hewlett Packard Enterprise Company | 0,02 | 0,00 | 0,00 | 0,0395 | 0,0100 | ||||
| MO / Altria Group, Inc. | 0,01 | 0,00 | 0,00 | 0,0382 | −0,0006 | ||||
| AME / AMETEK, Inc. | 0,00 | −1,98 | 0,00 | 0,0377 | 0,0014 | ||||
| AVGO / Broadcom Inc. | 0,00 | 0,00 | 0,00 | 0,0370 | 0,0147 | ||||
| GEV / GE Vernova Inc. | 0,00 | 0,00 | 0,0354 | 0,0354 | |||||
| TXN / Texas Instruments Incorporated | 0,00 | 0,00 | 0,00 | 0,0353 | 0,0050 | ||||
| RSG / Republic Services, Inc. | 0,00 | 0,00 | 0,00 | 0,0336 | 0,0009 | ||||
| ETN / Eaton Corporation plc | 0,00 | 0,00 | 0,00 | 0,0336 | 0,0081 | ||||
| WM / Waste Management, Inc. | 0,00 | 0,00 | 0,00 | 0,0317 | −0,0001 | ||||
| KMI / Kinder Morgan, Inc. | 0,01 | 0,00 | 0,00 | 0,0296 | 0,0011 | ||||
| TT / Trane Technologies plc | 0,00 | −5,68 | 0,00 | 0,0255 | 0,0049 | ||||
| META / Meta Platforms, Inc. | 0,00 | 0,00 | 0,0239 | 0,0239 | |||||
| UNH / UnitedHealth Group Incorporated | 0,00 | −4,07 | 0,00 | 0,0237 | −0,0174 | ||||
| GIS / General Mills, Inc. | 0,00 | 0,00 | 0,00 | 0,0210 | −0,0030 | ||||
| GD / General Dynamics Corporation | 0,00 | −5,02 | 0,00 | 0,0205 | 0,0005 | ||||
| KMB / Kimberly-Clark Corporation | 0,00 | 0,00 | 0,00 | 0,0204 | −0,0019 | ||||
| TECH / Bio-Techne Corporation | 0,00 | −100,00 | 0,00 | 0,0000 | |||||
| EFX / Equifax Inc. | 0,00 | −100,00 | 0,00 | 0,0000 | |||||
| DD / DuPont de Nemours, Inc. | 0,00 | −100,00 | 0,00 | 0,0000 | |||||
| FTV / Fortive Corporation | 0,00 | −100,00 | 0,00 | 0,0000 | |||||
| HSIC / Henry Schein, Inc. | 0,00 | −100,00 | 0,00 | 0,0000 | |||||
| BSTK / Brite-Strike Tactical Illumination Products, Inc. | 0,05 | 0,00 | 0,00 | 0,0000 | −0,0001 | ||||
| CMI / Cummins Inc. | 0,00 | −100,00 | 0,00 | 0,0000 |