Grundläggande statistik
| Portföljvärde | $ 246 070 306 |
| Aktuella positioner | 99 |
Senaste innehav, resultat, förvaltat kapital (från 13F, 13D)
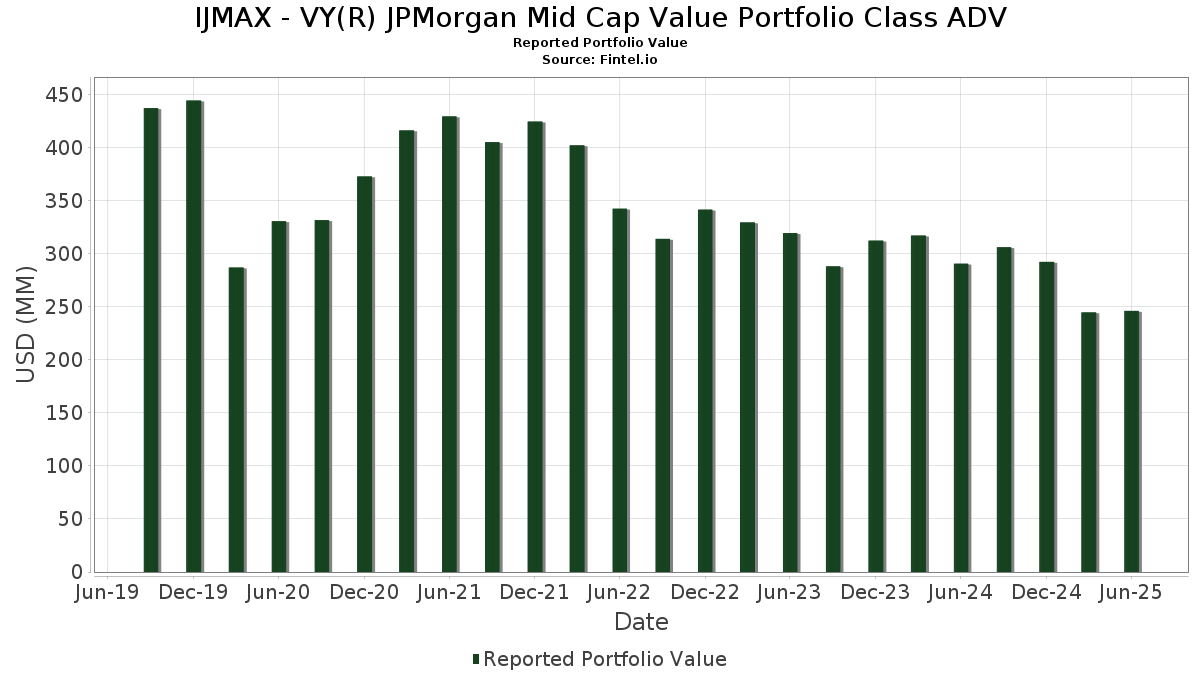
IJMAX - VY(R) JPMorgan Mid Cap Value Portfolio Class ADV har redovisat 99 totala innehav i sina senaste SEC-arkiveringar. Det senaste portföljvärdet beräknas vara $ 246 070 306 USD. Faktiskt förvaltade tillgångar (AUM) är detta värde plus likvida medel (som inte redovisas). IJMAX - VY(R) JPMorgan Mid Cap Value Portfolio Class ADVs största innehav är Blackrock Liquidity Funds - BlackRock Liquidity Funds FedFund Portfolio Institutional Class (US:TFDXX) , Fidelity National Information Services, Inc. (US:FIS) , WEC Energy Group, Inc. (US:WEC) , Loews Corporation (US:L) , and State Street Corporation (US:STT) . IJMAX - VY(R) JPMorgan Mid Cap Value Portfolio Class ADVs nya positioner inkluderar Marathon Petroleum Corporation (US:MPC) , Simon Property Group, Inc. (US:SPG) , Omnicom Group Inc. (US:OMC) , Healthpeak Properties, Inc. (US:DOC) , and Zoom Communications Inc. (US:ZM) .
Största ökningarna detta kvartal
Vi använder förändringen i portföljallokeringen eftersom det är det mest meningsfulla måttet. Förändringar kan bero på transaktioner eller förändringar i aktiekurser.
| Värdepapper | Aktier (MM) |
Värde (MM$) |
Portfölj % av | ΔPortfölj % av |
|---|---|---|---|---|
| 0,01 | 2,41 | 0,9902 | 0,9902 | |
| 0,01 | 2,32 | 0,9532 | 0,9532 | |
| 0,02 | 1,47 | 0,6048 | 0,6048 | |
| 0,05 | 2,36 | 0,9696 | 0,4879 | |
| 0,03 | 3,54 | 1,4536 | 0,4848 | |
| 0,06 | 1,10 | 0,4502 | 0,4502 | |
| 1,00 | 0,4110 | 0,4110 | ||
| 0,01 | 2,71 | 1,1139 | 0,3322 | |
| 0,04 | 4,13 | 1,6966 | 0,3016 | |
| 0,01 | 3,27 | 1,3447 | 0,2997 |
Största minskningarna detta kvartal
Vi använder förändringen i portföljallokeringen eftersom det är det mest meningsfulla måttet. Förändringar kan bero på transaktioner eller förändringar i aktiepriser.
| Värdepapper | Aktier (MM) |
Värde (MM$) |
Portfölj % av | ΔPortfölj % av |
|---|---|---|---|---|
| 0,11 | 1,57 | 0,6434 | −0,8547 | |
| 0,04 | 2,43 | 0,9977 | −0,6642 | |
| 0,00 | 0,60 | 0,2452 | −0,5419 | |
| 0,01 | 0,84 | 0,3446 | −0,4360 | |
| 0,05 | 2,34 | 0,9625 | −0,4302 | |
| 0,05 | 2,12 | 0,8715 | −0,3406 | |
| 0,07 | 1,75 | 0,7202 | −0,3272 | |
| 0,01 | 4,08 | 1,6784 | −0,3043 | |
| 0,03 | 1,97 | 0,8092 | −0,2852 | |
| 0,01 | 3,24 | 1,3327 | −0,2397 |
13F- och fond arkiveringar
Denna blankett lämnades in den 2025-08-26 för rapporteringsperioden 2025-06-30. Klicka på länksymbolen för att se hela transaktionshistoriken.
Uppgradera för att låsa upp premiumdata och exportera till Excel![]() .
.
| Värdepapper | Typ | Genomsnittligt aktiepris | Aktier (MM) |
ΔAktier (%) |
ΔAktier (%) |
Värde ($MM) |
Portfölj (%) |
ΔPortfölj (%) |
|
|---|---|---|---|---|---|---|---|---|---|
| TFDXX / Blackrock Liquidity Funds - BlackRock Liquidity Funds FedFund Portfolio Institutional Class | 5,39 | 1,15 | 5,39 | 1,14 | 2,2166 | 0,0477 | |||
| FIS / Fidelity National Information Services, Inc. | 0,06 | 1,03 | 4,87 | 10,14 | 1,9995 | 0,2027 | |||
| WEC / WEC Energy Group, Inc. | 0,04 | 1,50 | 4,69 | −2,96 | 1,9269 | −0,0383 | |||
| L / Loews Corporation | 0,05 | −6,69 | 4,68 | −6,95 | 1,9252 | −0,1225 | |||
| STT / State Street Corporation | 0,04 | 1,34 | 4,13 | 20,38 | 1,6966 | 0,3016 | |||
| AMP / Ameriprise Financial, Inc. | 0,01 | −24,00 | 4,08 | −16,21 | 1,6784 | −0,3043 | |||
| HIG / The Hartford Insurance Group, Inc. | 0,03 | 1,63 | 4,02 | 4,22 | 1,6533 | 0,0831 | |||
| ACGL / Arch Capital Group Ltd. | 0,04 | 1,63 | 3,93 | −3,79 | 1,6159 | −0,0464 | |||
| RJF / Raymond James Financial, Inc. | 0,03 | −16,25 | 3,92 | −7,55 | 1,6116 | −0,1134 | |||
| DGX / Quest Diagnostics Incorporated | 0,02 | −3,93 | 3,89 | 1,99 | 1,5970 | 0,0473 | |||
| MTG / MGIC Investment Corporation | 0,13 | 1,63 | 3,74 | 14,19 | 1,5385 | 0,2049 | |||
| CMS / CMS Energy Corporation | 0,05 | 1,50 | 3,60 | −6,37 | 1,4807 | −0,0847 | |||
| AME / AMETEK, Inc. | 0,02 | −9,92 | 3,59 | −5,31 | 1,4734 | −0,0666 | |||
| DOV / Dover Corporation | 0,02 | 11,62 | 3,54 | 16,45 | 1,4548 | 0,2180 | |||
| SNX / TD SYNNEX Corporation | 0,03 | 13,77 | 3,54 | 48,55 | 1,4536 | 0,4848 | |||
| WRB / W. R. Berkley Corporation | 0,05 | 1,24 | 3,51 | 4,53 | 1,4420 | 0,0765 | |||
| XEL / Xcel Energy Inc. | 0,05 | 1,50 | 3,48 | −2,36 | 1,4312 | −0,0195 | |||
| HUBB / Hubbell Incorporated | 0,01 | 3,19 | 3,27 | 27,36 | 1,3447 | 0,2997 | |||
| COR / Cencora, Inc. | 0,01 | −22,20 | 3,24 | −16,12 | 1,3327 | −0,2397 | |||
| ITT / ITT Inc. | 0,02 | 3,20 | 3,24 | 25,32 | 1,3304 | 0,2796 | |||
| TDY / Teledyne Technologies Incorporated | 0,01 | −13,33 | 3,19 | −10,79 | 1,3123 | −0,1437 | |||
| FCNCA / First Citizens BancShares, Inc. | 0,00 | 1,69 | 3,18 | 7,30 | 1,3049 | 0,1013 | |||
| HSIC / Henry Schein, Inc. | 0,04 | −7,26 | 3,13 | −1,11 | 1,2863 | −0,0007 | |||
| FANG / Diamondback Energy, Inc. | 0,02 | 39,37 | 3,08 | 19,79 | 1,2662 | 0,2199 | |||
| IR / Ingersoll Rand Inc. | 0,04 | 3,23 | 3,07 | 7,33 | 1,2633 | 0,0980 | |||
| AYI / Acuity Inc. | 0,01 | 14,31 | 2,98 | 29,49 | 1,2235 | 0,2884 | |||
| ZBRA / Zebra Technologies Corporation | 0,01 | 16,43 | 2,96 | 27,06 | 1,2156 | 0,2688 | |||
| NI / NiSource Inc. | 0,07 | 1,50 | 2,95 | 2,11 | 1,2130 | 0,0375 | |||
| LECO / Lincoln Electric Holdings, Inc. | 0,01 | 3,24 | 2,92 | 13,18 | 1,2000 | 0,1504 | |||
| MTB / M&T Bank Corporation | 0,01 | −5,90 | 2,89 | 2,15 | 1,1885 | 0,0366 | |||
| MLM / Martin Marietta Materials, Inc. | 0,01 | −6,05 | 2,87 | 7,85 | 1,1810 | 0,0974 | |||
| FITB / Fifth Third Bancorp | 0,07 | 0,00 | 2,82 | 4,92 | 1,1572 | 0,0656 | |||
| GPC / Genuine Parts Company | 0,02 | 13,46 | 2,78 | 15,54 | 1,1429 | 0,1638 | |||
| REG / Regency Centers Corporation | 0,04 | −11,85 | 2,77 | −14,87 | 1,1390 | −0,1853 | |||
| CTRA / Coterra Energy Inc. | 0,11 | −0,91 | 2,73 | −13,00 | 1,1227 | −0,1543 | |||
| CSL / Carlisle Companies Incorporated | 0,01 | 3,34 | 2,73 | 13,30 | 1,1207 | 0,1419 | |||
| RL / Ralph Lauren Corporation | 0,01 | 13,51 | 2,71 | 41,07 | 1,1139 | 0,3322 | |||
| VLTO / Veralto Corporation | 0,03 | 12,78 | 2,66 | 16,80 | 1,0947 | 0,1674 | |||
| AVB / AvalonBay Communities, Inc. | 0,01 | 1,50 | 2,63 | −3,76 | 1,0826 | −0,0308 | |||
| KR / The Kroger Co. | 0,04 | −18,48 | 2,63 | −13,59 | 1,0792 | −0,1572 | |||
| AZO / AutoZone, Inc. | 0,00 | 1,88 | 2,61 | −0,80 | 1,0740 | 0,0024 | |||
| IQV / IQVIA Holdings Inc. | 0,02 | 51,88 | 2,60 | 35,75 | 1,0693 | 0,2898 | |||
| KDP / Keurig Dr Pepper Inc. | 0,08 | 3,33 | 2,56 | −0,16 | 1,0533 | 0,0090 | |||
| WY / Weyerhaeuser Company | 0,10 | 23,56 | 2,54 | 8,40 | 1,0449 | 0,0910 | |||
| GEHC / GE HealthCare Technologies Inc. | 0,03 | 32,94 | 2,54 | 22,01 | 1,0435 | 0,1970 | |||
| AMH / American Homes 4 Rent | 0,07 | 1,50 | 2,52 | −3,19 | 1,0366 | −0,0230 | |||
| JBL / Jabil Inc. | 0,01 | −29,47 | 2,51 | 13,09 | 1,0300 | 0,1283 | |||
| WMB / The Williams Companies, Inc. | 0,04 | −43,47 | 2,43 | −40,59 | 0,9977 | −0,6642 | |||
| MPC / Marathon Petroleum Corporation | 0,01 | 2,41 | 0,9902 | 0,9902 | |||||
| JBHT / J.B. Hunt Transport Services, Inc. | 0,02 | 1,96 | 2,39 | −1,03 | 0,9838 | −0,0001 | |||
| HST / Host Hotels & Resorts, Inc. | 0,16 | 15,50 | 2,39 | 24,87 | 0,9803 | 0,2032 | |||
| RPM / RPM International Inc. | 0,02 | 3,92 | 2,38 | −1,33 | 0,9779 | −0,0029 | |||
| ON / ON Semiconductor Corporation | 0,05 | 54,68 | 2,36 | 99,24 | 0,9696 | 0,4879 | |||
| GIS / General Mills, Inc. | 0,05 | −21,07 | 2,34 | −31,60 | 0,9625 | −0,4302 | |||
| GMED / Globus Medical, Inc. | 0,04 | 32,32 | 2,33 | 6,70 | 0,9558 | 0,0691 | |||
| SPG / Simon Property Group, Inc. | 0,01 | 2,32 | 0,9532 | 0,9532 | |||||
| BKR / Baker Hughes Company | 0,06 | −0,14 | 2,29 | −12,88 | 0,9429 | −0,1283 | |||
| DRI / Darden Restaurants, Inc. | 0,01 | 3,39 | 2,29 | 8,52 | 0,9423 | 0,0825 | |||
| PSA / Public Storage | 0,01 | 22,78 | 2,28 | 20,37 | 0,9378 | 0,1667 | |||
| BALL / Ball Corporation | 0,04 | 12,57 | 2,28 | 21,27 | 0,9352 | 0,1719 | |||
| PSN / Parsons Corporation | 0,03 | 1,80 | 2,27 | 23,39 | 0,9346 | 0,1849 | |||
| SBAC / SBA Communications Corporation | 0,01 | −4,55 | 2,23 | 1,87 | 0,9180 | 0,0263 | |||
| MHK / Mohawk Industries, Inc. | 0,02 | 1,97 | 2,21 | −6,39 | 0,9098 | −0,0520 | |||
| SLGN / Silgan Holdings Inc. | 0,04 | 3,92 | 2,21 | 10,16 | 0,9091 | 0,0922 | |||
| POST / Post Holdings, Inc. | 0,02 | 3,92 | 2,20 | −2,61 | 0,9051 | −0,0149 | |||
| CDW / CDW Corporation | 0,01 | 46,96 | 2,20 | 17,27 | 0,9043 | 0,2486 | |||
| LNG / Cheniere Energy, Inc. | 0,01 | 10,74 | 2,15 | 16,50 | 0,8852 | 0,1334 | |||
| ROST / Ross Stores, Inc. | 0,02 | 45,83 | 2,14 | 45,55 | 0,8802 | 0,2818 | |||
| IP / International Paper Company | 0,05 | −18,93 | 2,12 | −28,86 | 0,8715 | −0,3406 | |||
| GDDY / GoDaddy Inc. | 0,01 | −10,35 | 2,09 | −10,36 | 0,8573 | −0,0895 | |||
| MIDD / The Middleby Corporation | 0,01 | 47,34 | 2,07 | 39,58 | 0,8510 | 0,2476 | |||
| WWD / Woodward, Inc. | 0,01 | 1,65 | 2,01 | 36,47 | 0,8275 | 0,2276 | |||
| IAC / IAC Inc. | 0,05 | 30,03 | 1,99 | 5,70 | 0,8158 | 0,0519 | |||
| ULS / UL Solutions Inc. | 0,03 | −43,35 | 1,97 | −26,84 | 0,8092 | −0,2852 | |||
| JAZZ / Jazz Pharmaceuticals plc | 0,02 | 3,93 | 1,90 | −11,18 | 0,7804 | −0,0891 | |||
| EXPE / Expedia Group, Inc. | 0,01 | 1,80 | 1,86 | 2,14 | 0,7652 | 0,0238 | |||
| BBY / Best Buy Co., Inc. | 0,03 | 1,04 | 1,83 | −7,84 | 0,7538 | −0,0558 | |||
| BBWI / Bath & Body Works, Inc. | 0,06 | 27,82 | 1,77 | 26,29 | 0,7269 | 0,1573 | |||
| RF / Regions Financial Corporation | 0,07 | −37,12 | 1,75 | −31,96 | 0,7202 | −0,3272 | |||
| WMG / Warner Music Group Corp. | 0,06 | 0,00 | 1,73 | −13,10 | 0,7115 | −0,0989 | |||
| PCG / PG&E Corporation | 0,11 | −47,61 | 1,57 | −57,51 | 0,6434 | −0,8547 | |||
| HUM / Humana Inc. | 0,01 | −17,65 | 1,52 | −23,91 | 0,6263 | −0,1884 | |||
| HSY / The Hershey Company | 0,01 | 3,93 | 1,51 | 0,80 | 0,6192 | 0,0115 | |||
| OMC / Omnicom Group Inc. | 0,02 | 1,47 | 0,6048 | 0,6048 | |||||
| PKG / Packaging Corporation of America | 0,01 | 3,92 | 1,46 | −1,15 | 0,6016 | −0,0005 | |||
| OWL / Blue Owl Capital Inc. | 0,07 | 1,63 | 1,43 | −2,59 | 0,5887 | −0,0094 | |||
| FCX / Freeport-McMoRan Inc. | 0,03 | −18,59 | 1,42 | −6,77 | 0,5828 | −0,0360 | |||
| STZ / Constellation Brands, Inc. | 0,01 | 3,92 | 1,32 | −7,87 | 0,5439 | −0,0405 | |||
| DOC / Healthpeak Properties, Inc. | 0,06 | 1,10 | 0,4502 | 0,4502 | |||||
| GPK / Graphic Packaging Holding Company | 0,05 | 3,92 | 1,06 | −15,65 | 0,4367 | −0,0757 | |||
| COLB / Columbia Banking System, Inc. | 0,04 | 23,60 | 1,03 | 15,91 | 0,4223 | 0,0616 | |||
| USFD / US Foods Holding Corp. | 0,01 | −30,94 | 1,01 | −18,78 | 0,4144 | −0,0904 | |||
| STATE OF WISCONSIN INVESTMENT BOARD / RA (000000000) | 1,00 | 0,4110 | 0,4110 | ||||||
| NTRS / Northern Trust Corporation | 0,01 | 1,63 | 1,00 | 30,71 | 0,4095 | 0,0992 | |||
| SRE / Sempra | 0,01 | 40,28 | 0,85 | −26,94 | 0,3477 | −0,0135 | |||
| VTR / Ventas, Inc. | 0,01 | −52,43 | 0,84 | −56,33 | 0,3446 | −0,4360 | |||
| ZM / Zoom Communications Inc. | 0,01 | 0,67 | 0,2735 | 0,2735 | |||||
| MAA / Mid-America Apartment Communities, Inc. | 0,00 | −65,09 | 0,60 | −69,20 | 0,2452 | −0,5419 | |||
| TD SECURITIES (USA) LLC / RA (000000000) | 0,07 | 0,0304 | 0,0304 |