Grundläggande statistik
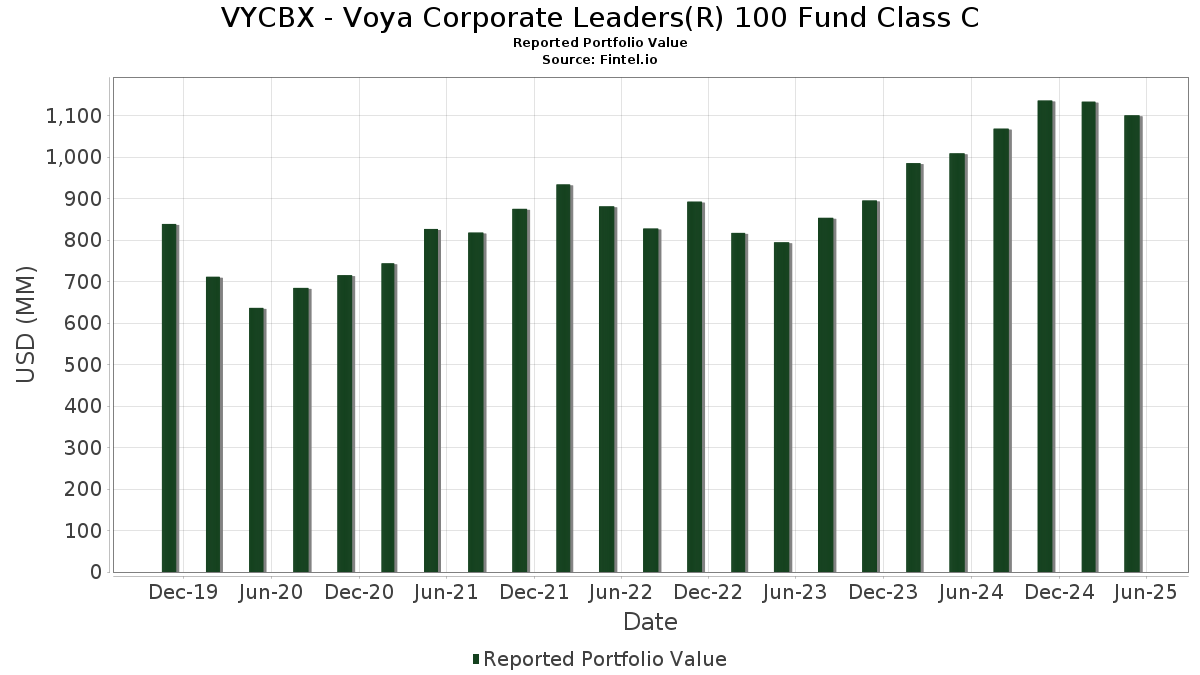
| Portföljvärde | $ 1 100 630 672 |
| Aktuella positioner | 102 |
Senaste innehav, resultat, förvaltat kapital (från 13F, 13D)
VYCBX - Voya Corporate Leaders(R) 100 Fund Class C har redovisat 102 totala innehav i sina senaste SEC-arkiveringar. Det senaste portföljvärdet beräknas vara $ 1 100 630 672 USD. Faktiskt förvaltade tillgångar (AUM) är detta värde plus likvida medel (som inte redovisas). VYCBX - Voya Corporate Leaders(R) 100 Fund Class Cs största innehav är Palantir Technologies Inc. (US:PLTR) , Broadcom Inc. (US:AVGO) , Tesla, Inc. (US:TSLA) , Netflix, Inc. (US:NFLX) , and ServiceNow, Inc. (US:NOW) . VYCBX - Voya Corporate Leaders(R) 100 Fund Class Cs nya positioner inkluderar Palantir Technologies Inc. (US:PLTR) , ServiceNow, Inc. (US:NOW) , Intuitive Surgical, Inc. (US:ISRG) , .
Största ökningarna detta kvartal
Vi använder förändringen i portföljallokeringen eftersom det är det mest meningsfulla måttet. Förändringar kan bero på transaktioner eller förändringar i aktiekurser.
| Värdepapper | Aktier (MM) |
Värde (MM$) |
Portfölj % av | ΔPortfölj % av |
|---|---|---|---|---|
| 0,12 | 16,26 | 1,4760 | 1,4760 | |
| 0,01 | 13,42 | 1,2187 | 1,2187 | |
| 0,02 | 11,90 | 1,0799 | 1,0799 | |
| 0,04 | 13,92 | 1,2641 | 0,6034 | |
| 0,06 | 15,16 | 1,3763 | 0,5796 | |
| 0,10 | 13,05 | 1,1848 | 0,3296 | |
| 0,02 | 13,32 | 1,2097 | 0,2930 | |
| 0,03 | 12,87 | 1,1687 | 0,2891 | |
| 0,10 | 11,36 | 1,0315 | 0,2639 | |
| 0,16 | 11,43 | 1,0373 | 0,2545 |
Största minskningarna detta kvartal
Vi använder förändringen i portföljallokeringen eftersom det är det mest meningsfulla måttet. Förändringar kan bero på transaktioner eller förändringar i aktiepriser.
| Värdepapper | Aktier (MM) |
Värde (MM$) |
Portfölj % av | ΔPortfölj % av |
|---|---|---|---|---|
| 0,16 | 10,10 | 0,9172 | −0,4906 | |
| 0,11 | 9,10 | 0,8260 | −0,3774 | |
| 0,47 | 9,12 | 0,8278 | −0,2991 | |
| 0,04 | 9,68 | 0,8791 | −0,2713 | |
| 0,01 | 9,50 | 0,8623 | −0,2575 | |
| 0,06 | 8,72 | 0,7914 | −0,2521 | |
| 0,05 | 9,60 | 0,8718 | −0,2448 | |
| 0,18 | 8,52 | 0,7735 | −0,2275 | |
| 0,09 | 10,43 | 0,9469 | −0,2224 | |
| 0,03 | 9,94 | 0,9028 | −0,2154 |
13F- och fond arkiveringar
Denna blankett lämnades in den 2025-07-23 för rapporteringsperioden 2025-05-31. Klicka på länksymbolen för att se hela transaktionshistoriken.
Uppgradera för att låsa upp premiumdata och exportera till Excel![]() .
.
| Värdepapper | Typ | Genomsnittligt aktiepris | Aktier (MM) |
ΔAktier (%) |
ΔAktier (%) |
Värde ($MM) |
Portfölj (%) |
ΔPortfölj (%) |
|
|---|---|---|---|---|---|---|---|---|---|
| PLTR / Palantir Technologies Inc. | 0,12 | 16,26 | 1,4760 | 1,4760 | |||||
| AVGO / Broadcom Inc. | 0,06 | 37,97 | 15,16 | 67,48 | 1,3763 | 0,5796 | |||
| TSLA / Tesla, Inc. | 0,04 | 56,87 | 13,92 | 85,49 | 1,2641 | 0,6034 | |||
| NFLX / Netflix, Inc. | 0,01 | −4,50 | 13,69 | 17,57 | 1,2431 | 0,2180 | |||
| NOW / ServiceNow, Inc. | 0,01 | 13,42 | 1,2187 | 1,2187 | |||||
| INTU / Intuit Inc. | 0,02 | 4,23 | 13,32 | 27,93 | 1,2097 | 0,2930 | |||
| NVDA / NVIDIA Corporation | 0,10 | 24,17 | 13,05 | 34,31 | 1,1848 | 0,3296 | |||
| GE / General Electric Company | 0,05 | −16,70 | 13,03 | −1,03 | 1,1830 | 0,0241 | |||
| MSFT / Microsoft Corporation | 0,03 | 11,08 | 12,87 | 28,82 | 1,1687 | 0,2891 | |||
| BA / The Boeing Company | 0,06 | 0,90 | 12,67 | 19,79 | 1,1503 | 0,2193 | |||
| BKNG / Booking Holdings Inc. | 0,00 | 6,72 | 12,62 | 17,42 | 1,1454 | 0,1997 | |||
| ORCL / Oracle Corporation | 0,08 | 17,35 | 12,45 | 16,98 | 1,1299 | 0,1935 | |||
| PM / Philip Morris International Inc. | 0,07 | −23,39 | 12,33 | −10,91 | 1,1192 | −0,0987 | |||
| WMT / Walmart Inc. | 0,12 | 5,35 | 12,28 | 5,46 | 1,1148 | 0,0900 | |||
| DIS / The Walt Disney Company | 0,11 | 11,90 | 12,21 | 11,15 | 1,1084 | 0,1417 | |||
| SCHW / The Charles Schwab Corporation | 0,14 | −5,89 | 12,03 | 4,54 | 1,0917 | 0,0792 | |||
| ISRG / Intuitive Surgical, Inc. | 0,02 | 11,90 | 1,0799 | 1,0799 | |||||
| META / Meta Platforms, Inc. | 0,02 | 1,54 | 11,89 | −1,61 | 1,0796 | 0,0158 | |||
| COST / Costco Wholesale Corporation | 0,01 | −1,75 | 11,85 | −2,54 | 1,0759 | 0,0056 | |||
| MS / Morgan Stanley | 0,09 | 7,99 | 11,76 | 3,88 | 1,0675 | 0,0711 | |||
| AXP / American Express Company | 0,04 | 10,93 | 11,73 | 8,39 | 1,0651 | 0,1124 | |||
| GOOG / Alphabet Inc. | 0,07 | 22,30 | 11,73 | 22,75 | 1,0650 | 0,2238 | |||
| GS / The Goldman Sachs Group, Inc. | 0,02 | 4,60 | 11,71 | 0,92 | 1,0631 | 0,0419 | |||
| EMR / Emerson Electric Co. | 0,10 | 13,28 | 11,64 | 11,21 | 1,0566 | 0,1355 | |||
| LMT / Lockheed Martin Corporation | 0,02 | 8,43 | 11,57 | 16,14 | 1,0506 | 0,1736 | |||
| COF / Capital One Financial Corporation | 0,06 | 1,56 | 11,55 | −4,21 | 1,0481 | −0,0128 | |||
| DE / Deere & Company | 0,02 | −9,62 | 11,52 | −4,83 | 1,0462 | −0,0195 | |||
| JPM / JPMorgan Chase & Co. | 0,04 | −2,39 | 11,51 | −2,63 | 1,0454 | 0,0045 | |||
| MA / Mastercard Incorporated | 0,02 | −3,72 | 11,47 | −2,17 | 1,0415 | 0,0094 | |||
| PYPL / PayPal Holdings, Inc. | 0,16 | 29,88 | 11,43 | 28,47 | 1,0373 | 0,2545 | |||
| HON / Honeywell International Inc. | 0,05 | 6,71 | 11,41 | 13,62 | 1,0363 | 0,1520 | |||
| ADBE / Adobe Inc. | 0,03 | 14,47 | 11,40 | 8,35 | 1,0348 | 0,1089 | |||
| CHTR / Charter Communications, Inc. | 0,03 | −7,89 | 11,37 | 0,40 | 1,0326 | 0,0354 | |||
| AMD / Advanced Micro Devices, Inc. | 0,10 | 17,49 | 11,36 | 30,28 | 1,0315 | 0,2639 | |||
| BK / The Bank of New York Mellon Corporation | 0,13 | −7,66 | 11,35 | −8,01 | 1,0302 | −0,0556 | |||
| C / Citigroup Inc. | 0,15 | −0,87 | 11,34 | −6,61 | 1,0298 | −0,0393 | |||
| BAC / Bank of America Corporation | 0,26 | 5,43 | 11,33 | 0,93 | 1,0287 | 0,0405 | |||
| V / Visa Inc. | 0,03 | −8,90 | 11,28 | −8,28 | 1,0243 | −0,0584 | |||
| AMZN / Amazon.com, Inc. | 0,05 | 13,74 | 11,27 | 9,85 | 1,0229 | 0,1201 | |||
| GM / General Motors Company | 0,23 | 13,85 | 11,26 | 14,96 | 1,0219 | 0,1602 | |||
| IBM / International Business Machines Corporation | 0,04 | −10,59 | 11,25 | −8,25 | 1,0209 | −0,0578 | |||
| WFC / Wells Fargo & Company | 0,15 | −1,35 | 11,20 | −5,81 | 1,0172 | −0,0298 | |||
| CAT / Caterpillar Inc. | 0,03 | 9,06 | 11,18 | 10,35 | 1,0151 | 0,1233 | |||
| MO / Altria Group, Inc. | 0,18 | −11,29 | 11,04 | −3,74 | 1,0023 | −0,0071 | |||
| ACN / Accenture plc | 0,03 | 14,72 | 11,03 | 4,29 | 1,0010 | 0,0705 | |||
| TXN / Texas Instruments Incorporated | 0,06 | 5,58 | 10,98 | −1,50 | 0,9972 | 0,0157 | |||
| RTX / RTX Corporation | 0,08 | −13,36 | 10,97 | −11,09 | 0,9963 | −0,0900 | |||
| CSCO / Cisco Systems, Inc. | 0,17 | −3,67 | 10,97 | −5,28 | 0,9960 | −0,0234 | |||
| GD / General Dynamics Corporation | 0,04 | −3,05 | 10,96 | 6,88 | 0,9952 | 0,0925 | |||
| BLK / BlackRock, Inc. | 0,01 | 7,48 | 10,96 | 7,72 | 0,9952 | 0,0995 | |||
| USB / U.S. Bancorp | 0,25 | 13,08 | 10,92 | 5,10 | 0,9918 | 0,0769 | |||
| HD / The Home Depot, Inc. | 0,03 | 7,69 | 10,89 | 0,00 | 0,9888 | 0,0302 | |||
| KO / The Coca-Cola Company | 0,15 | −12,69 | 10,85 | −11,60 | 0,9852 | −0,0953 | |||
| MMM / 3M Company | 0,07 | −11,70 | 10,85 | −15,55 | 0,9849 | −0,1458 | |||
| MCD / McDonald's Corporation | 0,03 | −6,59 | 10,82 | −4,93 | 0,9827 | −0,0193 | |||
| ABT / Abbott Laboratories | 0,08 | −14,60 | 10,82 | −17,34 | 0,9819 | −0,1697 | |||
| LIN / Linde plc | 0,02 | −9,90 | 10,79 | −9,79 | 0,9793 | −0,0732 | |||
| AIG / American International Group, Inc. | 0,13 | −14,07 | 10,72 | −12,31 | 0,9733 | −0,1027 | |||
| PG / The Procter & Gamble Company | 0,06 | −1,51 | 10,71 | −3,75 | 0,9722 | −0,0070 | |||
| NEE / NextEra Energy, Inc. | 0,15 | 0,89 | 10,62 | 1,56 | 0,9642 | 0,0438 | |||
| CL / Colgate-Palmolive Company | 0,11 | −3,12 | 10,61 | −1,24 | 0,9628 | 0,0177 | |||
| MDLZ / Mondelez International, Inc. | 0,16 | −12,89 | 10,56 | −8,47 | 0,9583 | −0,0567 | |||
| AMT / American Tower Corporation | 0,05 | −16,41 | 10,55 | −12,73 | 0,9575 | −0,1063 | |||
| SPG / Simon Property Group, Inc. | 0,06 | 3,02 | 10,51 | −9,73 | 0,9545 | −0,0706 | |||
| MET / MetLife, Inc. | 0,13 | 1,89 | 10,50 | −7,09 | 0,9537 | −0,0415 | |||
| LOW / Lowe's Companies, Inc. | 0,05 | 6,99 | 10,47 | −2,87 | 0,9503 | 0,0018 | |||
| SO / The Southern Company | 0,12 | −10,46 | 10,46 | −10,25 | 0,9497 | −0,0762 | |||
| T / AT&T Inc. | 0,38 | −20,53 | 10,45 | −19,40 | 0,9486 | −0,1924 | |||
| DUK / Duke Energy Corporation | 0,09 | −10,66 | 10,44 | −10,49 | 0,9480 | −0,0787 | |||
| GILD / Gilead Sciences, Inc. | 0,09 | −18,48 | 10,43 | −21,50 | 0,9469 | −0,2224 | |||
| CRM / Salesforce, Inc. | 0,04 | 23,17 | 10,41 | 9,74 | 0,9452 | 0,1102 | |||
| VZ / Verizon Communications Inc. | 0,24 | −12,70 | 10,36 | −10,96 | 0,9408 | −0,0836 | |||
| BRK.B / Berkshire Hathaway Inc. | 0,02 | −14,91 | 10,14 | −16,54 | 0,9208 | −0,1488 | |||
| NKE / NIKE, Inc. | 0,17 | 16,82 | 10,14 | −10,89 | 0,9206 | −0,0809 | |||
| UNP / Union Pacific Corporation | 0,05 | −2,82 | 10,11 | −12,68 | 0,9181 | −0,1012 | |||
| CVS / CVS Health Corporation | 0,16 | −35,18 | 10,10 | −36,84 | 0,9172 | −0,4906 | |||
| QCOM / QUALCOMM Incorporated | 0,07 | 0,25 | 10,07 | −7,39 | 0,9142 | −0,0427 | |||
| JNJ / Johnson & Johnson | 0,06 | −13,28 | 10,04 | −18,44 | 0,9117 | −0,1719 | |||
| MDT / Medtronic plc | 0,12 | −10,02 | 10,03 | −18,86 | 0,9106 | −0,1774 | |||
| CMCSA / Comcast Corporation | 0,29 | 1,13 | 10,00 | −2,56 | 0,9077 | 0,0045 | |||
| AMGN / Amgen Inc. | 0,03 | −16,33 | 9,94 | −21,73 | 0,9028 | −0,2154 | |||
| PFE / Pfizer Inc. | 0,42 | 3,80 | 9,87 | −7,75 | 0,8960 | −0,0456 | |||
| DHR / Danaher Corporation | 0,05 | 10,50 | 9,77 | 1,00 | 0,8871 | 0,0356 | |||
| AAPL / Apple Inc. | 0,05 | 14,64 | 9,76 | −4,79 | 0,8863 | −0,0162 | |||
| TMUS / T-Mobile US, Inc. | 0,04 | −17,50 | 9,68 | −25,91 | 0,8791 | −0,2713 | |||
| TGT / Target Corporation | 0,10 | 29,05 | 9,61 | −2,35 | 0,8721 | 0,0063 | |||
| ABBV / AbbVie Inc. | 0,05 | −14,99 | 9,60 | −24,31 | 0,8718 | −0,2448 | |||
| FDX / FedEx Corporation | 0,04 | 14,97 | 9,56 | −4,62 | 0,8677 | −0,0143 | |||
| US61747C7074 / Morgan Stanley Institutional Liquidity Funds Government Portfolio, Institutional Class | 9,54 | 23,87 | 9,54 | 23,87 | 0,8660 | 0,1882 | |||
| LLY / Eli Lilly and Company | 0,01 | −6,83 | 9,50 | −25,35 | 0,8623 | −0,2575 | |||
| UPS / United Parcel Service, Inc. | 0,10 | 13,19 | 9,42 | −7,25 | 0,8553 | −0,0387 | |||
| PEP / PepsiCo, Inc. | 0,07 | 0,67 | 9,33 | −13,77 | 0,8468 | −0,1053 | |||
| XOM / Exxon Mobil Corporation | 0,09 | −11,03 | 9,20 | −18,25 | 0,8356 | −0,1552 | |||
| MRK / Merck & Co., Inc. | 0,12 | 9,19 | 9,12 | −9,04 | 0,8281 | −0,0546 | |||
| INTC / Intel Corporation | 0,47 | −13,56 | 9,12 | −28,79 | 0,8278 | −0,2991 | |||
| SBUX / Starbucks Corporation | 0,11 | −8,20 | 9,10 | −33,46 | 0,8260 | −0,3774 | |||
| COP / ConocoPhillips | 0,10 | −6,06 | 8,83 | −19,14 | 0,8017 | −0,1595 | |||
| CVX / Chevron Corporation | 0,06 | −14,68 | 8,72 | −26,48 | 0,7914 | −0,2521 | |||
| TMO / Thermo Fisher Scientific Inc. | 0,02 | 2,74 | 8,53 | −21,76 | 0,7744 | −0,1852 | |||
| BMY / Bristol-Myers Squibb Company | 0,18 | −7,49 | 8,52 | −25,08 | 0,7735 | −0,2275 | |||
| S&P500 EMINI / DE (000000000) | 1,02 | 0,0926 | 0,0926 | ||||||
| BNP PARIBAS SA / RA (000000000) | 0,00 | 0,0000 | 0,0000 |