Grundläggande statistik
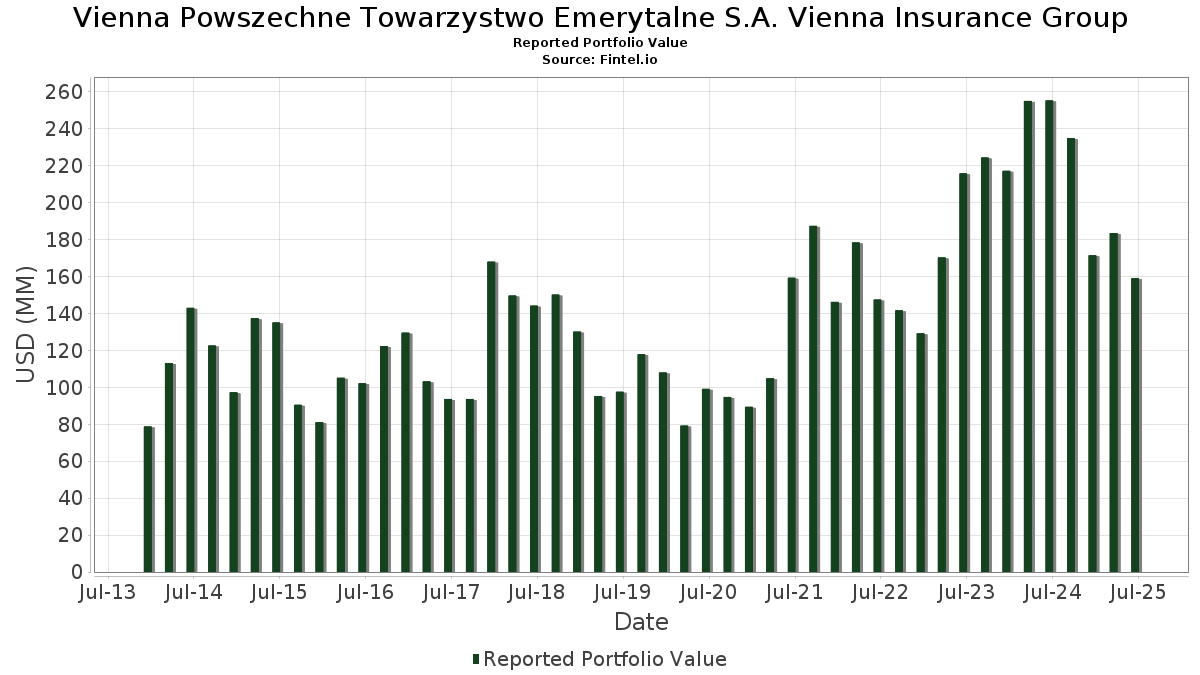
| Portföljvärde | $ 159 069 195 |
| Aktuella positioner | 88 |
Senaste innehav, resultat, förvaltat kapital (från 13F, 13D)
Vienna Powszechne Towarzystwo Emerytalne S.A. Vienna Insurance Group har redovisat 88 totala innehav i sina senaste SEC-arkiveringar. Det senaste portföljvärdet beräknas vara $ 159 069 195 USD. Faktiskt förvaltade tillgångar (AUM) är detta värde plus likvida medel (som inte redovisas). Vienna Powszechne Towarzystwo Emerytalne S.A. Vienna Insurance Groups största innehav är Alphabet Inc. (US:GOOGL) , Micron Technology, Inc. (US:MU) , Chart Industries, Inc. (US:GTLS) , Marvell Technology, Inc. (US:MRVL) , and Pan American Silver Corp. - Equity Right (US:PAASF) .
Största ökningarna detta kvartal
Vi använder förändringen i portföljallokeringen eftersom det är det mest meningsfulla måttet. Förändringar kan bero på transaktioner eller förändringar i aktiekurser.
| Värdepapper | Aktier (MM) |
Värde (MM$) |
Portfölj % av | ΔPortfölj % av |
|---|---|---|---|---|
| 0,03 | 7,24 | 4,5514 | 2,7891 | |
| 0,08 | 10,11 | 6,3535 | 2,4713 | |
| 0,29 | 8,13 | 5,1120 | 2,0861 | |
| 0,07 | 11,55 | 7,2611 | 1,7388 | |
| 0,12 | 8,90 | 5,5957 | 1,7377 | |
| 0,05 | 7,07 | 4,4425 | 1,6547 | |
| 0,05 | 8,99 | 5,6519 | 1,3569 | |
| 0,18 | 7,73 | 4,8588 | 1,1809 | |
| 0,05 | 4,17 | 2,6211 | 0,9559 | |
| 0,02 | 2,69 | 1,6885 | 0,6846 |
Största minskningarna detta kvartal
Vi använder förändringen i portföljallokeringen eftersom det är det mest meningsfulla måttet. Förändringar kan bero på transaktioner eller förändringar i aktiepriser.
| Värdepapper | Aktier (MM) |
Värde (MM$) |
Portfölj % av | ΔPortfölj % av |
|---|---|---|---|---|
| 0,01 | 0,45 | 0,2821 | −0,6392 | |
| 0,03 | 1,27 | 0,7989 | −0,2847 | |
| 0,01 | 0,74 | 0,4637 | −0,2689 | |
| 0,01 | 0,69 | 0,4341 | −0,2511 | |
| 0,04 | 0,75 | 0,4744 | −0,2182 | |
| 0,01 | 0,78 | 0,4877 | −0,2166 | |
| 0,00 | 0,70 | 0,4380 | −0,2118 | |
| 0,13 | 4,39 | 2,7623 | −0,1985 | |
| 0,02 | 0,64 | 0,4046 | −0,1959 | |
| 0,00 | 0,87 | 0,5451 | −0,1932 |
13F- och fond arkiveringar
Denna blankett lämnades in den 2025-08-01 för rapporteringsperioden 2025-06-30. Klicka på länksymbolen för att se hela transaktionshistoriken.
Uppgradera för att låsa upp premiumdata och exportera till Excel![]() .
.
| Värdepapper | Typ | Genomsnittligt aktiepris | Aktier (MM) |
ΔAktier (%) |
ΔAktier (%) |
Värde ($MM) |
Portfölj (%) |
ΔPortfölj (%) |
|
|---|---|---|---|---|---|---|---|---|---|
| GOOGL / Alphabet Inc. | 0,07 | 0,00 | 11,55 | 13,96 | 7,2611 | 1,7388 | |||
| MU / Micron Technology, Inc. | 0,08 | 0,00 | 10,11 | 41,86 | 6,3535 | 2,4713 | |||
| GTLS / Chart Industries, Inc. | 0,05 | 0,00 | 8,99 | 14,06 | 5,6519 | 1,3569 | |||
| MRVL / Marvell Technology, Inc. | 0,12 | 0,00 | 8,90 | 25,72 | 5,5957 | 1,7377 | |||
| PAASF / Pan American Silver Corp. - Equity Right | 0,29 | 33,18 | 8,13 | 46,43 | 5,1120 | 2,0861 | |||
| FCX / Freeport-McMoRan Inc. | 0,18 | 0,00 | 7,73 | 14,49 | 4,8588 | 1,1809 | |||
| AMZN / Amazon.com, Inc. | 0,03 | 94,12 | 7,24 | 123,84 | 4,5514 | 2,7891 | |||
| AMD / Advanced Micro Devices, Inc. | 0,05 | 0,00 | 7,07 | 38,12 | 4,4425 | 1,6547 | |||
| BKR / Baker Hughes Company | 0,13 | 0,00 | 4,98 | −12,76 | 3,1334 | 0,0202 | |||
| SLB / Schlumberger Limited | 0,13 | 0,00 | 4,39 | −19,14 | 2,7623 | −0,1985 | |||
| LOGI / Logitech International S.A. | 0,05 | 27,85 | 4,17 | 36,42 | 2,6211 | 0,9559 | |||
| NBIX / Neurocrine Biosciences, Inc. | 0,03 | 0,00 | 3,82 | 13,62 | 2,4021 | 0,5701 | |||
| COP / ConocoPhillips | 0,04 | 0,00 | 3,41 | −14,54 | 2,1438 | −0,0306 | |||
| NVDA / NVIDIA Corporation | 0,02 | 0,00 | 2,69 | 45,77 | 1,6885 | 0,6846 | |||
| DIN / Dine Brands Global, Inc. | 0,08 | 0,00 | 2,05 | 4,59 | 1,2894 | 0,2205 | |||
| ARRY / Array Technologies, Inc. | 0,35 | 0,00 | 2,04 | 21,13 | 1,2833 | 0,3652 | |||
| SNDX / Syndax Pharmaceuticals, Inc. | 0,20 | 0,00 | 1,87 | −23,77 | 1,1775 | −0,1613 | |||
| ENPH / Enphase Energy, Inc. | 0,03 | 0,00 | 1,27 | −36,12 | 0,7989 | −0,2847 | |||
| EMR / Emerson Electric Co. | 0,01 | −2,96 | 1,09 | 18,07 | 0,6859 | 0,1821 | |||
| CAT / Caterpillar Inc. | 0,00 | 3,48 | 1,09 | 21,77 | 0,6824 | 0,1968 | |||
| BEN / Franklin Resources, Inc. | 0,04 | −17,97 | 1,07 | 1,61 | 0,6743 | 0,0992 | |||
| CAH / Cardinal Health, Inc. | 0,01 | −28,04 | 1,03 | −12,23 | 0,6497 | 0,0080 | |||
| IBM / International Business Machines Corporation | 0,00 | −31,24 | 0,99 | −18,47 | 0,6243 | −0,0396 | |||
| NRIX / Nurix Therapeutics, Inc. | 0,09 | 0,00 | 0,97 | −4,06 | 0,6086 | 0,0584 | |||
| PNR / Pentair plc | 0,01 | −11,85 | 0,97 | 3,42 | 0,6083 | 0,0986 | |||
| NDSN / Nordson Corporation | 0,00 | −11,36 | 0,96 | −5,80 | 0,6033 | 0,0482 | |||
| NUE / Nucor Corporation | 0,01 | −18,04 | 0,96 | −11,72 | 0,6017 | 0,0106 | |||
| SWK / Stanley Black & Decker, Inc. | 0,01 | 11,93 | 0,95 | −1,35 | 0,5956 | 0,0723 | |||
| ECL / Ecolab Inc. | 0,00 | −23,60 | 0,94 | −18,82 | 0,5888 | −0,0397 | |||
| ALB / Albemarle Corporation | 0,01 | 19,78 | 0,93 | 4,26 | 0,5856 | 0,0987 | |||
| SPGI / S&P Global Inc. | 0,00 | −17,96 | 0,93 | −14,88 | 0,5831 | −0,0105 | |||
| PPG / PPG Industries, Inc. | 0,01 | −9,47 | 0,92 | −5,82 | 0,5807 | 0,0462 | |||
| TROW / T. Rowe Price Group, Inc. | 0,01 | −1,05 | 0,92 | 3,95 | 0,5789 | 0,0962 | |||
| CINF / Cincinnati Financial Corporation | 0,01 | −23,13 | 0,92 | −22,53 | 0,5775 | −0,0684 | |||
| DOV / Dover Corporation | 0,00 | −10,30 | 0,91 | −6,37 | 0,5727 | 0,0421 | |||
| ES / Eversource Energy | 0,01 | −27,04 | 0,91 | −25,29 | 0,5707 | −0,0911 | |||
| ADM / Archer-Daniels-Midland Company | 0,02 | −21,19 | 0,91 | −13,29 | 0,5702 | −0,0002 | |||
| CTAS / Cintas Corporation | 0,00 | −28,64 | 0,89 | −22,60 | 0,5579 | −0,0670 | |||
| TGT / Target Corporation | 0,01 | 12,36 | 0,89 | 6,24 | 0,5566 | 0,1024 | |||
| EXPD / Expeditors International of Washington, Inc. | 0,01 | −20,77 | 0,88 | −24,74 | 0,5547 | −0,0840 | |||
| APD / Air Products and Chemicals, Inc. | 0,00 | −6,61 | 0,88 | −10,65 | 0,5539 | 0,0164 | |||
| CHRW / C.H. Robinson Worldwide, Inc. | 0,01 | −10,37 | 0,88 | −16,03 | 0,5505 | −0,0176 | |||
| FDS / FactSet Research Systems Inc. | 0,00 | −17,56 | 0,87 | −18,94 | 0,5466 | −0,0375 | |||
| ADP / Automatic Data Processing, Inc. | 0,00 | −24,01 | 0,87 | −23,32 | 0,5462 | −0,0710 | |||
| ABBV / AbbVie Inc. | 0,00 | −27,77 | 0,87 | −35,97 | 0,5451 | −0,1932 | |||
| GWW / W.W. Grainger, Inc. | 0,00 | −15,17 | 0,87 | −10,72 | 0,5447 | 0,0162 | |||
| CVX / Chevron Corporation | 0,01 | −14,49 | 0,87 | −26,80 | 0,5447 | −0,1003 | |||
| FAST / Fastenal Company | 0,02 | 41,45 | 0,87 | −23,36 | 0,5446 | −0,0716 | |||
| ABT / Abbott Laboratories | 0,01 | −27,70 | 0,87 | −25,86 | 0,5446 | −0,0921 | |||
| LIN / Linde plc | 0,00 | −26,41 | 0,87 | −25,88 | 0,5442 | −0,0919 | |||
| ITW / Illinois Tool Works Inc. | 0,00 | −17,56 | 0,86 | −17,89 | 0,5431 | −0,0296 | |||
| GPC / Genuine Parts Company | 0,01 | −24,20 | 0,86 | −22,88 | 0,5431 | −0,0668 | |||
| MDT / Medtronic plc | 0,01 | −19,14 | 0,86 | −21,60 | 0,5412 | −0,0568 | |||
| SYY / Sysco Corporation | 0,01 | −22,98 | 0,86 | −22,26 | 0,5402 | −0,0621 | |||
| SHW / The Sherwin-Williams Company | 0,00 | −18,35 | 0,86 | −19,68 | 0,5390 | −0,0428 | |||
| NEE / NextEra Energy, Inc. | 0,01 | −18,71 | 0,85 | −20,43 | 0,5365 | −0,0476 | |||
| WMT / Walmart Inc. | 0,01 | −25,07 | 0,85 | −16,57 | 0,5353 | −0,0206 | |||
| ROP / Roper Technologies, Inc. | 0,00 | −27,59 | 0,85 | −30,44 | 0,5349 | −0,1311 | |||
| AOS / A. O. Smith Corporation | 0,01 | −16,95 | 0,85 | −16,76 | 0,5343 | −0,0215 | |||
| ESS / Essex Property Trust, Inc. | 0,00 | −24,68 | 0,85 | −30,40 | 0,5318 | −0,1302 | |||
| LOW / Lowe's Companies, Inc. | 0,00 | −9,59 | 0,84 | −13,99 | 0,5297 | −0,0041 | |||
| CB / Chubb Limited | 0,00 | −29,61 | 0,84 | −32,48 | 0,5295 | −0,1501 | |||
| WST / West Pharmaceutical Services, Inc. | 0,00 | 18,73 | 0,83 | 16,11 | 0,5213 | 0,1319 | |||
| O / Realty Income Corporation | 0,01 | −29,71 | 0,82 | −30,21 | 0,5160 | −0,1247 | |||
| MKC / McCormick & Company, Incorporated | 0,01 | −26,59 | 0,82 | −32,40 | 0,5146 | −0,1450 | |||
| JNJ / Johnson & Johnson | 0,01 | −29,06 | 0,81 | −34,73 | 0,5111 | −0,1668 | |||
| HRL / Hormel Foods Corporation | 0,03 | −24,74 | 0,81 | −26,47 | 0,5105 | −0,0908 | |||
| AFL / Aflac Incorporated | 0,01 | −27,35 | 0,80 | −31,11 | 0,5057 | −0,1304 | |||
| CL / Colgate-Palmolive Company | 0,01 | −29,72 | 0,80 | −31,86 | 0,5033 | −0,1365 | |||
| KMB / Kimberly-Clark Corporation | 0,01 | −27,73 | 0,80 | −34,45 | 0,5024 | −0,1622 | |||
| ATO / Atmos Energy Corporation | 0,01 | −34,36 | 0,80 | −34,59 | 0,5020 | −0,1629 | |||
| AMCR / Amcor plc | 0,09 | −23,02 | 0,80 | −27,06 | 0,5019 | −0,0945 | |||
| KO / The Coca-Cola Company | 0,01 | −36,57 | 0,80 | −37,31 | 0,5018 | −0,1923 | |||
| PG / The Procter & Gamble Company | 0,00 | −25,64 | 0,80 | −30,45 | 0,4998 | −0,1234 | |||
| CHD / Church & Dwight Co., Inc. | 0,01 | −21,88 | 0,78 | −31,81 | 0,4893 | −0,1325 | |||
| BRO / Brown & Brown, Inc. | 0,01 | −32,66 | 0,78 | −40,02 | 0,4877 | −0,2166 | |||
| PEP / PepsiCo, Inc. | 0,01 | −21,30 | 0,77 | −30,71 | 0,4825 | −0,1209 | |||
| MCD / McDonald's Corporation | 0,00 | −32,69 | 0,76 | −37,10 | 0,4770 | −0,1796 | |||
| KVUE / Kenvue Inc. | 0,04 | −31,98 | 0,75 | −40,68 | 0,4744 | −0,2182 | |||
| ED / Consolidated Edison, Inc. | 0,01 | −39,54 | 0,74 | −45,16 | 0,4637 | −0,2689 | |||
| CLX / The Clorox Company | 0,01 | −14,03 | 0,71 | −29,96 | 0,4487 | −0,1061 | |||
| BDX / Becton, Dickinson and Company | 0,00 | −9,64 | 0,70 | −32,05 | 0,4427 | −0,1220 | |||
| ERIE / Erie Indemnity Company | 0,00 | −29,41 | 0,70 | −41,61 | 0,4380 | −0,2118 | |||
| SJM / The J. M. Smucker Company | 0,01 | −33,79 | 0,69 | −45,11 | 0,4341 | −0,2511 | |||
| BFB / Brown-Forman Corp. - Class B | 0,02 | −26,35 | 0,64 | −41,65 | 0,4046 | −0,1959 | |||
| TDW / Tidewater Inc. | 0,01 | −75,68 | 0,45 | −73,49 | 0,2821 | −0,6392 | |||
| ARVN / Arvinas, Inc. | 0,06 | 0,00 | 0,42 | 4,96 | 0,2660 | 0,0461 | |||
| CCCC / C4 Therapeutics, Inc. | 0,09 | 0,00 | 0,12 | −11,03 | 0,0764 | 0,0023 | |||
| AA / Alcoa Corporation | 0,00 | −100,00 | 0,00 | 0,0000 | |||||
| SBLK / Star Bulk Carriers Corp. | 0,00 | −100,00 | 0,00 | 0,0000 | |||||
| GOLD / Barrick Mining Corporation | 0,00 | −100,00 | 0,00 | 0,0000 | |||||
| CDE / Coeur Mining, Inc. | 0,00 | −100,00 | 0,00 | 0,0000 | |||||
| AEM / Agnico Eagle Mines Limited | 0,00 | −100,00 | 0,00 | 0,0000 |