Grundläggande statistik
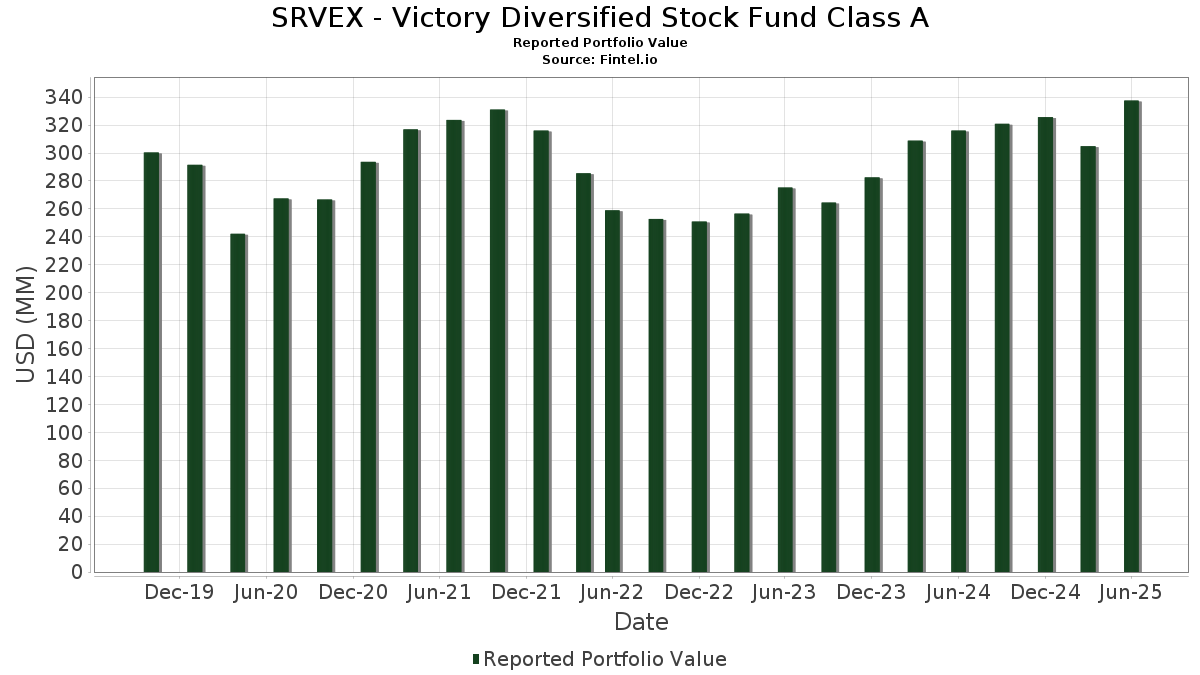
| Portföljvärde | $ 337 577 374 |
| Aktuella positioner | 74 |
Senaste innehav, resultat, förvaltat kapital (från 13F, 13D)
SRVEX - Victory Diversified Stock Fund Class A har redovisat 74 totala innehav i sina senaste SEC-arkiveringar. Det senaste portföljvärdet beräknas vara $ 337 577 374 USD. Faktiskt förvaltade tillgångar (AUM) är detta värde plus likvida medel (som inte redovisas). SRVEX - Victory Diversified Stock Fund Class As största innehav är NVIDIA Corporation (US:NVDA) , Microsoft Corporation (US:MSFT) , Apple Inc. (US:AAPL) , Alphabet Inc. (US:GOOG) , and Amazon.com, Inc. (US:AMZN) . SRVEX - Victory Diversified Stock Fund Class As nya positioner inkluderar Royal Caribbean Cruises Ltd. (US:RCL) , Universal Health Services, Inc. (US:UHS) , Ralph Lauren Corporation (US:RL) , Autodesk, Inc. (US:ADSK) , and Urban Outfitters, Inc. (US:URBN) .
Största ökningarna detta kvartal
Vi använder förändringen i portföljallokeringen eftersom det är det mest meningsfulla måttet. Förändringar kan bero på transaktioner eller förändringar i aktiekurser.
| Värdepapper | Aktier (MM) |
Värde (MM$) |
Portfölj % av | ΔPortfölj % av |
|---|---|---|---|---|
| 0,14 | 22,91 | 6,7389 | 2,4724 | |
| 0,02 | 5,53 | 1,6281 | 1,6281 | |
| 0,04 | 10,64 | 3,1306 | 1,5437 | |
| 0,02 | 4,10 | 1,2075 | 1,2075 | |
| 0,03 | 6,07 | 1,7866 | 1,1908 | |
| 0,05 | 22,63 | 6,6573 | 1,0823 | |
| 0,01 | 3,43 | 1,0103 | 1,0103 | |
| 0,01 | 3,42 | 1,0047 | 1,0047 | |
| 0,01 | 3,26 | 0,9576 | 0,9576 | |
| 0,02 | 11,27 | 3,3151 | 0,8249 |
Största minskningarna detta kvartal
Vi använder förändringen i portföljallokeringen eftersom det är det mest meningsfulla måttet. Förändringar kan bero på transaktioner eller förändringar i aktiepriser.
| Värdepapper | Aktier (MM) |
Värde (MM$) |
Portfölj % av | ΔPortfölj % av |
|---|---|---|---|---|
| 0,10 | 19,87 | 5,8456 | −1,6074 | |
| 0,01 | 6,62 | 1,9473 | −0,8412 | |
| 0,01 | 3,58 | 1,0533 | −0,7248 | |
| 0,07 | 2,13 | 0,6266 | −0,7195 | |
| 0,01 | 2,46 | 0,7225 | −0,7091 | |
| 0,11 | 2,07 | 0,6080 | −0,6156 | |
| 0,05 | 3,18 | 0,9346 | −0,5914 | |
| 0,03 | 3,48 | 1,0242 | −0,5567 | |
| 0,01 | 3,43 | 1,0087 | −0,5491 | |
| 0,07 | 3,48 | 1,0227 | −0,4543 |
13F- och fond arkiveringar
Denna blankett lämnades in den 2025-08-28 för rapporteringsperioden 2025-06-30. Klicka på länksymbolen för att se hela transaktionshistoriken.
Uppgradera för att låsa upp premiumdata och exportera till Excel![]() .
.
| Värdepapper | Typ | Genomsnittligt aktiepris | Aktier (MM) |
ΔAktier (%) |
ΔAktier (%) |
Värde ($MM) |
Portfölj (%) |
ΔPortfölj (%) |
|
|---|---|---|---|---|---|---|---|---|---|
| NVDA / NVIDIA Corporation | 0,14 | 20,46 | 22,91 | 75,59 | 6,7389 | 2,4724 | |||
| MSFT / Microsoft Corporation | 0,05 | 0,19 | 22,63 | 32,75 | 6,6573 | 1,0823 | |||
| AAPL / Apple Inc. | 0,10 | −5,60 | 19,87 | −12,80 | 5,8456 | −1,6074 | |||
| GOOG / Alphabet Inc. | 0,07 | 6,46 | 12,82 | 20,87 | 3,7704 | 0,3028 | |||
| AMZN / Amazon.com, Inc. | 0,06 | 4,51 | 12,29 | 20,51 | 3,6159 | 0,2804 | |||
| META / Meta Platforms, Inc. | 0,02 | 15,57 | 11,27 | 48,00 | 3,3151 | 0,8249 | |||
| AVGO / Broadcom Inc. | 0,04 | 33,21 | 10,64 | 119,33 | 3,1306 | 1,5437 | |||
| V / Visa Inc. | 0,02 | 14,35 | 7,50 | 15,85 | 2,2060 | 0,0890 | |||
| LLY / Eli Lilly and Company | 0,01 | −17,75 | 6,62 | −22,37 | 1,9473 | −0,8412 | |||
| JBL / Jabil Inc. | 0,03 | 107,98 | 6,07 | 233,50 | 1,7866 | 1,1908 | |||
| IBKR / Interactive Brokers Group, Inc. | 0,11 | 476,63 | 5,83 | 92,98 | 1,7141 | 0,7265 | |||
| RCL / Royal Caribbean Cruises Ltd. | 0,02 | 5,53 | 1,6281 | 1,6281 | |||||
| JPM / JPMorgan Chase & Co. | 0,02 | −5,66 | 5,44 | 11,52 | 1,6006 | 0,0047 | |||
| KLAC / KLA Corporation | 0,01 | 33,13 | 5,17 | 75,46 | 1,5207 | 0,5569 | |||
| APH / Amphenol Corporation | 0,05 | −20,84 | 4,89 | 19,18 | 1,4388 | 0,0967 | |||
| DIS / The Walt Disney Company | 0,04 | −5,57 | 4,72 | 18,64 | 1,3874 | 0,0874 | |||
| PWR / Quanta Services, Inc. | 0,01 | −21,69 | 4,69 | 16,48 | 1,3806 | 0,0630 | |||
| FSS / Federal Signal Corporation | 0,04 | −5,60 | 4,69 | 36,60 | 1,3791 | 0,2566 | |||
| WRB / W. R. Berkley Corporation | 0,06 | −5,55 | 4,65 | −2,48 | 1,3674 | −0,1915 | |||
| MCK / McKesson Corporation | 0,01 | 118,66 | 4,60 | 138,15 | 1,3537 | 0,7216 | |||
| EBAY / eBay Inc. | 0,06 | 30,50 | 4,57 | 43,47 | 1,3439 | 0,3026 | |||
| FN / Fabrinet | 0,02 | −5,54 | 4,53 | 40,92 | 1,3312 | 0,2811 | |||
| TT / Trane Technologies plc | 0,01 | −19,18 | 4,51 | 4,93 | 1,3278 | −0,0790 | |||
| BGC / BGC Group, Inc. | 0,43 | −5,57 | 4,40 | 5,36 | 1,2953 | −0,0716 | |||
| COR / Cencora, Inc. | 0,01 | −22,97 | 4,36 | −16,95 | 1,2818 | −0,4339 | |||
| HCA / HCA Healthcare, Inc. | 0,01 | −5,65 | 4,12 | 4,63 | 1,2112 | −0,0760 | |||
| INGR / Ingredion Incorporated | 0,03 | 26,81 | 4,11 | 27,21 | 1,2077 | 0,1521 | |||
| UHS / Universal Health Services, Inc. | 0,02 | 4,10 | 1,2075 | 1,2075 | |||||
| SPY / SPDR S&P 500 ETF | 0,01 | −21,76 | 4,04 | −13,59 | 1,1898 | −0,3409 | |||
| KEX / Kirby Corporation | 0,03 | −5,60 | 3,78 | 5,98 | 1,1110 | −0,0544 | |||
| CRBG / Corebridge Financial, Inc. | 0,10 | −5,57 | 3,70 | 6,21 | 1,0877 | −0,0510 | |||
| EME / EMCOR Group, Inc. | 0,01 | 60,98 | 3,68 | 89,70 | 1,0833 | 0,4943 | |||
| FIX / Comfort Systems USA, Inc. | 0,01 | −33,80 | 3,63 | −9,06 | 1,0688 | −0,1472 | |||
| VRTX / Vertex Pharmaceuticals Incorporated | 0,01 | −28,28 | 3,58 | −34,15 | 1,0533 | −0,7248 | |||
| TSM / Taiwan Semiconductor Manufacturing Company Limited - Depositary Receipt (Common Stock) | 0,02 | −5,57 | 3,51 | 28,85 | 1,0314 | 0,1415 | |||
| NVS / Novartis AG - Depositary Receipt (Common Stock) | 0,03 | −33,65 | 3,48 | −27,99 | 1,0242 | −0,5567 | |||
| HALO / Halozyme Therapeutics, Inc. | 0,07 | −5,58 | 3,48 | −23,03 | 1,0227 | −0,4543 | |||
| RL / Ralph Lauren Corporation | 0,01 | 3,43 | 1,0103 | 1,0103 | |||||
| CASY / Casey's General Stores, Inc. | 0,01 | −38,77 | 3,43 | −28,01 | 1,0087 | −0,5491 | |||
| ADSK / Autodesk, Inc. | 0,01 | 3,42 | 1,0047 | 1,0047 | |||||
| ENSG / The Ensign Group, Inc. | 0,02 | −18,31 | 3,37 | −2,60 | 0,9911 | −0,1404 | |||
| CHTR / Charter Communications, Inc. | 0,01 | 3,26 | 0,9576 | 0,9576 | |||||
| AZN / AstraZeneca PLC - Depositary Receipt (Common Stock) | 0,05 | −28,39 | 3,18 | −31,91 | 0,9346 | −0,5914 | |||
| RJF / Raymond James Financial, Inc. | 0,02 | −30,12 | 3,16 | −22,84 | 0,9303 | −0,4101 | |||
| RGLD / Royal Gold, Inc. | 0,02 | 83,39 | 3,14 | 99,49 | 0,9250 | 0,4095 | |||
| AMP / Ameriprise Financial, Inc. | 0,01 | −5,54 | 3,07 | 4,15 | 0,9019 | −0,0609 | |||
| AMG / Affiliated Managers Group, Inc. | 0,02 | −5,65 | 3,06 | 10,47 | 0,9001 | −0,0056 | |||
| TXRH / Texas Roadhouse, Inc. | 0,02 | −33,20 | 3,03 | −24,88 | 0,8912 | −0,4274 | |||
| EXPE / Expedia Group, Inc. | 0,02 | −5,55 | 2,97 | −5,21 | 0,8731 | −0,1510 | |||
| TSLA / Tesla, Inc. | 0,01 | −5,66 | 2,68 | 15,62 | 0,7883 | 0,0304 | |||
| NFLX / Netflix, Inc. | 0,00 | −5,57 | 2,57 | 35,60 | 0,7552 | 0,1361 | |||
| URBN / Urban Outfitters, Inc. | 0,04 | 2,54 | 0,7481 | 0,7481 | |||||
| CPAY / Corpay, Inc. | 0,01 | −41,03 | 2,46 | −43,89 | 0,7225 | −0,7091 | |||
| GS / The Goldman Sachs Group, Inc. | 0,00 | −41,20 | 2,21 | −23,80 | 0,6490 | −0,2981 | |||
| JD / JD.com, Inc. - Depositary Receipt (Common Stock) | 0,07 | −34,81 | 2,13 | −48,26 | 0,6266 | −0,7195 | |||
| ORCL / Oracle Corporation | 0,01 | 2,11 | 0,6206 | 0,6206 | |||||
| TME / Tencent Music Entertainment Group - Depositary Receipt (Common Stock) | 0,11 | −59,16 | 2,07 | −44,77 | 0,6080 | −0,6156 | |||
| NCLH / Norwegian Cruise Line Holdings Ltd. | 0,10 | 2,04 | 0,5996 | 0,5996 | |||||
| RMD / ResMed Inc. | 0,01 | −43,68 | 2,03 | −35,07 | 0,5975 | −0,4257 | |||
| FCFS / FirstCash Holdings, Inc. | 0,01 | 2,02 | 0,5951 | 0,5951 | |||||
| PFGC / Performance Food Group Company | 0,02 | −5,57 | 1,95 | 5,06 | 0,5743 | −0,0335 | |||
| BKR / Baker Hughes Company | 0,05 | −5,59 | 1,95 | −17,61 | 0,5725 | −0,2002 | |||
| GEN / Gen Digital Inc. | 0,07 | −5,57 | 1,94 | 4,59 | 0,5702 | −0,0358 | |||
| CBRE / CBRE Group, Inc. | 0,01 | −5,62 | 1,85 | 1,09 | 0,5448 | −0,0541 | |||
| EXLS / ExlService Holdings, Inc. | 0,04 | 1,81 | 0,5330 | 0,5330 | |||||
| AVY / Avery Dennison Corporation | 0,01 | −5,56 | 1,74 | −6,86 | 0,5116 | −0,0992 | |||
| AROC / Archrock, Inc. | 0,07 | −5,55 | 1,73 | −10,64 | 0,5091 | −0,1242 | |||
| EOG / EOG Resources, Inc. | 0,01 | −5,57 | 1,70 | −11,94 | 0,4994 | −0,1309 | |||
| LIN / Linde plc | 0,00 | −5,59 | 1,66 | −4,92 | 0,4891 | −0,0825 | |||
| FANG / Diamondback Energy, Inc. | 0,01 | −5,67 | 1,62 | −18,95 | 0,4771 | −0,1771 | |||
| OKE / ONEOK, Inc. | 0,02 | −5,57 | 1,48 | −22,31 | 0,4354 | −0,1877 | |||
| TBBK / The Bancorp, Inc. | 0,03 | −5,62 | 1,47 | 1,80 | 0,4328 | −0,0400 | |||
| ADBE / Adobe Inc. | 0,00 | −5,53 | 1,45 | −4,66 | 0,4275 | −0,0712 | |||
| VICI / VICI Properties Inc. | 0,04 | −5,55 | 1,45 | −5,60 | 0,4264 | −0,0758 | |||
| US8252528851 / Invesco Government & Agency Portfolio, Institutional Class | 0,00 | −100,00 | 0,00 | −100,00 | −0,1215 |