Grundläggande statistik
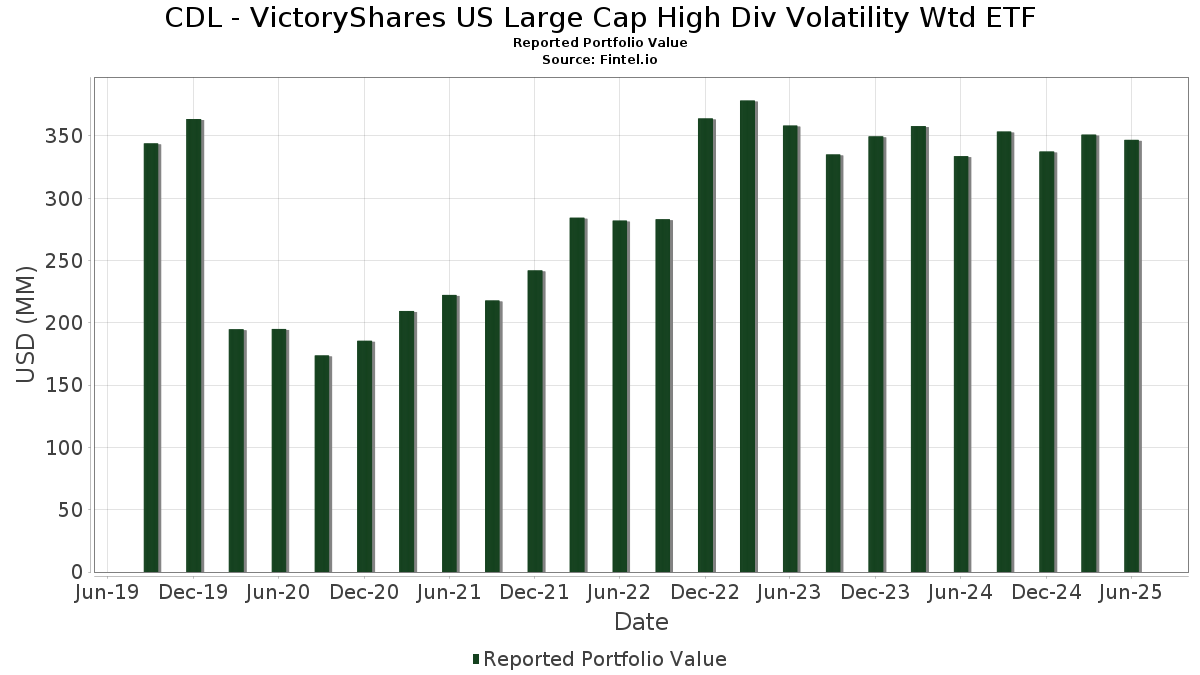
| Portföljvärde | $ 346 870 351 |
| Aktuella positioner | 101 |
Senaste innehav, resultat, förvaltat kapital (från 13F, 13D)
CDL - VictoryShares US Large Cap High Div Volatility Wtd ETF har redovisat 101 totala innehav i sina senaste SEC-arkiveringar. Det senaste portföljvärdet beräknas vara $ 346 870 351 USD. Faktiskt förvaltade tillgångar (AUM) är detta värde plus likvida medel (som inte redovisas). CDL - VictoryShares US Large Cap High Div Volatility Wtd ETFs största innehav är Evergy, Inc. (US:EVRG) , CME Group Inc. (US:CME) , The Coca-Cola Company (US:KO) , WEC Energy Group, Inc. (US:WEC) , and PPL Corporation (US:PPL) .
Största ökningarna detta kvartal
Vi använder förändringen i portföljallokeringen eftersom det är det mest meningsfulla måttet. Förändringar kan bero på transaktioner eller förändringar i aktiekurser.
| Värdepapper | Aktier (MM) |
Värde (MM$) |
Portfölj % av | ΔPortfölj % av |
|---|---|---|---|---|
| 0,03 | 3,87 | 1,1085 | 0,4725 | |
| 0,03 | 4,11 | 1,1753 | 0,2838 | |
| 0,03 | 2,36 | 0,6768 | 0,2214 | |
| 0,04 | 3,92 | 1,1217 | 0,2012 | |
| 0,02 | 2,78 | 0,7960 | 0,1984 | |
| 0,02 | 3,11 | 0,8894 | 0,1704 | |
| 0,02 | 3,93 | 1,1234 | 0,1696 | |
| 0,04 | 3,02 | 0,8650 | 0,1606 | |
| 0,08 | 3,97 | 1,1374 | 0,1289 | |
| 0,01 | 2,85 | 0,8158 | 0,1262 |
Största minskningarna detta kvartal
Vi använder förändringen i portföljallokeringen eftersom det är det mest meningsfulla måttet. Förändringar kan bero på transaktioner eller förändringar i aktiepriser.
| Värdepapper | Aktier (MM) |
Värde (MM$) |
Portfölj % av | ΔPortfölj % av |
|---|---|---|---|---|
| 0,14 | 2,90 | 0,8307 | −0,2251 | |
| 0,09 | 2,81 | 0,8047 | −0,2177 | |
| 0,09 | 2,50 | 0,7163 | −0,2061 | |
| 0,06 | 3,26 | 0,9317 | −0,1740 | |
| 0,03 | 3,08 | 0,8807 | −0,1726 | |
| 0,05 | 2,54 | 0,7263 | −0,1713 | |
| 0,03 | 3,77 | 1,0781 | −0,1495 | |
| 0,03 | 2,79 | 0,7993 | −0,1492 | |
| 0,13 | 3,47 | 0,9923 | −0,1476 | |
| 0,07 | 2,37 | 0,6780 | −0,1417 |
13F- och fond arkiveringar
Denna blankett lämnades in den 2025-08-28 för rapporteringsperioden 2025-06-30. Klicka på länksymbolen för att se hela transaktionshistoriken.
Uppgradera för att låsa upp premiumdata och exportera till Excel![]() .
.
| Värdepapper | Typ | Genomsnittligt aktiepris | Aktier (MM) |
ΔAktier (%) |
ΔAktier (%) |
Värde ($MM) |
Portfölj (%) |
ΔPortfölj (%) |
|
|---|---|---|---|---|---|---|---|---|---|
| EVRG / Evergy, Inc. | 0,09 | 1,88 | 6,20 | 1,86 | 1,7738 | 0,0477 | |||
| CME / CME Group Inc. | 0,02 | 1,87 | 5,64 | 5,83 | 1,6155 | 0,1027 | |||
| KO / The Coca-Cola Company | 0,08 | 1,87 | 5,36 | 0,64 | 1,5333 | 0,0233 | |||
| WEC / WEC Energy Group, Inc. | 0,05 | 1,85 | 5,13 | −2,62 | 1,4669 | −0,0259 | |||
| PPL / PPL Corporation | 0,15 | 1,85 | 5,06 | −4,42 | 1,4491 | −0,0534 | |||
| CMS / CMS Energy Corporation | 0,07 | 1,85 | 5,06 | −6,05 | 1,4477 | −0,0796 | |||
| DUK / Duke Energy Corporation | 0,04 | 1,83 | 5,03 | −1,47 | 1,4396 | −0,0086 | |||
| SO / The Southern Company | 0,05 | 1,81 | 4,88 | 1,69 | 1,3979 | 0,0354 | |||
| DTE / DTE Energy Company | 0,04 | 1,83 | 4,82 | −2,45 | 1,3792 | −0,0220 | |||
| JNJ / Johnson & Johnson | 0,03 | 1,83 | 4,75 | −6,22 | 1,3596 | −0,0771 | |||
| ED / Consolidated Edison, Inc. | 0,05 | 1,82 | 4,70 | −7,61 | 1,3444 | −0,0977 | |||
| AEP / American Electric Power Company, Inc. | 0,04 | 1,80 | 4,63 | −3,34 | 1,3244 | −0,0335 | |||
| EXC / Exelon Corporation | 0,11 | 1,79 | 4,58 | −4,10 | 1,3122 | −0,0436 | |||
| MO / Altria Group, Inc. | 0,08 | 1,81 | 4,58 | −0,56 | 1,3121 | 0,0045 | |||
| FE / FirstEnergy Corp. | 0,11 | 1,80 | 4,54 | 1,41 | 1,2985 | 0,0294 | |||
| LNT / Alliant Energy Corporation | 0,07 | 1,79 | 4,53 | −4,33 | 1,2960 | −0,0467 | |||
| KDP / Keurig Dr Pepper Inc. | 0,14 | 1,79 | 4,47 | −1,67 | 1,2806 | −0,0100 | |||
| MDLZ / Mondelez International, Inc. | 0,07 | 1,78 | 4,40 | 1,15 | 1,2600 | 0,0256 | |||
| HRL / Hormel Foods Corporation | 0,14 | 1,78 | 4,32 | −0,48 | 1,2356 | 0,0050 | |||
| XEL / Xcel Energy Inc. | 0,06 | 1,78 | 4,31 | −2,09 | 1,2336 | −0,0150 | |||
| KMB / Kimberly-Clark Corporation | 0,03 | 1,79 | 4,27 | −7,73 | 1,2227 | −0,0906 | |||
| T / AT&T Inc. | 0,15 | 1,74 | 4,22 | 4,12 | 1,2086 | 0,0582 | |||
| SYY / Sysco Corporation | 0,06 | 1,75 | 4,17 | 2,71 | 1,1935 | 0,0418 | |||
| VZ / Verizon Communications Inc. | 0,10 | 1,76 | 4,15 | −2,92 | 1,1887 | −0,0249 | |||
| NTRS / Northern Trust Corporation | 0,03 | 1,66 | 4,11 | 30,64 | 1,1753 | 0,2838 | |||
| PEG / Public Service Enterprise Group Incorporated | 0,05 | 1,72 | 4,06 | 4,05 | 1,1614 | 0,0551 | |||
| PEP / PepsiCo, Inc. | 0,03 | 1,74 | 4,06 | −10,41 | 1,1608 | −0,1232 | |||
| XOM / Exxon Mobil Corporation | 0,04 | 1,72 | 4,02 | −7,78 | 1,1494 | −0,0861 | |||
| MDT / Medtronic plc | 0,05 | 1,73 | 3,99 | −1,31 | 1,1414 | −0,0048 | |||
| ADM / Archer-Daniels-Midland Company | 0,08 | 1,67 | 3,97 | 11,79 | 1,1374 | 0,1289 | |||
| ES / Eversource Energy | 0,06 | 1,74 | 3,97 | 4,23 | 1,1360 | 0,0557 | |||
| PM / Philip Morris International Inc. | 0,02 | 1,73 | 3,93 | 16,75 | 1,1234 | 0,1696 | |||
| STT / State Street Corporation | 0,04 | 1,68 | 3,92 | 20,77 | 1,1217 | 0,2012 | |||
| D / Dominion Energy, Inc. | 0,07 | 1,72 | 3,89 | 2,53 | 1,1145 | 0,0372 | |||
| LMT / Lockheed Martin Corporation | 0,01 | 1,75 | 3,88 | 5,50 | 1,1101 | 0,0672 | |||
| STX / Seagate Technology Holdings plc | 0,03 | 1,66 | 3,87 | 72,75 | 1,1085 | 0,4725 | |||
| KMI / Kinder Morgan, Inc. | 0,13 | 1,68 | 3,79 | 4,78 | 1,0858 | 0,0588 | |||
| CVX / Chevron Corporation | 0,03 | 1,69 | 3,77 | −12,94 | 1,0781 | −0,1495 | |||
| WMB / The Williams Companies, Inc. | 0,06 | 1,66 | 3,65 | 6,87 | 1,0458 | 0,0758 | |||
| TSN / Tyson Foods, Inc. | 0,07 | 1,68 | 3,64 | −10,86 | 1,0428 | −0,1166 | |||
| PFE / Pfizer Inc. | 0,15 | 1,66 | 3,58 | −2,74 | 1,0243 | −0,0196 | |||
| GIS / General Mills, Inc. | 0,07 | 1,71 | 3,57 | −11,87 | 1,0219 | −0,1272 | |||
| PNC / The PNC Financial Services Group, Inc. | 0,02 | 1,64 | 3,51 | 7,77 | 1,0045 | 0,0810 | |||
| FNF / Fidelity National Financial, Inc. | 0,06 | 1,64 | 3,47 | −12,45 | 0,9944 | −0,1312 | |||
| KHC / The Kraft Heinz Company | 0,13 | 1,68 | 3,47 | −13,71 | 0,9923 | −0,1476 | |||
| EOG / EOG Resources, Inc. | 0,03 | 1,62 | 3,45 | −5,23 | 0,9865 | −0,0450 | |||
| TROW / T. Rowe Price Group, Inc. | 0,03 | 1,63 | 3,37 | 6,74 | 0,9653 | 0,0691 | |||
| FITB / Fifth Third Bancorp | 0,08 | 1,60 | 3,35 | 6,59 | 0,9577 | 0,0673 | |||
| LYB / LyondellBasell Industries N.V. | 0,06 | 1,61 | 3,26 | −16,50 | 0,9317 | −0,1740 | |||
| PFG / Principal Financial Group, Inc. | 0,04 | 1,59 | 3,26 | −4,35 | 0,9317 | −0,0337 | |||
| GILD / Gilead Sciences, Inc. | 0,03 | 1,61 | 3,23 | 0,56 | 0,9253 | 0,0132 | |||
| PRU / Prudential Financial, Inc. | 0,03 | 1,59 | 3,16 | −2,26 | 0,9042 | −0,0127 | |||
| USB / U.S. Bancorp | 0,07 | 1,58 | 3,14 | 8,87 | 0,8993 | 0,0807 | |||
| MTB / M&T Bank Corporation | 0,02 | 1,56 | 3,14 | 10,22 | 0,8986 | 0,0906 | |||
| COP / ConocoPhillips | 0,03 | 1,57 | 3,12 | −13,20 | 0,8941 | −0,1269 | |||
| AMGN / Amgen Inc. | 0,01 | 1,63 | 3,12 | −8,92 | 0,8940 | −0,0788 | |||
| RF / Regions Financial Corporation | 0,13 | 1,54 | 3,12 | 9,89 | 0,8936 | 0,0878 | |||
| MS / Morgan Stanley | 0,02 | 1,55 | 3,11 | 22,61 | 0,8894 | 0,1704 | |||
| NEE / NextEra Energy, Inc. | 0,04 | 1,61 | 3,10 | −0,51 | 0,8869 | 0,0035 | |||
| HBAN / Huntington Bancshares Incorporated | 0,18 | 1,55 | 3,08 | 13,37 | 0,8810 | 0,1110 | |||
| CTRA / Coterra Energy Inc. | 0,12 | 1,58 | 3,08 | −10,81 | 0,8809 | −0,0978 | |||
| CLX / The Clorox Company | 0,03 | 1,62 | 3,08 | −17,13 | 0,8807 | −0,1726 | |||
| CMCSA / Comcast Corporation | 0,09 | 1,55 | 3,06 | −1,77 | 0,8754 | −0,0079 | |||
| C / Citigroup Inc. | 0,04 | 1,50 | 3,02 | 21,71 | 0,8650 | 0,1606 | |||
| HSY / The Hershey Company | 0,02 | 1,55 | 3,02 | −1,47 | 0,8637 | −0,0050 | |||
| DRI / Darden Restaurants, Inc. | 0,01 | 1,55 | 2,98 | 6,55 | 0,8526 | 0,0595 | |||
| OMC / Omnicom Group Inc. | 0,04 | 1,55 | 2,97 | −11,88 | 0,8513 | −0,1062 | |||
| ETR / Entergy Corporation | 0,04 | 1,54 | 2,95 | −1,27 | 0,8441 | −0,0033 | |||
| CAG / Conagra Brands, Inc. | 0,14 | 1,60 | 2,90 | −22,03 | 0,8307 | −0,2251 | |||
| TFC / Truist Financial Corporation | 0,07 | 1,48 | 2,88 | 6,04 | 0,8243 | 0,0538 | |||
| SRE / Sempra | 0,04 | 1,54 | 2,86 | 7,81 | 0,8184 | 0,0661 | |||
| ABBV / AbbVie Inc. | 0,02 | 1,54 | 2,86 | −10,05 | 0,8176 | −0,0831 | |||
| TXN / Texas Instruments Incorporated | 0,01 | 1,48 | 2,85 | 17,24 | 0,8158 | 0,1262 | |||
| PSX / Phillips 66 | 0,02 | 1,49 | 2,85 | −1,93 | 0,8143 | −0,0087 | |||
| MRK / Merck & Co., Inc. | 0,04 | 1,53 | 2,84 | −10,48 | 0,8141 | −0,0870 | |||
| CPB / The Campbell's Company | 0,09 | 1,60 | 2,81 | −22,00 | 0,8047 | −0,2177 | |||
| OKE / ONEOK, Inc. | 0,03 | 1,52 | 2,79 | −16,48 | 0,7993 | −0,1492 | |||
| DG / Dollar General Corporation | 0,02 | 1,49 | 2,78 | 32,05 | 0,7960 | 0,1984 | |||
| VLO / Valero Energy Corporation | 0,02 | 1,47 | 2,74 | 3,28 | 0,7841 | 0,0316 | |||
| KVUE / Kenvue Inc. | 0,13 | 1,51 | 2,68 | −11,43 | 0,7675 | −0,0910 | |||
| CFG / Citizens Financial Group, Inc. | 0,06 | 1,40 | 2,65 | 10,75 | 0,7579 | 0,0797 | |||
| EIX / Edison International | 0,05 | 1,50 | 2,64 | −11,10 | 0,7561 | −0,0869 | |||
| F / Ford Motor Company | 0,24 | 1,39 | 2,56 | 9,65 | 0,7320 | 0,0706 | |||
| TAP / Molson Coors Beverage Company | 0,05 | 1,50 | 2,54 | −19,82 | 0,7263 | −0,1713 | |||
| DOW / Dow Inc. | 0,09 | 1,49 | 2,50 | −23,06 | 0,7163 | −0,2061 | |||
| IP / International Paper Company | 0,05 | 1,44 | 2,50 | −10,95 | 0,7144 | −0,0808 | |||
| DVN / Devon Energy Corporation | 0,08 | 1,43 | 2,48 | −13,74 | 0,7097 | −0,1056 | |||
| ALLY / Ally Financial Inc. | 0,06 | 1,34 | 2,47 | 8,23 | 0,7076 | 0,0597 | |||
| CG / The Carlyle Group Inc. | 0,05 | 1,30 | 2,42 | 19,42 | 0,6936 | 0,1181 | |||
| GPC / Genuine Parts Company | 0,02 | 1,43 | 2,42 | 3,28 | 0,6934 | 0,0280 | |||
| UPS / United Parcel Service, Inc. | 0,02 | 1,36 | 2,38 | −7,01 | 0,6803 | −0,0445 | |||
| SLB / Schlumberger Limited | 0,07 | 1,38 | 2,37 | −18,00 | 0,6780 | −0,1417 | |||
| MCHP / Microchip Technology Incorporated | 0,03 | 1,32 | 2,36 | 47,29 | 0,6768 | 0,2214 | |||
| HPQ / HP Inc. | 0,09 | 1,37 | 2,27 | −10,46 | 0,6495 | −0,0694 | |||
| OVV / Ovintiv Inc. | 0,06 | 1,31 | 2,21 | −9,95 | 0,6321 | −0,0634 | |||
| CVS / CVS Health Corporation | 0,03 | 1,24 | 2,20 | 3,09 | 0,6310 | 0,0243 | |||
| OWL / Blue Owl Capital Inc. | 0,11 | 1,25 | 2,08 | −2,95 | 0,5944 | −0,0125 | |||
| SWK / Stanley Black & Decker, Inc. | 0,03 | 1,23 | 2,05 | −10,78 | 0,5873 | −0,0652 | |||
| BBY / Best Buy Co., Inc. | 0,03 | 1,31 | 2,03 | −7,60 | 0,5807 | −0,0422 | |||
| TGT / Target Corporation | 0,02 | 1,03 | 1,73 | −4,54 | 0,4942 | −0,0186 | |||
| S P 500 EMINI FUTURE SEP25 / DE (N/A) | 0,06 | 0,0164 | 0,0164 |