Grundläggande statistik
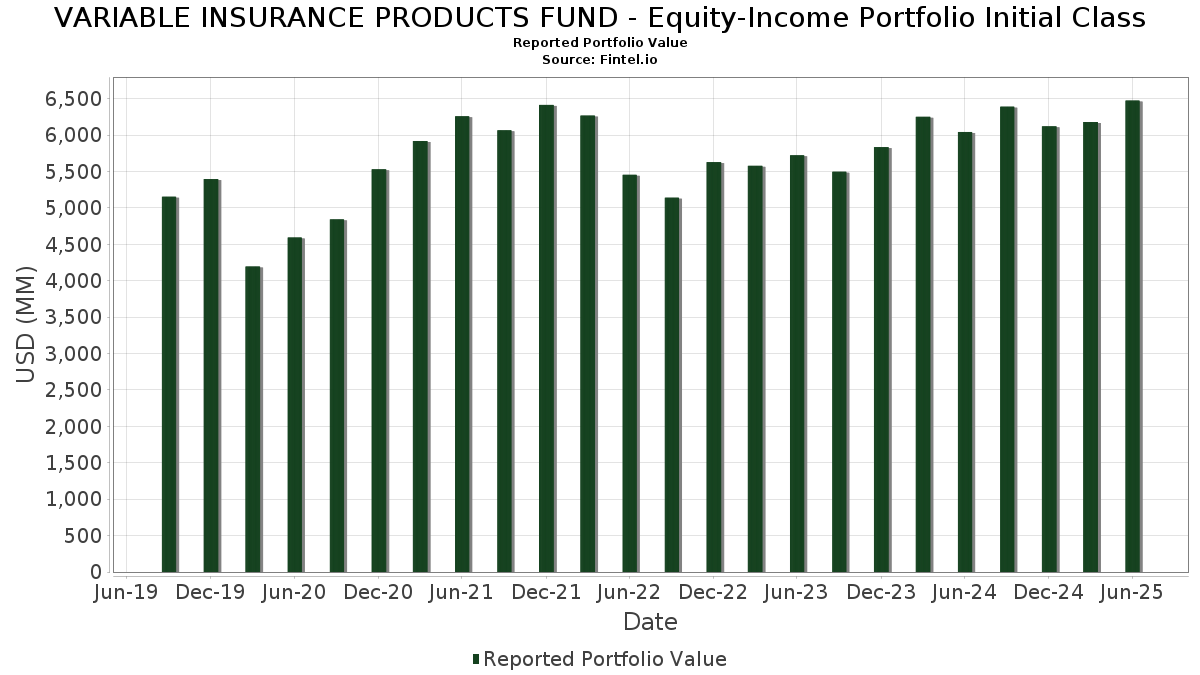
| Portföljvärde | $ 6 474 903 201 |
| Aktuella positioner | 125 |
Senaste innehav, resultat, förvaltat kapital (från 13F, 13D)
VARIABLE INSURANCE PRODUCTS FUND - Equity-Income Portfolio Initial Class har redovisat 125 totala innehav i sina senaste SEC-arkiveringar. Det senaste portföljvärdet beräknas vara $ 6 474 903 201 USD. Faktiskt förvaltade tillgångar (AUM) är detta värde plus likvida medel (som inte redovisas). VARIABLE INSURANCE PRODUCTS FUND - Equity-Income Portfolio Initial Classs största innehav är JPMorgan Chase & Co. (US:JPM) , Exxon Mobil Corporation (US:XOM) , Fidelity Cash Central Fund (US:US31635A1051) , Linde plc (US:LIN) , and Alphabet Inc. (US:GOOGL) . VARIABLE INSURANCE PRODUCTS FUND - Equity-Income Portfolio Initial Classs nya positioner inkluderar Meta Platforms, Inc. (US:META) , Amazon.com, Inc. (BG:AMZ) , adidas AG (US:ADDDF) , Imperial Brands PLC (CH:IMB) , and .
Största ökningarna detta kvartal
Vi använder förändringen i portföljallokeringen eftersom det är det mest meningsfulla måttet. Förändringar kan bero på transaktioner eller förändringar i aktiekurser.
| Värdepapper | Aktier (MM) |
Värde (MM$) |
Portfölj % av | ΔPortfölj % av |
|---|---|---|---|---|
| 0,81 | 141,98 | 2,2105 | 1,5764 | |
| 166,92 | 166,95 | 2,5992 | 1,1258 | |
| 0,04 | 32,92 | 0,5125 | 0,5125 | |
| 0,15 | 32,71 | 0,5092 | 0,5092 | |
| 0,72 | 89,46 | 1,3928 | 0,4074 | |
| 0,21 | 102,04 | 1,5887 | 0,3442 | |
| 0,19 | 61,50 | 0,9575 | 0,3366 | |
| 0,64 | 42,68 | 0,6644 | 0,3261 | |
| 0,95 | 75,49 | 1,1753 | 0,3255 | |
| 0,57 | 89,59 | 1,3948 | 0,3148 |
Största minskningarna detta kvartal
Vi använder förändringen i portföljallokeringen eftersom det är det mest meningsfulla måttet. Förändringar kan bero på transaktioner eller förändringar i aktiepriser.
| Värdepapper | Aktier (MM) |
Värde (MM$) |
Portfölj % av | ΔPortfölj % av |
|---|---|---|---|---|
| 0,48 | 88,79 | 1,3823 | −1,0798 | |
| 0,26 | 79,82 | 1,2427 | −1,0383 | |
| 0,25 | 64,96 | 1,0114 | −0,9714 | |
| 0,31 | 60,73 | 0,9455 | −0,5465 | |
| 0,22 | 21,11 | 0,3286 | −0,3817 | |
| 1,69 | 182,25 | 2,8374 | −0,3596 | |
| 0,28 | 67,33 | 1,0483 | −0,3284 | |
| 0,60 | 75,56 | 1,1765 | −0,2775 | |
| 1,28 | 45,66 | 0,7108 | −0,2768 | |
| 0,27 | 78,51 | 1,2223 | −0,2112 |
13F- och fond arkiveringar
Denna blankett lämnades in den 2025-08-22 för rapporteringsperioden 2025-06-30. Klicka på länksymbolen för att se hela transaktionshistoriken.
Uppgradera för att låsa upp premiumdata och exportera till Excel![]() .
.
| Värdepapper | Typ | Genomsnittligt aktiepris | Aktier (MM) |
ΔAktier (%) |
ΔAktier (%) |
Värde ($MM) |
Portfölj (%) |
ΔPortfölj (%) |
|
|---|---|---|---|---|---|---|---|---|---|
| JPM / JPMorgan Chase & Co. | 0,82 | −12,72 | 238,26 | 3,16 | 3,7094 | −0,0230 | |||
| XOM / Exxon Mobil Corporation | 1,69 | 1,63 | 182,25 | −7,88 | 2,8374 | −0,3596 | |||
| US31635A1051 / Fidelity Cash Central Fund | 166,92 | 83,10 | 166,95 | 83,10 | 2,5992 | 1,1258 | |||
| LIN / Linde plc | 0,31 | 0,00 | 147,27 | 0,76 | 2,2928 | −0,0690 | |||
| GOOGL / Alphabet Inc. | 0,81 | 217,49 | 141,98 | 261,82 | 2,2105 | 1,5764 | |||
| WFC / Wells Fargo & Company | 1,73 | 7,91 | 138,68 | 20,43 | 2,1591 | 0,2982 | |||
| WMT / Walmart Inc. | 1,31 | −14,97 | 127,99 | −5,29 | 1,9927 | −0,1911 | |||
| BAC / Bank of America Corporation | 2,69 | 0,00 | 127,28 | 13,40 | 1,9816 | 0,1678 | |||
| PG / The Procter & Gamble Company | 0,70 | 0,00 | 111,63 | −6,51 | 1,7379 | −0,1916 | |||
| CB / Chubb Limited | 0,36 | 0,00 | 105,08 | −4,06 | 1,6359 | −0,1340 | |||
| MSFT / Microsoft Corporation | 0,21 | 0,00 | 102,04 | 32,50 | 1,5887 | 0,3442 | |||
| GILD / Gilead Sciences, Inc. | 0,87 | −3,05 | 96,31 | −4,07 | 1,4995 | −0,1229 | |||
| JNJ / Johnson & Johnson | 0,61 | 0,00 | 93,48 | −7,89 | 1,4553 | −0,1847 | |||
| ITT / ITT Inc. | 0,57 | 10,40 | 89,59 | 34,04 | 1,3948 | 0,3148 | |||
| DIS / The Walt Disney Company | 0,72 | 16,77 | 89,46 | 46,71 | 1,3928 | 0,4074 | |||
| ABBV / AbbVie Inc. | 0,48 | −34,22 | 88,79 | −41,73 | 1,3823 | −1,0798 | |||
| TSM / Taiwan Semiconductor Manufacturing Company Limited - Depositary Receipt (Common Stock) | 0,39 | −24,18 | 87,58 | 3,45 | 1,3635 | −0,0045 | |||
| PNC / The PNC Financial Services Group, Inc. | 0,47 | −11,55 | 86,97 | −6,19 | 1,3540 | −0,1440 | |||
| CSCO / Cisco Systems, Inc. | 1,23 | 9,09 | 85,54 | 22,65 | 1,3317 | 0,2047 | |||
| UNH / UnitedHealth Group Incorporated | 0,26 | −5,07 | 79,82 | −43,45 | 1,2427 | −1,0383 | |||
| KO / The Coca-Cola Company | 1,12 | 20,51 | 78,99 | 19,05 | 1,2298 | 0,1576 | |||
| MCD / McDonald's Corporation | 0,27 | −5,38 | 78,51 | −11,50 | 1,2223 | −0,2112 | |||
| NEE / NextEra Energy, Inc. | 1,12 | 12,47 | 77,49 | 10,14 | 1,2064 | 0,0695 | |||
| HIG / The Hartford Insurance Group, Inc. | 0,60 | −18,10 | 75,56 | −16,02 | 1,1765 | −0,2775 | |||
| MRK / Merck & Co., Inc. | 0,95 | 62,77 | 75,49 | 43,54 | 1,1753 | 0,3255 | |||
| TRV / The Travelers Companies, Inc. | 0,28 | 0,00 | 74,79 | 1,16 | 1,1644 | −0,0303 | |||
| TMUS / T-Mobile US, Inc. | 0,28 | −11,53 | 67,33 | −20,97 | 1,0483 | −0,3284 | |||
| MTB / M&T Bank Corporation | 0,34 | 0,00 | 66,28 | 8,53 | 1,0319 | 0,0450 | |||
| TJX / The TJX Companies, Inc. | 0,54 | −11,68 | 66,25 | −10,45 | 1,0314 | −0,1641 | |||
| GE / General Electric Company | 0,25 | −58,83 | 64,96 | −47,06 | 1,0114 | −0,9714 | |||
| SCHW / The Charles Schwab Corporation | 0,71 | 0,00 | 64,79 | 16,56 | 1,0087 | 0,1104 | |||
| NXPI / NXP Semiconductors N.V. | 0,29 | 0,03 | 63,45 | 14,99 | 0,9878 | 0,0962 | |||
| AZN / Astrazeneca plc | 0,45 | 0,00 | 63,06 | −5,23 | 0,9818 | −0,0935 | |||
| MMC / Marsh & McLennan Companies, Inc. | 0,28 | 0,18 | 62,07 | −10,25 | 0,9664 | −0,1512 | |||
| CEG / Constellation Energy Corporation | 0,19 | 0,00 | 61,50 | 60,08 | 0,9575 | 0,3366 | |||
| LOW / Lowe's Companies, Inc. | 0,27 | 0,00 | 60,86 | −4,87 | 0,9475 | −0,0863 | |||
| DHR / Danaher Corporation | 0,31 | −31,74 | 60,73 | −34,22 | 0,9455 | −0,5465 | |||
| KDP / Keurig Dr Pepper Inc. | 1,83 | 8,66 | 60,59 | 4,98 | 0,9433 | 0,0106 | |||
| LAMR / Lamar Advertising Company | 0,50 | 0,00 | 60,10 | 6,66 | 0,9357 | 0,0252 | |||
| NSC / Norfolk Southern Corporation | 0,23 | 0,00 | 59,85 | 8,07 | 0,9317 | 0,0369 | |||
| JCI / Johnson Controls International plc | 0,54 | 0,00 | 57,37 | 31,84 | 0,8932 | 0,1900 | |||
| T / AT&T Inc. | 1,98 | 5,74 | 57,24 | 8,21 | 0,8912 | 0,0364 | |||
| SO / The Southern Company | 0,61 | 0,00 | 56,35 | −0,13 | 0,8773 | −0,0345 | |||
| CR / Crane Company | 0,29 | −11,30 | 54,54 | 9,95 | 0,8491 | 0,0476 | |||
| COF / Capital One Financial Corporation | 0,25 | −5,79 | 54,18 | 11,79 | 0,8435 | 0,0603 | |||
| ACN / Accenture plc | 0,18 | 0,00 | 54,01 | −4,21 | 0,8409 | −0,0703 | |||
| BLK / BlackRock, Inc. | 0,05 | −0,35 | 53,85 | 10,47 | 0,8384 | 0,0507 | |||
| PSA / Public Storage | 0,18 | 61,16 | 53,48 | 58,00 | 0,8326 | 0,2856 | |||
| VZ / Verizon Communications Inc. | 1,23 | 0,00 | 53,39 | −4,61 | 0,8312 | −0,0732 | |||
| HBAN / Huntington Bancshares Incorporated | 3,09 | 0,00 | 51,83 | 11,66 | 0,8070 | 0,0568 | |||
| 005930 / Samsung Electronics Co., Ltd. | 1,15 | 17,26 | 50,93 | 30,84 | 0,7929 | 0,1639 | |||
| VST / Vistra Corp. | 0,26 | 0,00 | 50,33 | 65,03 | 0,7836 | 0,2908 | |||
| RR. / Rolls-Royce Holdings plc | 3,65 | 17,54 | 48,31 | 60,27 | 0,7521 | 0,2650 | |||
| SHEL N / Shell plc | 1,38 | 0,00 | 48,10 | −4,15 | 0,7489 | −0,0621 | |||
| USB / U.S. Bancorp | 1,06 | 7,09 | 47,82 | 14,78 | 0,7445 | 0,0713 | |||
| BJ / BJ's Wholesale Club Holdings, Inc. | 0,44 | 10,77 | 47,30 | 4,68 | 0,7364 | 0,0063 | |||
| IMO / Imperial Oil Limited | 0,59 | −3,51 | 47,00 | 6,11 | 0,7318 | 0,0160 | |||
| GD / General Dynamics Corporation | 0,16 | 0,00 | 46,64 | 7,00 | 0,7261 | 0,0217 | |||
| NOC / Northrop Grumman Corporation | 0,09 | 6,34 | 46,10 | 3,85 | 0,7177 | 0,0003 | |||
| CMCSA / Comcast Corporation | 1,28 | −22,77 | 45,66 | −25,30 | 0,7108 | −0,2768 | |||
| CCK / Crown Holdings, Inc. | 0,44 | −17,27 | 45,24 | −4,56 | 0,7044 | −0,0616 | |||
| GEV / GE Vernova Inc. | 0,08 | −54,24 | 43,72 | −20,68 | 0,6807 | −0,2100 | |||
| LLY / Eli Lilly and Company | 0,06 | 0,00 | 42,92 | −5,61 | 0,6682 | −0,0666 | |||
| QSR / Restaurant Brands International Inc. | 0,64 | 104,83 | 42,68 | 103,82 | 0,6644 | 0,3261 | |||
| TPR / Tapestry, Inc. | 0,48 | 11,60 | 42,27 | 39,18 | 0,6582 | 0,1673 | |||
| ADI / Analog Devices, Inc. | 0,18 | 0,00 | 41,82 | 18,03 | 0,6511 | 0,0785 | |||
| AME / AMETEK, Inc. | 0,23 | −15,46 | 41,28 | −11,13 | 0,6427 | −0,1080 | |||
| DOX / Amdocs Limited | 0,45 | 0,00 | 41,23 | −0,28 | 0,6418 | −0,0263 | |||
| AFG / American Financial Group, Inc. | 0,31 | 21,76 | 39,37 | 17,00 | 0,6129 | 0,0692 | |||
| WSO / Watsco, Inc. | 0,09 | 0,00 | 37,96 | −13,12 | 0,5910 | −0,1150 | |||
| AMT / American Tower Corporation | 0,17 | 0,00 | 37,39 | 1,57 | 0,5821 | −0,0127 | |||
| APO / Apollo Global Management, Inc. | 0,26 | 0,00 | 37,00 | 3,60 | 0,5760 | −0,0011 | |||
| CNQ / Canadian Natural Resources Limited | 1,18 | 0,00 | 36,98 | 2,14 | 0,5758 | −0,0093 | |||
| HII / Huntington Ingalls Industries, Inc. | 0,15 | 10,23 | 36,44 | 30,44 | 0,5673 | 0,1159 | |||
| V / Visa Inc. | 0,10 | −25,27 | 35,99 | −24,29 | 0,5603 | −0,2078 | |||
| HIA1 / Hitachi, Ltd. | 1,24 | 23,85 | 35,91 | 53,31 | 0,5591 | 0,1806 | |||
| DKS / DICK'S Sporting Goods, Inc. | 0,18 | 13,95 | 35,61 | 11,83 | 0,5544 | 0,0398 | |||
| BALL / Ball Corporation | 0,63 | 0,00 | 35,17 | 7,72 | 0,5475 | 0,0200 | |||
| CI / The Cigna Group | 0,11 | −8,20 | 34,90 | −7,76 | 0,5434 | −0,0681 | |||
| HES / Hess Corporation | 0,25 | −8,61 | 34,74 | −20,73 | 0,5409 | −0,1674 | |||
| EPD / Enterprise Products Partners L.P. - Limited Partnership | 1,08 | −13,39 | 33,62 | −21,33 | 0,5234 | −0,1672 | |||
| META / Meta Platforms, Inc. | 0,04 | 32,92 | 0,5125 | 0,5125 | |||||
| TGT / Target Corporation | 0,33 | 12,00 | 32,89 | 5,87 | 0,5121 | 0,0100 | |||
| AMZ / Amazon.com, Inc. | 0,15 | 32,71 | 0,5092 | 0,5092 | |||||
| BURL / Burlington Stores, Inc. | 0,14 | 0,00 | 32,01 | −2,39 | 0,4983 | −0,0316 | |||
| MDLZ / Mondelez International, Inc. | 0,47 | 0,00 | 31,51 | −0,60 | 0,4905 | −0,0217 | |||
| SBUX / Starbucks Corporation | 0,33 | 184,72 | 29,98 | 165,98 | 0,4667 | 0,2846 | |||
| SIE / Siemens Aktiengesellschaft | 0,11 | 17,03 | 28,99 | 30,17 | 0,4513 | 0,0914 | |||
| MTRAF / Metro Inc. | 0,37 | 23,86 | 28,90 | 39,91 | 0,4499 | 0,1161 | |||
| GSKL / GSK plc | 1,51 | 38,32 | 28,84 | 38,00 | 0,4491 | 0,1113 | |||
| ROG / Roche Holding AG | 0,09 | −15,89 | 28,61 | −16,38 | 0,4455 | −0,1075 | |||
| UNA / Unilever PLC | 0,46 | 31,03 | 28,34 | 34,01 | 0,4412 | 0,0995 | |||
| 01626P148 / Alimentation Couche-Tard Inc | 0,57 | 29,23 | 28,23 | 30,25 | 0,4394 | 0,0893 | |||
| FCX / Freeport-McMoRan Inc. | 0,64 | −21,20 | 27,66 | −9,77 | 0,4306 | −0,0647 | |||
| RPRX / Royalty Pharma plc | 0,75 | 37,52 | 27,19 | 59,17 | 0,4233 | 0,1473 | |||
| HRB / H&R Block, Inc. | 0,48 | 0,00 | 26,31 | −0,04 | 0,4096 | −0,0157 | |||
| AAPL / Apple Inc. | 0,13 | 0,00 | 26,25 | −7,63 | 0,4086 | −0,0506 | |||
| EXC / Exelon Corporation | 0,56 | 15,00 | 24,43 | 8,36 | 0,3804 | 0,0160 | |||
| WEC / WEC Energy Group, Inc. | 0,23 | 0,00 | 23,86 | −4,39 | 0,3715 | −0,0318 | |||
| CNP / CenterPoint Energy, Inc. | 0,62 | 0,00 | 22,90 | 1,41 | 0,3566 | −0,0084 | |||
| KVUE / Kenvue Inc. | 1,09 | 0,00 | 22,86 | −12,72 | 0,3559 | −0,0673 | |||
| AVGO / Broadcom Inc. | 0,08 | 114,83 | 22,50 | 253,69 | 0,3503 | 0,2475 | |||
| AEE / Ameren Corporation | 0,23 | 0,00 | 21,91 | −4,34 | 0,3411 | −0,0290 | |||
| GEN / Gen Digital Inc. | 0,74 | 26,71 | 21,86 | 40,36 | 0,3403 | 0,0886 | |||
| SAN / Santander UK plc - Preferred Stock | 0,22 | −45,09 | 21,11 | −51,98 | 0,3286 | −0,3817 | |||
| VK / Vallourec S.A. | 1,13 | 0,00 | 20,97 | −2,02 | 0,3264 | −0,0194 | |||
| PCG / PG&E Corporation | 1,37 | 15,35 | 19,09 | −6,41 | 0,2972 | −0,0324 | |||
| FE / FirstEnergy Corp. | 0,47 | 19,05 | 18,95 | 18,58 | 0,2950 | 0,0368 | |||
| CXT / Crane NXT, Co. | 0,35 | 0,00 | 18,68 | 4,86 | 0,2908 | 0,0030 | |||
| PRY / Tion Renewables AG | 0,26 | 44,79 | 18,58 | 86,21 | 0,2893 | 0,1281 | |||
| VLTO / Veralto Corporation | 0,18 | 0,00 | 17,93 | 3,59 | 0,2792 | −0,0005 | |||
| SJM / The J. M. Smucker Company | 0,18 | 0,00 | 17,39 | −17,07 | 0,2708 | −0,0681 | |||
| VLO / Valero Energy Corporation | 0,13 | 0,00 | 17,22 | 1,78 | 0,2682 | −0,0053 | |||
| PSX / Phillips 66 | 0,14 | −17,62 | 16,89 | −20,41 | 0,2630 | −0,0800 | |||
| GFL / GFL Environmental Inc. | 0,31 | 0,51 | 15,79 | 5,04 | 0,2459 | 0,0029 | |||
| SWX / Southwest Gas Holdings, Inc. | 0,21 | 0,00 | 15,38 | 3,60 | 0,2395 | −0,0004 | |||
| KBR / KBR, Inc. | 0,29 | −24,04 | 13,71 | −26,89 | 0,2134 | −0,0896 | |||
| ACI / Albertsons Companies, Inc. | 0,55 | 38,29 | 11,92 | 35,28 | 0,1856 | 0,0432 | |||
| ADDDF / adidas AG | 0,05 | 11,17 | 0,1739 | 0,1739 | |||||
| COST / Costco Wholesale Corporation | 0,01 | 0,00 | 7,62 | 4,67 | 0,1187 | 0,0010 | |||
| IMB / Imperial Brands PLC | 0,13 | 4,95 | 0,0771 | 0,0771 | |||||
| HI / Hillenbrand, Inc. | 0,22 | −17,68 | 4,50 | −31,56 | 0,0701 | −0,0362 | |||
| COLM / Columbia Sportswear Company | 0,05 | 0,00 | 2,88 | −19,30 | 0,0448 | −0,0128 | |||
| US31635A3032 / Fidelity Securities Lending Cash Central Fund | 1,92 | 388,07 | 1,92 | 388,52 | 0,0298 | 0,0235 | |||
| RRX / Regal Rexnord Corporation | 0,00 | −97,38 | 0,35 | −96,67 | 0,0055 | −0,1647 |