Grundläggande statistik
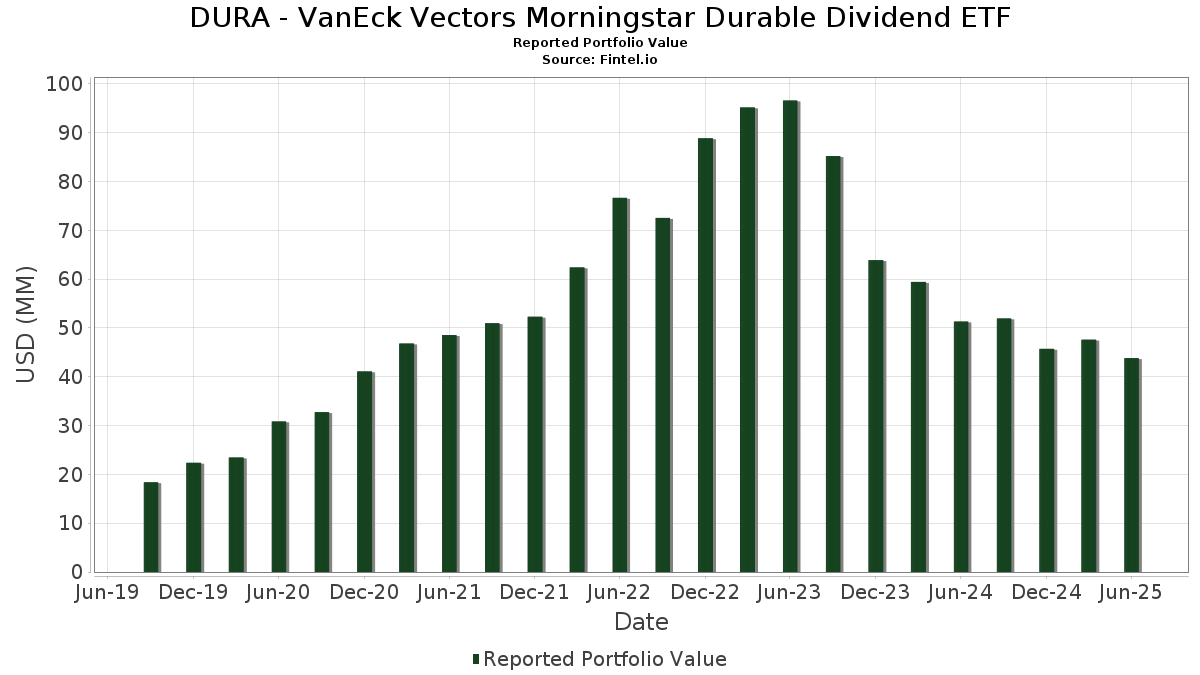
| Portföljvärde | $ 43 802 599 |
| Aktuella positioner | 62 |
Senaste innehav, resultat, förvaltat kapital (från 13F, 13D)
DURA - VanEck Vectors Morningstar Durable Dividend ETF har redovisat 62 totala innehav i sina senaste SEC-arkiveringar. Det senaste portföljvärdet beräknas vara $ 43 802 599 USD. Faktiskt förvaltade tillgångar (AUM) är detta värde plus likvida medel (som inte redovisas). DURA - VanEck Vectors Morningstar Durable Dividend ETFs största innehav är Texas Instruments Incorporated (US:TXN) , Exxon Mobil Corporation (US:XOM) , Verizon Communications Inc. (US:VZ) , Altria Group, Inc. (US:MO) , and Johnson & Johnson (US:JNJ) .
Största ökningarna detta kvartal
Vi använder förändringen i portföljallokeringen eftersom det är det mest meningsfulla måttet. Förändringar kan bero på transaktioner eller förändringar i aktiekurser.
| Värdepapper | Aktier (MM) |
Värde (MM$) |
Portfölj % av | ΔPortfölj % av |
|---|---|---|---|---|
| 0,01 | 2,40 | 5,4548 | 0,9320 | |
| 0,00 | 1,44 | 3,2656 | 0,4437 | |
| 0,01 | 1,29 | 2,9276 | 0,3065 | |
| 0,00 | 0,61 | 1,3734 | 0,2915 | |
| 0,00 | 0,57 | 1,2857 | 0,2056 | |
| 0,00 | 0,44 | 1,0016 | 0,1938 | |
| 0,00 | 0,65 | 1,4747 | 0,1541 | |
| 0,00 | 0,57 | 1,2908 | 0,1463 | |
| 0,00 | 1,03 | 2,3359 | 0,1187 | |
| 0,00 | 0,42 | 0,9527 | 0,1118 |
Största minskningarna detta kvartal
Vi använder förändringen i portföljallokeringen eftersom det är det mest meningsfulla måttet. Förändringar kan bero på transaktioner eller förändringar i aktiepriser.
| Värdepapper | Aktier (MM) |
Värde (MM$) |
Portfölj % av | ΔPortfölj % av |
|---|---|---|---|---|
| 0,01 | 2,00 | 4,5478 | −0,5422 | |
| 0,01 | 1,85 | 4,2077 | −0,3694 | |
| 0,02 | 0,61 | 1,3852 | −0,3647 | |
| 0,02 | 1,77 | 4,0218 | −0,3468 | |
| 0,01 | 0,91 | 2,0539 | −0,3375 | |
| 0,02 | 2,21 | 5,0081 | −0,2847 | |
| 0,01 | 2,02 | 4,5877 | −0,1838 | |
| 0,02 | 1,75 | 3,9773 | −0,1743 | |
| 0,01 | 0,46 | 1,0406 | −0,1722 | |
| 0,00 | 0,62 | 1,4060 | −0,1613 |
13F- och fond arkiveringar
Denna blankett lämnades in den 2025-08-21 för rapporteringsperioden 2025-06-30. Klicka på länksymbolen för att se hela transaktionshistoriken.
Uppgradera för att låsa upp premiumdata och exportera till Excel![]() .
.
| Värdepapper | Typ | Genomsnittligt aktiepris | Aktier (MM) |
ΔAktier (%) |
ΔAktier (%) |
Värde ($MM) |
Portfölj (%) |
ΔPortfölj (%) |
|
|---|---|---|---|---|---|---|---|---|---|
| TXN / Texas Instruments Incorporated | 0,01 | −3,65 | 2,40 | 11,30 | 5,4548 | 0,9320 | |||
| XOM / Exxon Mobil Corporation | 0,02 | −3,65 | 2,21 | −12,66 | 5,0081 | −0,2847 | |||
| VZ / Verizon Communications Inc. | 0,05 | −3,65 | 2,18 | −8,10 | 4,9444 | −0,0210 | |||
| MO / Altria Group, Inc. | 0,04 | −3,65 | 2,10 | −5,87 | 4,7684 | 0,0922 | |||
| JNJ / Johnson & Johnson | 0,01 | −3,65 | 2,02 | −11,24 | 4,5877 | −0,1838 | |||
| CVX / Chevron Corporation | 0,01 | −3,65 | 2,00 | −17,56 | 4,5478 | −0,5422 | |||
| PFE / Pfizer Inc. | 0,08 | −3,65 | 2,00 | −7,85 | 4,5292 | −0,0066 | |||
| MCD / McDonald's Corporation | 0,01 | −3,66 | 1,99 | −9,86 | 4,5194 | −0,1097 | |||
| PEP / PepsiCo, Inc. | 0,01 | −3,65 | 1,85 | −15,19 | 4,2077 | −0,3694 | |||
| MRK / Merck & Co., Inc. | 0,02 | −3,65 | 1,77 | −15,05 | 4,0218 | −0,3468 | |||
| UPS / United Parcel Service, Inc. | 0,02 | −3,65 | 1,75 | −11,55 | 3,9773 | −0,1743 | |||
| BLK / BlackRock, Inc. | 0,00 | −3,65 | 1,44 | 6,83 | 3,2656 | 0,4437 | |||
| DUK / Duke Energy Corporation | 0,01 | −3,66 | 1,36 | −6,78 | 3,0898 | 0,0302 | |||
| BX / Blackstone Inc. | 0,01 | −3,66 | 1,29 | 3,12 | 2,9276 | 0,3065 | |||
| LOW / Lowe's Companies, Inc. | 0,00 | −3,66 | 1,04 | −8,38 | 2,3590 | −0,0167 | |||
| ADP / Automatic Data Processing, Inc. | 0,00 | −3,66 | 1,03 | −2,74 | 2,3359 | 0,1187 | |||
| OKE / ONEOK, Inc. | 0,01 | −3,65 | 0,91 | −20,75 | 2,0539 | −0,3375 | |||
| PSX / Phillips 66 | 0,01 | −3,66 | 0,77 | −6,93 | 1,7398 | 0,0147 | |||
| GD / General Dynamics Corporation | 0,00 | −3,67 | 0,65 | 3,17 | 1,4747 | 0,1541 | |||
| APD / Air Products and Chemicals, Inc. | 0,00 | −3,65 | 0,63 | −7,87 | 1,4352 | −0,0023 | |||
| KMB / Kimberly-Clark Corporation | 0,00 | −3,65 | 0,63 | −12,64 | 1,4268 | −0,0810 | |||
| FANG / Diamondback Energy, Inc. | 0,00 | −3,65 | 0,62 | −17,25 | 1,4060 | −0,1613 | |||
| DOW / Dow Inc. | 0,02 | −3,65 | 0,61 | −26,95 | 1,3852 | −0,3647 | |||
| EMR / Emerson Electric Co. | 0,00 | −3,65 | 0,61 | 17,25 | 1,3734 | 0,2915 | |||
| NSC / Norfolk Southern Corporation | 0,00 | −3,68 | 0,57 | 4,21 | 1,2908 | 0,1463 | |||
| MPC / Marathon Petroleum Corporation | 0,00 | −3,64 | 0,57 | 9,90 | 1,2857 | 0,2056 | |||
| KHC / The Kraft Heinz Company | 0,02 | −3,66 | 0,50 | −18,31 | 1,1450 | −0,1478 | |||
| TROW / T. Rowe Price Group, Inc. | 0,00 | −3,66 | 0,48 | 1,27 | 1,0845 | 0,0954 | |||
| Smurfit WestRock PLC / EC (IE00028FXN24) | 0,01 | −3,66 | 0,47 | −7,81 | 1,0721 | −0,0005 | |||
| FDX / FedEx Corporation | 0,00 | −3,65 | 0,47 | −10,19 | 1,0612 | −0,0290 | |||
| LYB / LyondellBasell Industries N.V. | 0,01 | −3,65 | 0,46 | −20,90 | 1,0406 | −0,1722 | |||
| WEC / WEC Energy Group, Inc. | 0,00 | −3,66 | 0,45 | −7,85 | 1,0133 | −0,0020 | |||
| STT / State Street Corporation | 0,00 | −3,64 | 0,44 | 14,55 | 1,0016 | 0,1938 | |||
| MTB / M&T Bank Corporation | 0,00 | −3,65 | 0,42 | 4,49 | 0,9527 | 0,1118 | |||
| FIS / Fidelity National Information Services, Inc. | 0,00 | −3,66 | 0,39 | 4,88 | 0,8798 | 0,1066 | |||
| FE / FirstEnergy Corp. | 0,01 | −3,66 | 0,38 | −4,03 | 0,8657 | 0,0330 | |||
| BKR / Baker Hughes Company | 0,01 | −3,65 | 0,32 | −16,15 | 0,7323 | −0,0718 | |||
| PPL / PPL Corporation | 0,01 | −3,65 | 0,32 | −9,66 | 0,7229 | −0,0149 | |||
| PPG / PPG Industries, Inc. | 0,00 | −3,65 | 0,27 | 0,37 | 0,6206 | 0,0491 | |||
| EVRG / Evergy, Inc. | 0,00 | −3,65 | 0,26 | −3,70 | 0,5906 | 0,0247 | |||
| DD / DuPont de Nemours, Inc. | 0,00 | −3,65 | 0,24 | −11,36 | 0,5499 | −0,0237 | |||
| K / Kellanova | 0,00 | −3,64 | 0,24 | −6,92 | 0,5490 | 0,0036 | |||
| CAG / Conagra Brands, Inc. | 0,01 | −3,65 | 0,22 | −26,09 | 0,5026 | −0,1247 | |||
| TSN / Tyson Foods, Inc. | 0,00 | −3,64 | 0,22 | −15,56 | 0,4934 | −0,0457 | |||
| HAL / Halliburton Company | 0,01 | −3,65 | 0,21 | −22,68 | 0,4728 | −0,0910 | |||
| CLX / The Clorox Company | 0,00 | −3,65 | 0,21 | −21,37 | 0,4677 | −0,0817 | |||
| SWKS / Skyworks Solutions, Inc. | 0,00 | −3,64 | 0,20 | 10,87 | 0,4649 | 0,0787 | |||
| LNT / Alliant Energy Corporation | 0,00 | −3,65 | 0,20 | −9,82 | 0,4604 | −0,0089 | |||
| BAX / Baxter International Inc. | 0,01 | −3,65 | 0,17 | −14,85 | 0,3915 | −0,0325 | |||
| MOS / The Mosaic Company | 0,00 | −3,66 | 0,17 | 30,47 | 0,3791 | 0,1102 | |||
| RPRX / Royalty Pharma plc | 0,00 | −3,66 | 0,16 | 11,35 | 0,3568 | 0,0614 | |||
| HRL / Hormel Foods Corporation | 0,00 | −3,66 | 0,14 | −5,30 | 0,3247 | 0,0065 | |||
| WTRG / Essential Utilities, Inc. | 0,00 | −3,66 | 0,13 | −9,79 | 0,2949 | −0,0058 | |||
| IVZ / Invesco Ltd. | 0,01 | −3,65 | 0,12 | 0,87 | 0,2633 | 0,0207 | |||
| WU / The Western Union Company | 0,01 | −3,65 | 0,11 | −23,36 | 0,2393 | −0,0488 | |||
| JHG / Janus Henderson Group plc | 0,00 | −3,63 | 0,09 | 3,57 | 0,1989 | 0,0216 | |||
| POR / Portland General Electric Company | 0,00 | −3,63 | 0,08 | −12,22 | 0,1808 | −0,0093 | |||
| NJR / New Jersey Resources Corporation | 0,00 | −3,65 | 0,07 | −11,84 | 0,1529 | −0,0074 | |||
| AOS / A. O. Smith Corporation | 0,00 | −3,68 | 0,07 | −2,90 | 0,1520 | 0,0068 | |||
| FHI / Federated Hermes, Inc. | 0,00 | −3,66 | 0,05 | 4,08 | 0,1164 | 0,0138 | |||
| GNTX / Gentex Corporation | 0,00 | −3,66 | 0,04 | −8,70 | 0,0959 | −0,0014 | |||
| CNS / Cohen & Steers, Inc. | 0,00 | −3,70 | 0,03 | −10,71 | 0,0578 | −0,0012 |